> ## Documentation Index
> Fetch the complete documentation index at: https://docs.tenderly.co/llms.txt
> Use this file to discover all available pages before exploring further.
# Execution Overview
> Get a bird's-eye view of a transaction with the function trace, call trace, contracts, events, state changes, and gas profiler in one place.
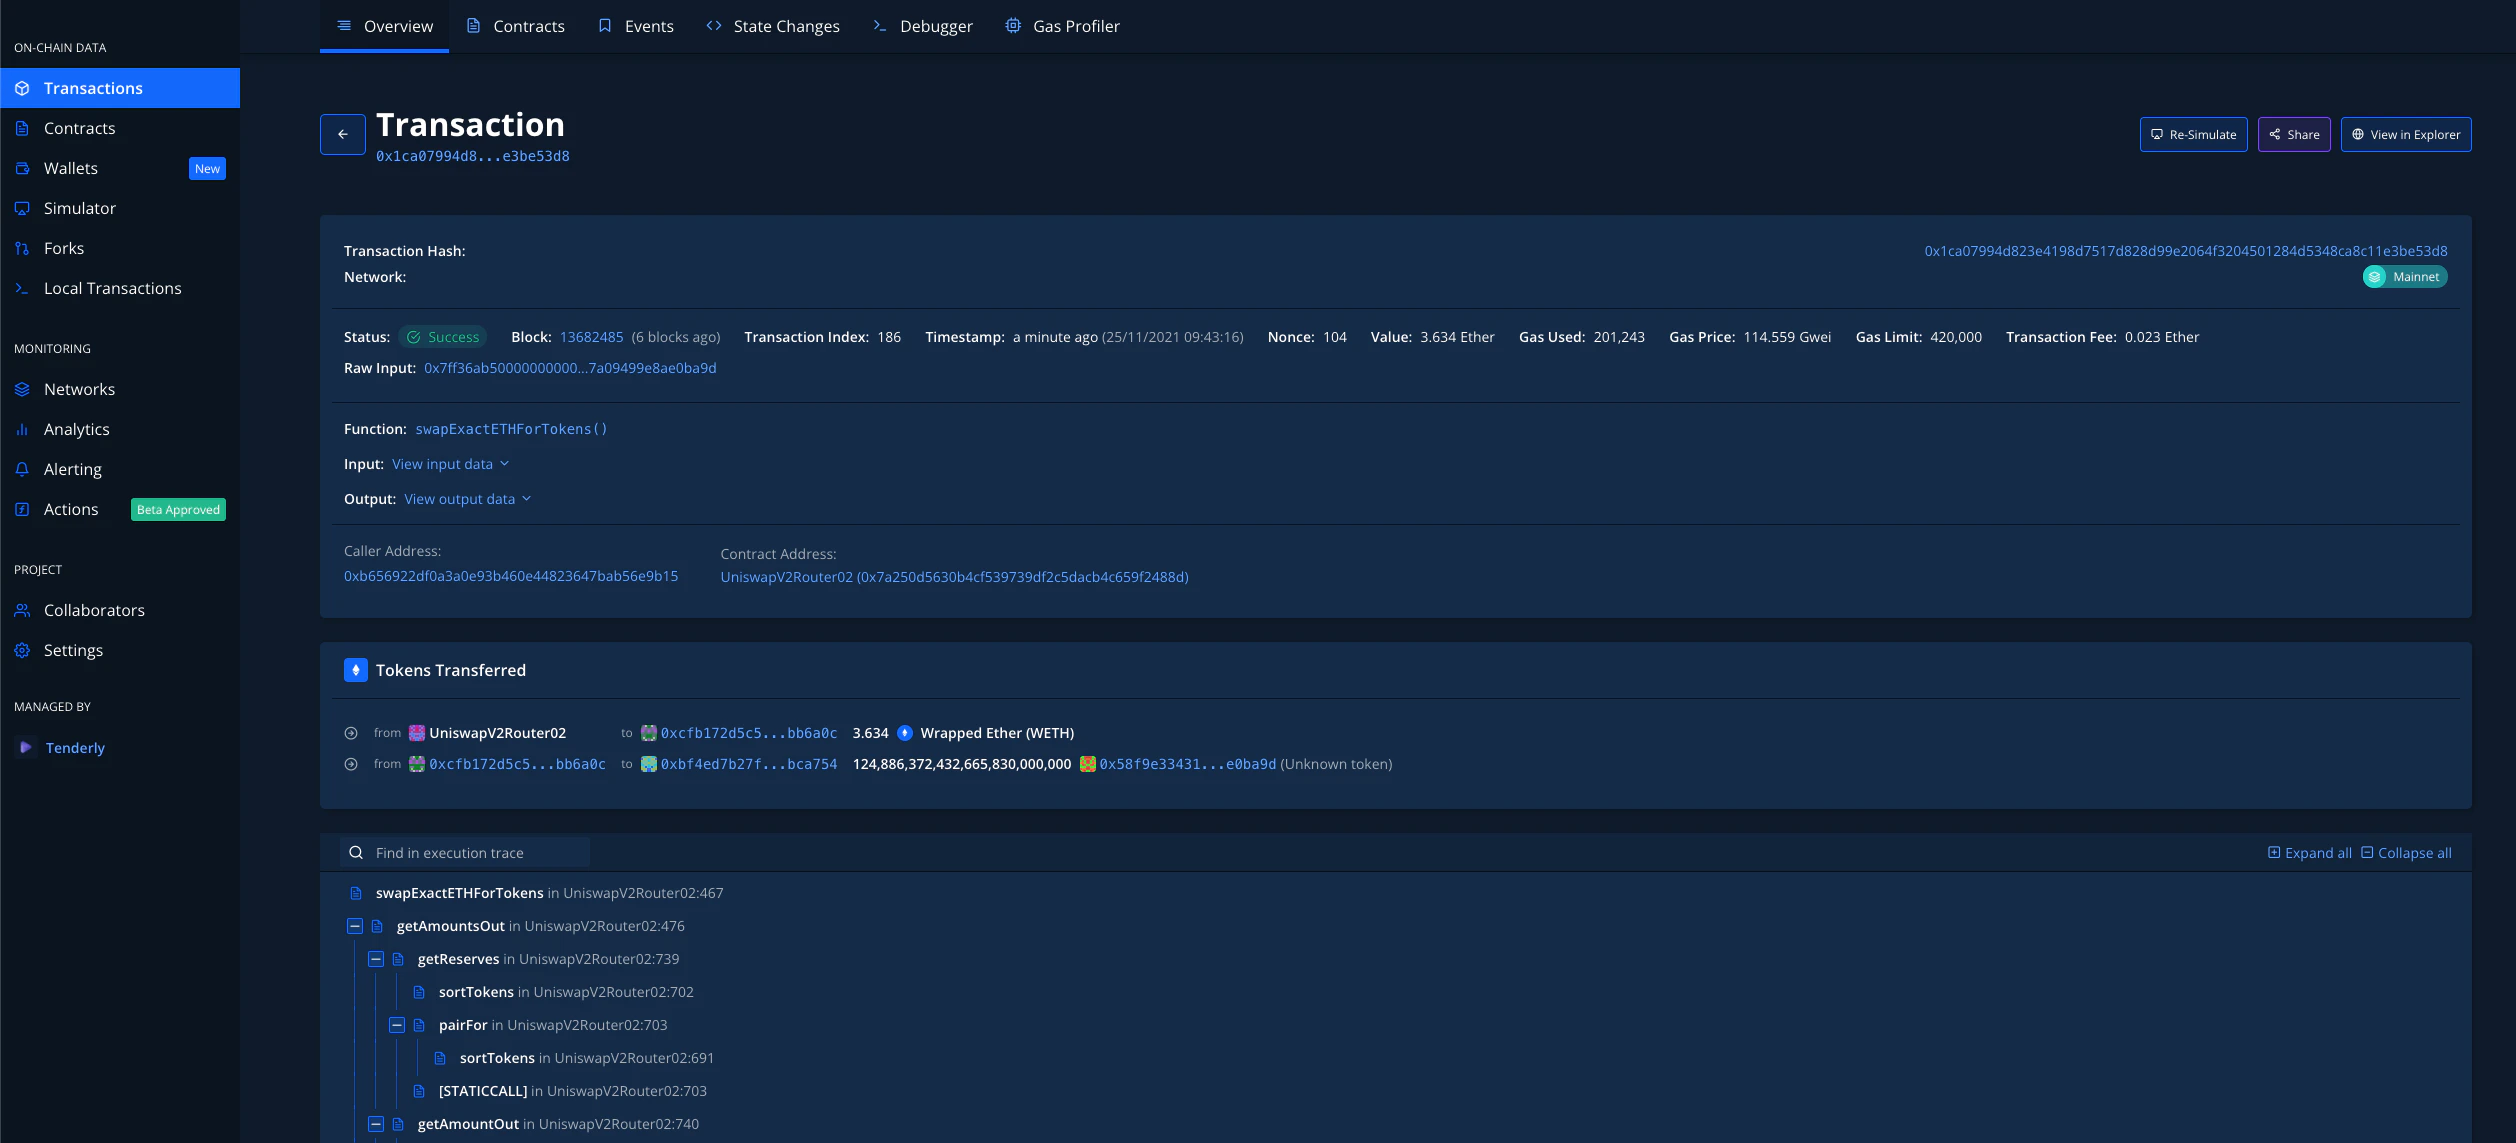
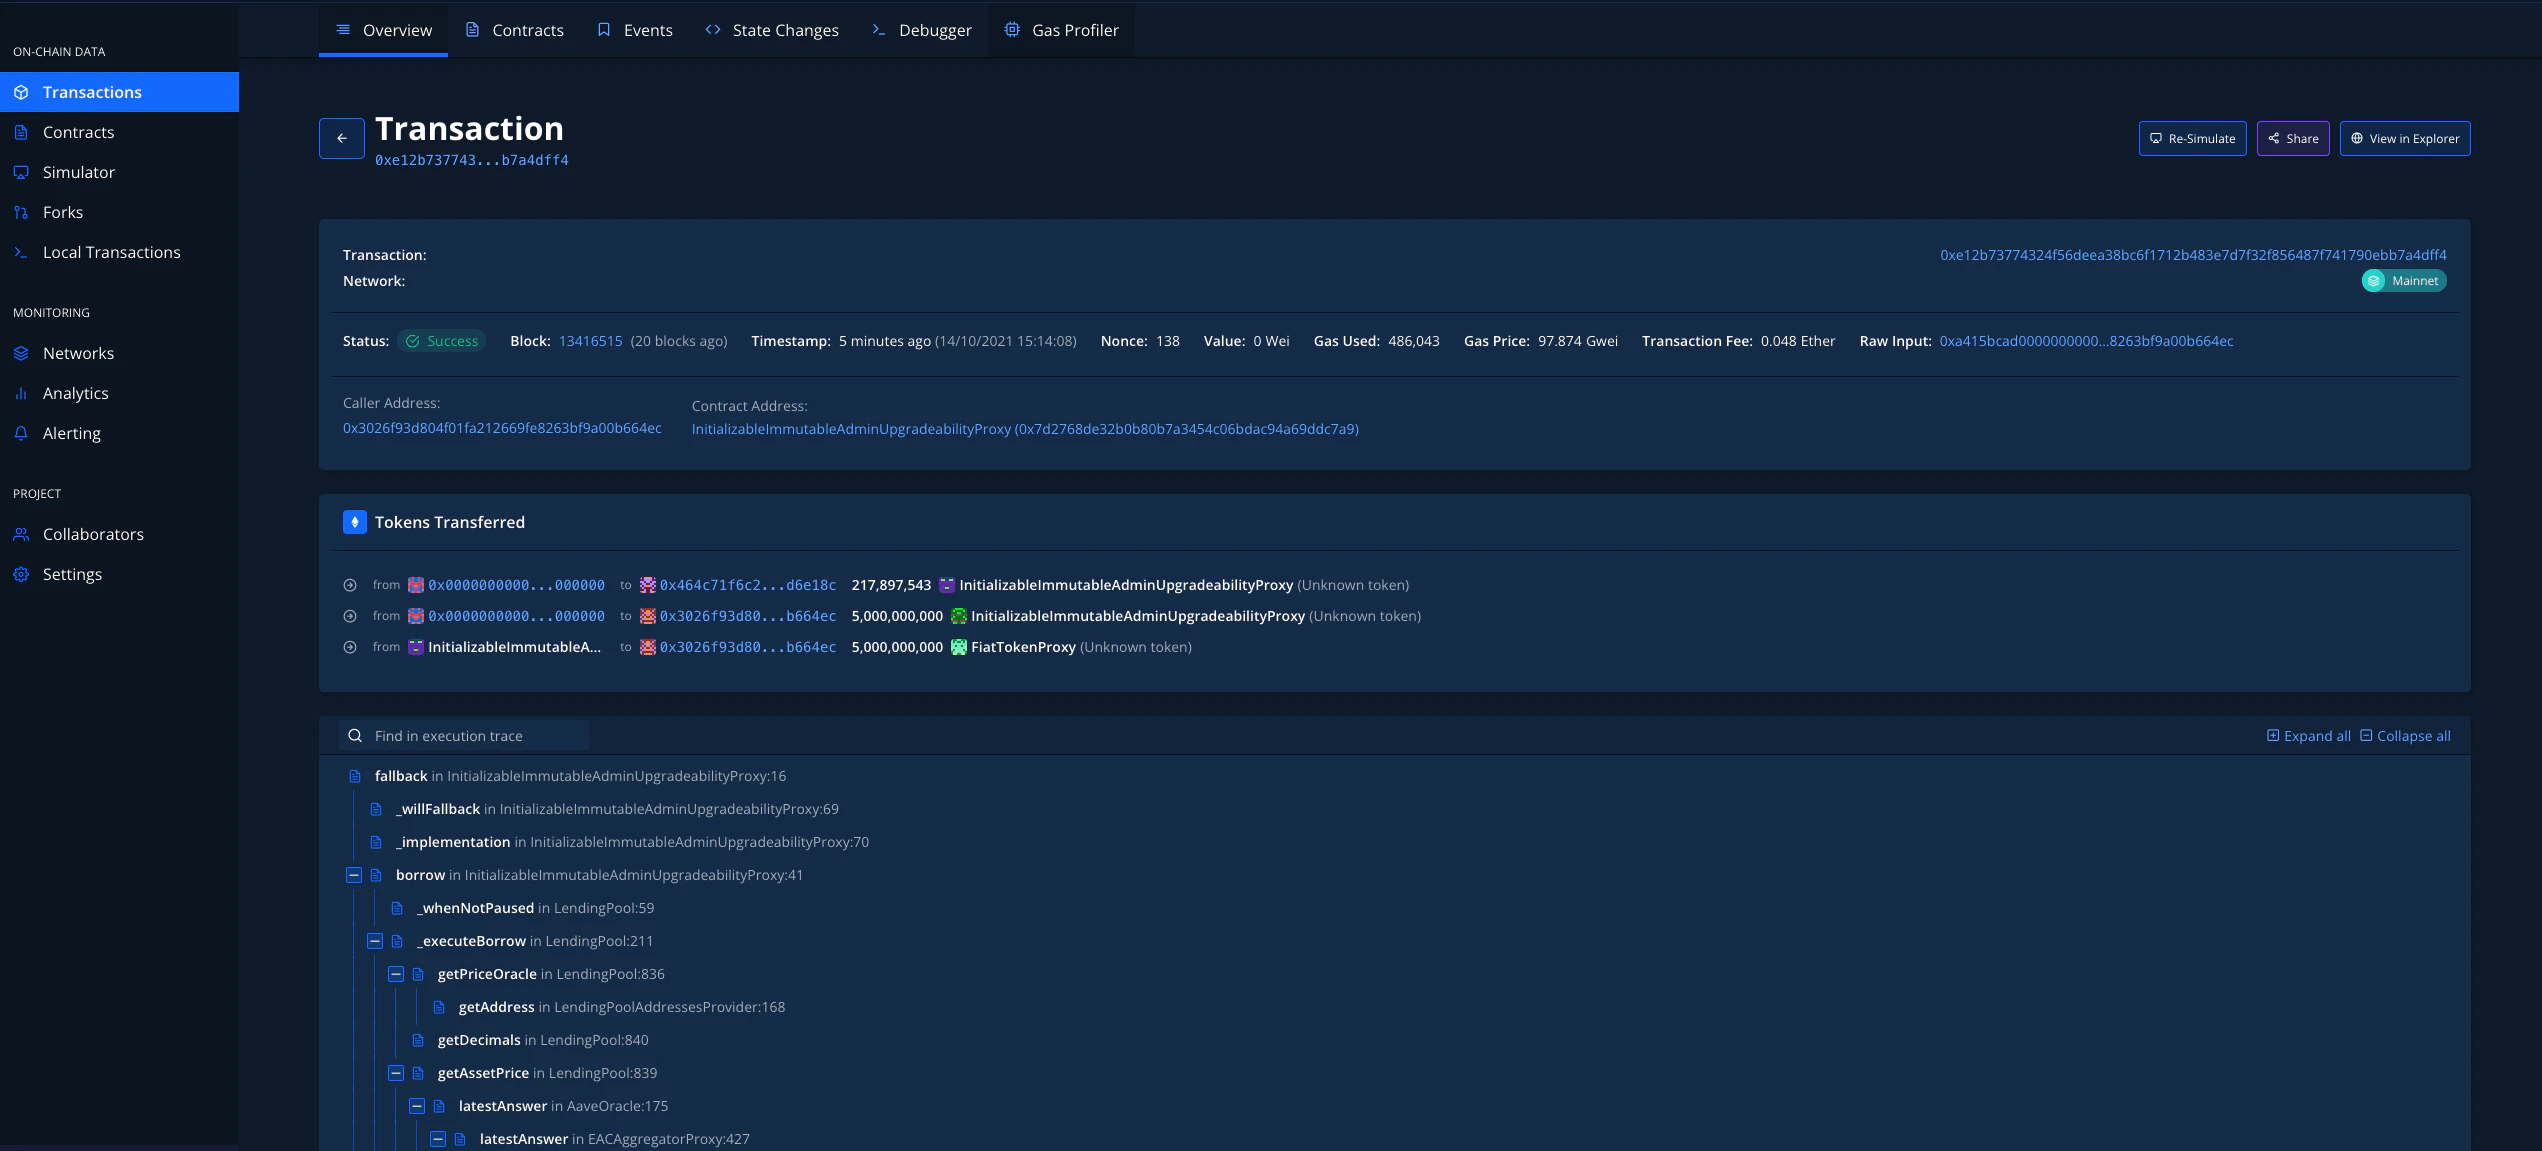
 Execution Overview - think of it as the bird's-eye view of the transaction. At a glance, you can see the exact code paths of all of the Smart Contracts that participated in a given transaction. You can open the transactions from the images above by clicking [**here (successful)**](https://dashboard.tenderly.co/tx/mainnet/0x1ca07994d823e4198d7517d828d99e2064f3204501284d5348ca8c11e3be53d8) and [**here (failed)**](https://dashboard.tenderly.co/tx/mainnet/0xe0ca90fba27e63cd8550565fa8d57559f76b67f5e7d8b8dbb150752a48cb87d2).
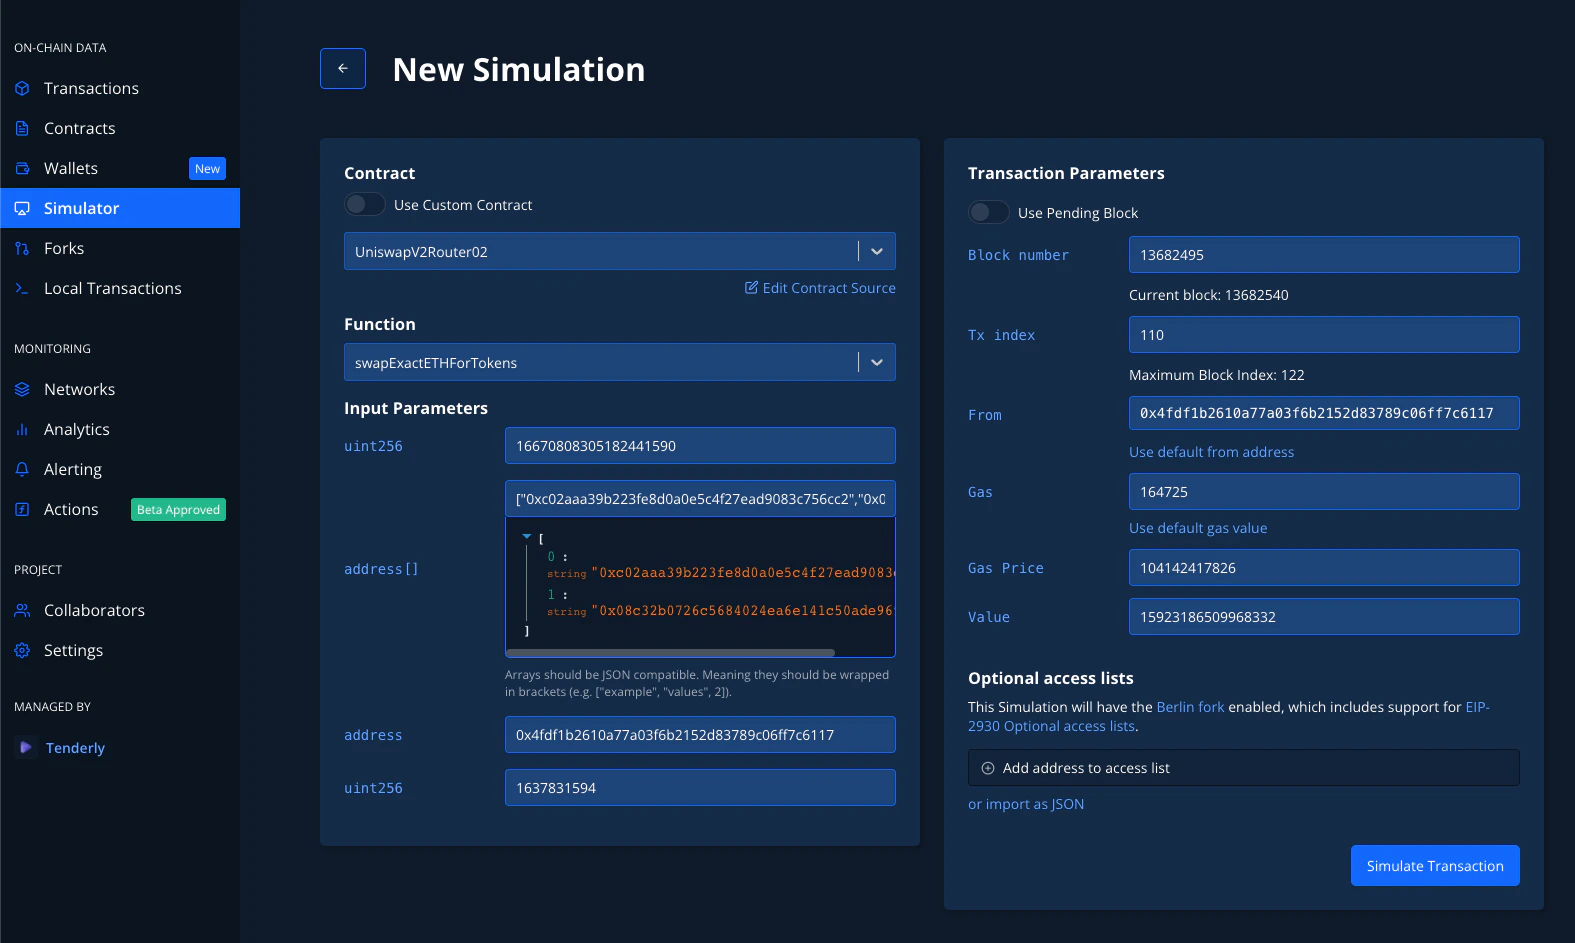
In the first tab - **Transaction Overview** - you can see and navigate through all of the elements of the transaction. Moreover, you can instantly (Re)Simulate the transaction by clicking the button in the top right, using different parameters, or even changing the source code to observe the outcome - [**read more about Simulations here**](/simulator-ui/overview).
Execution Overview - think of it as the bird's-eye view of the transaction. At a glance, you can see the exact code paths of all of the Smart Contracts that participated in a given transaction. You can open the transactions from the images above by clicking [**here (successful)**](https://dashboard.tenderly.co/tx/mainnet/0x1ca07994d823e4198d7517d828d99e2064f3204501284d5348ca8c11e3be53d8) and [**here (failed)**](https://dashboard.tenderly.co/tx/mainnet/0xe0ca90fba27e63cd8550565fa8d57559f76b67f5e7d8b8dbb150752a48cb87d2).
In the first tab - **Transaction Overview** - you can see and navigate through all of the elements of the transaction. Moreover, you can instantly (Re)Simulate the transaction by clicking the button in the top right, using different parameters, or even changing the source code to observe the outcome - [**read more about Simulations here**](/simulator-ui/overview).
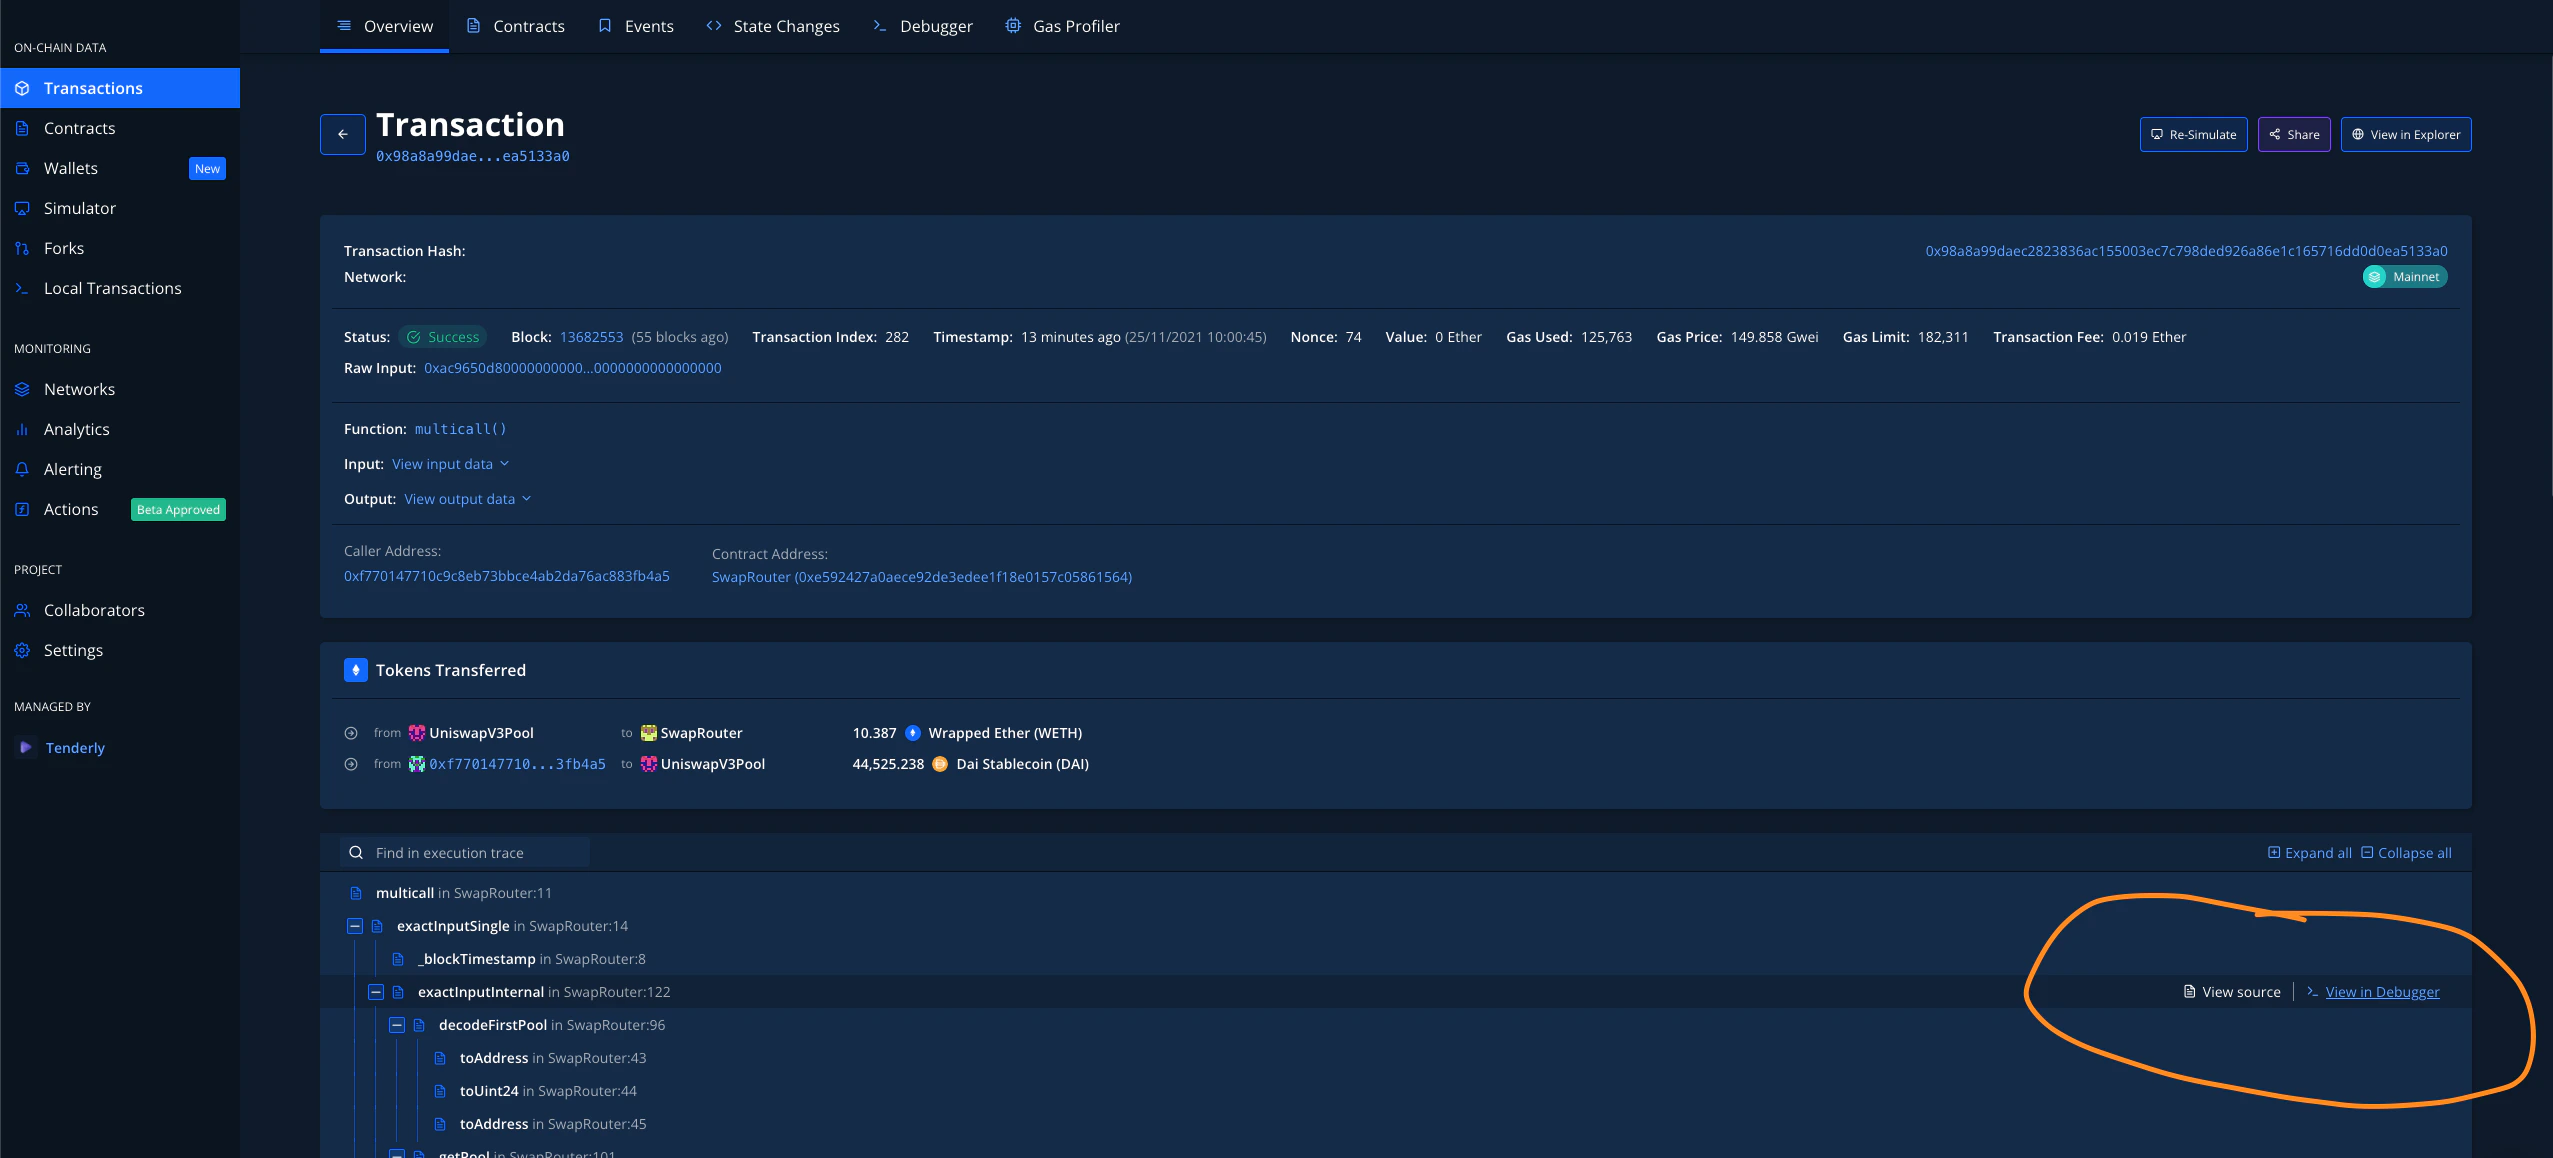
 From the Overview Tab tab, you can instantly jump into Contract Sources or Debugger to see what happened:
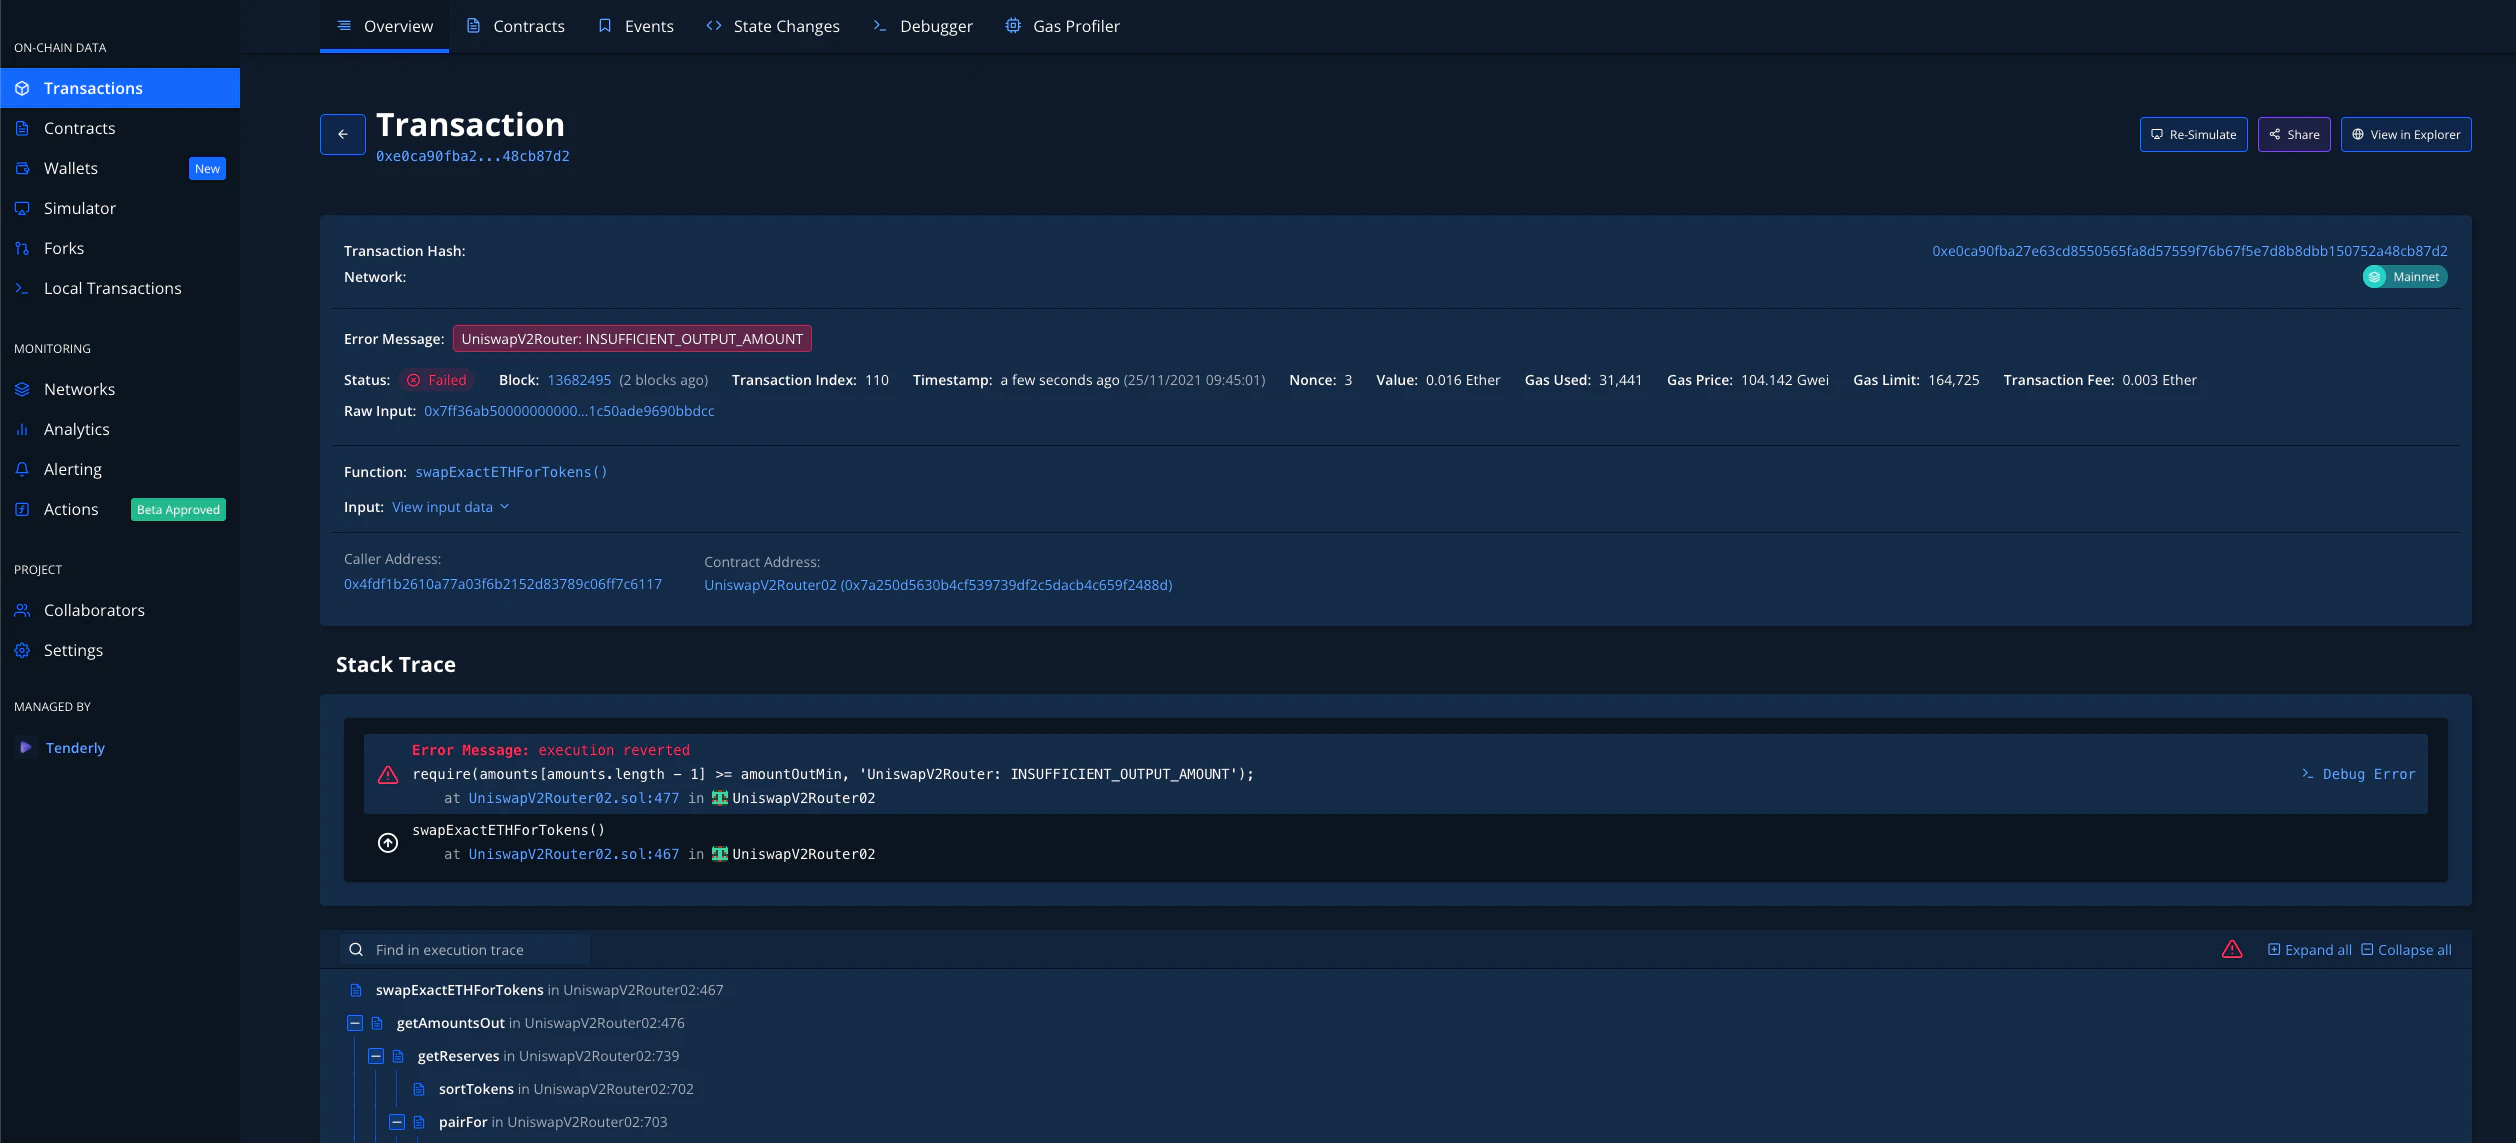
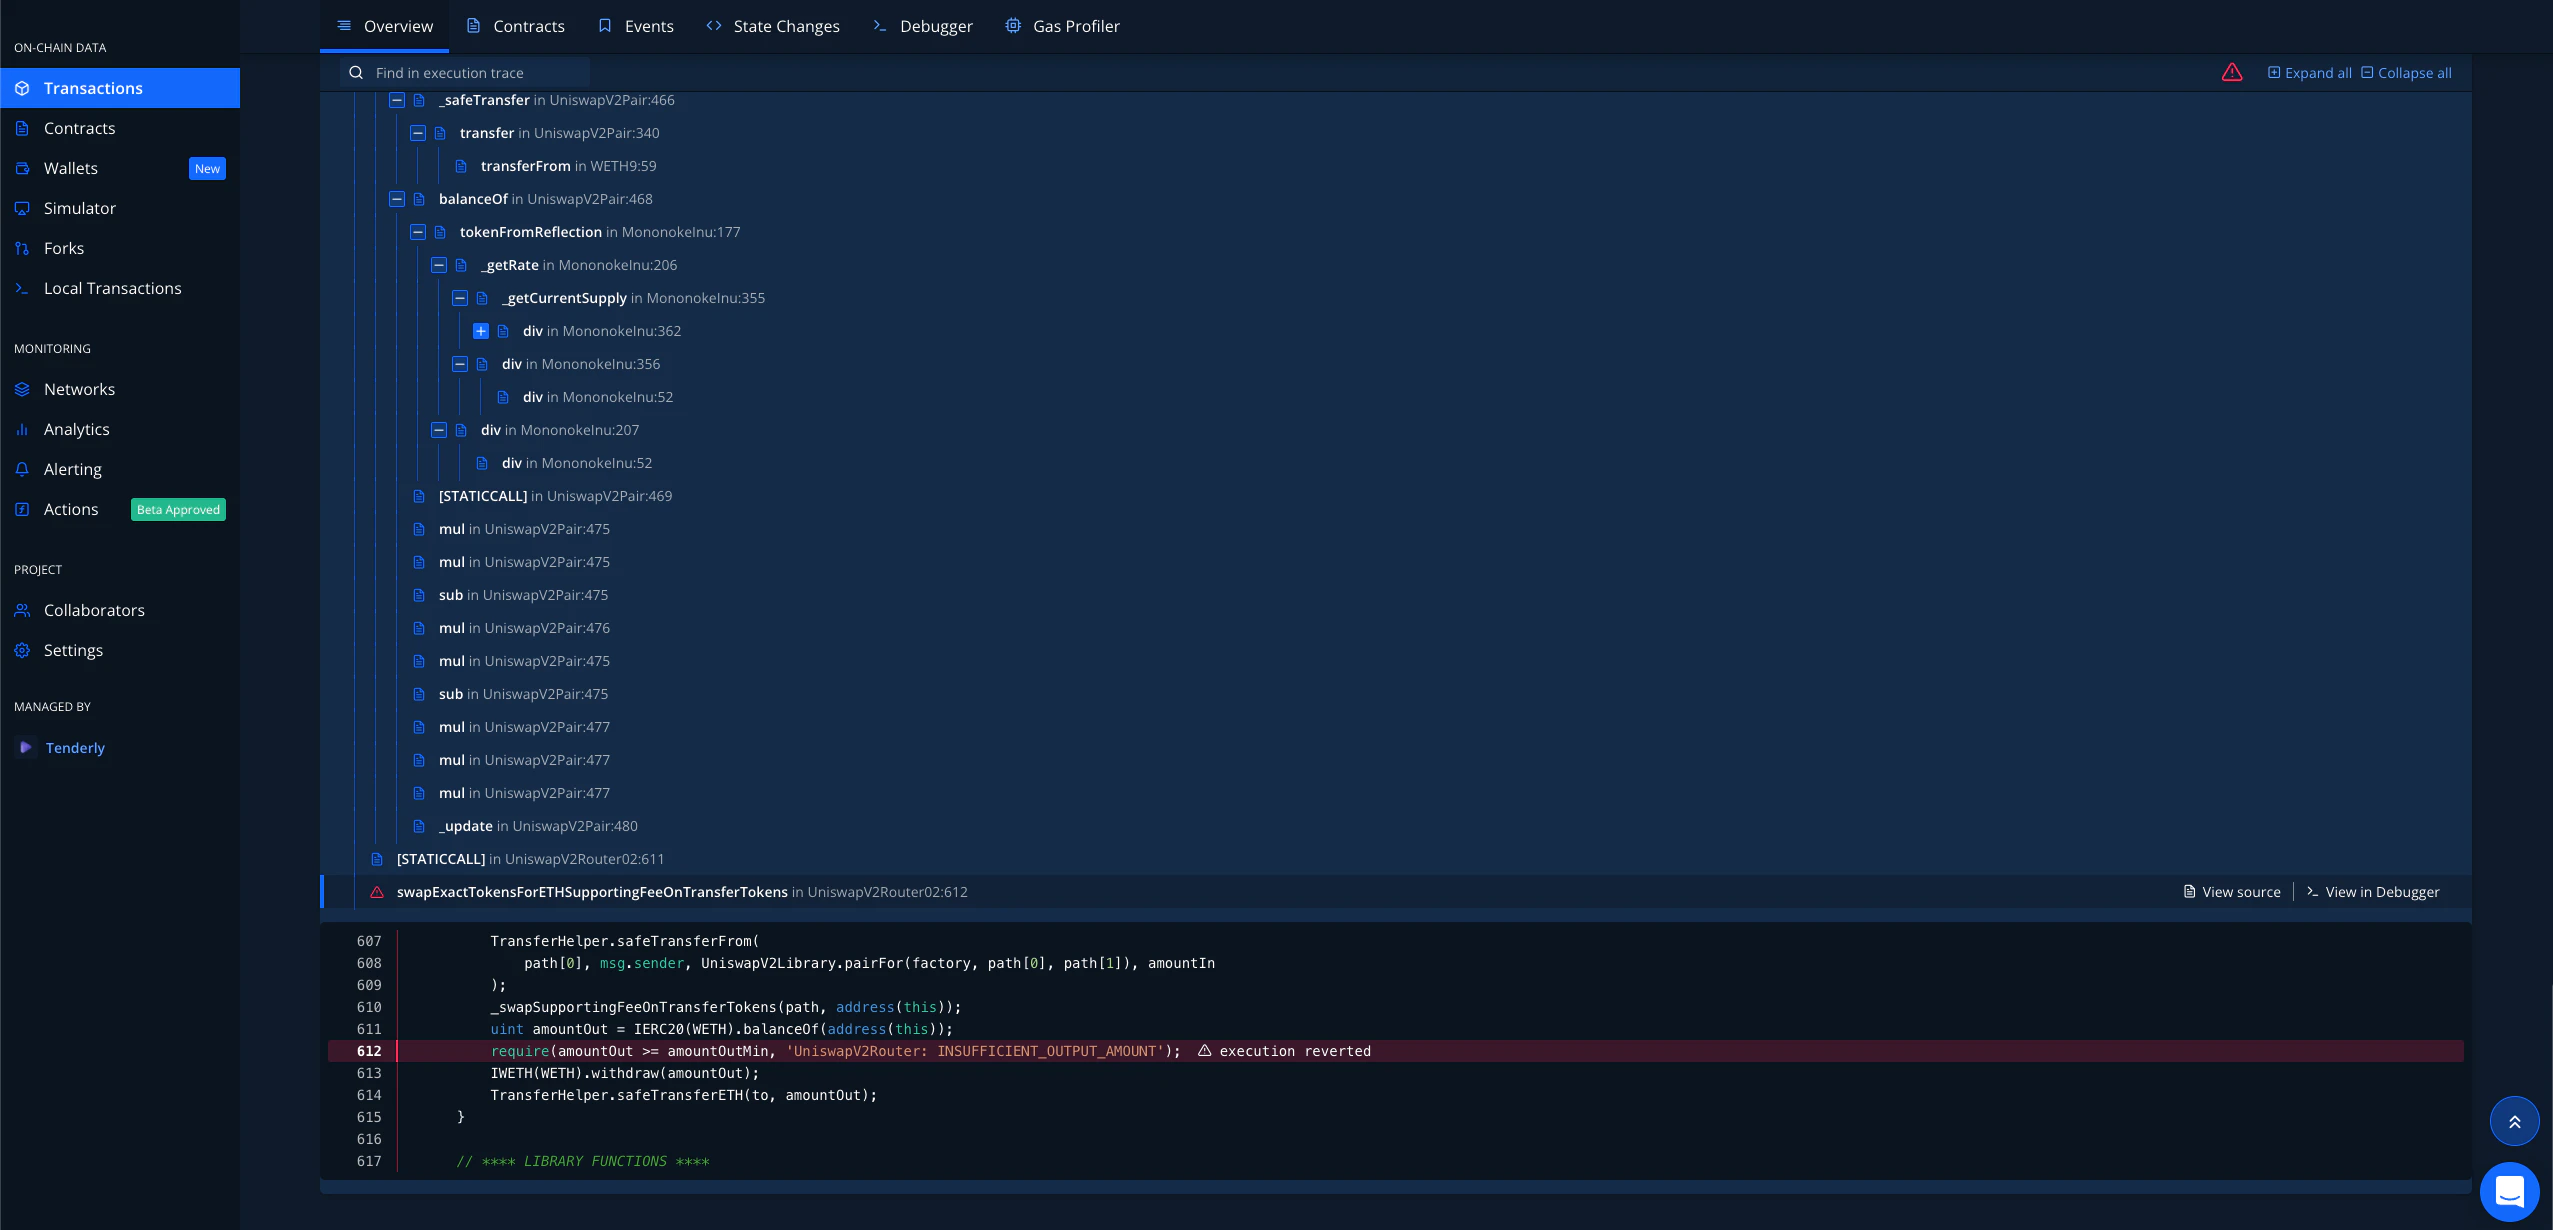
 If you're looking into a failed transaction, you can now **jump straight to all fail points by clicking the red warning icon and then clicking on the line that failed**:
.webp?fit=max&auto=format&n=XsEZlaGXYskrtN68&q=85&s=556893b48138dd1e6381df0c638afcbf)
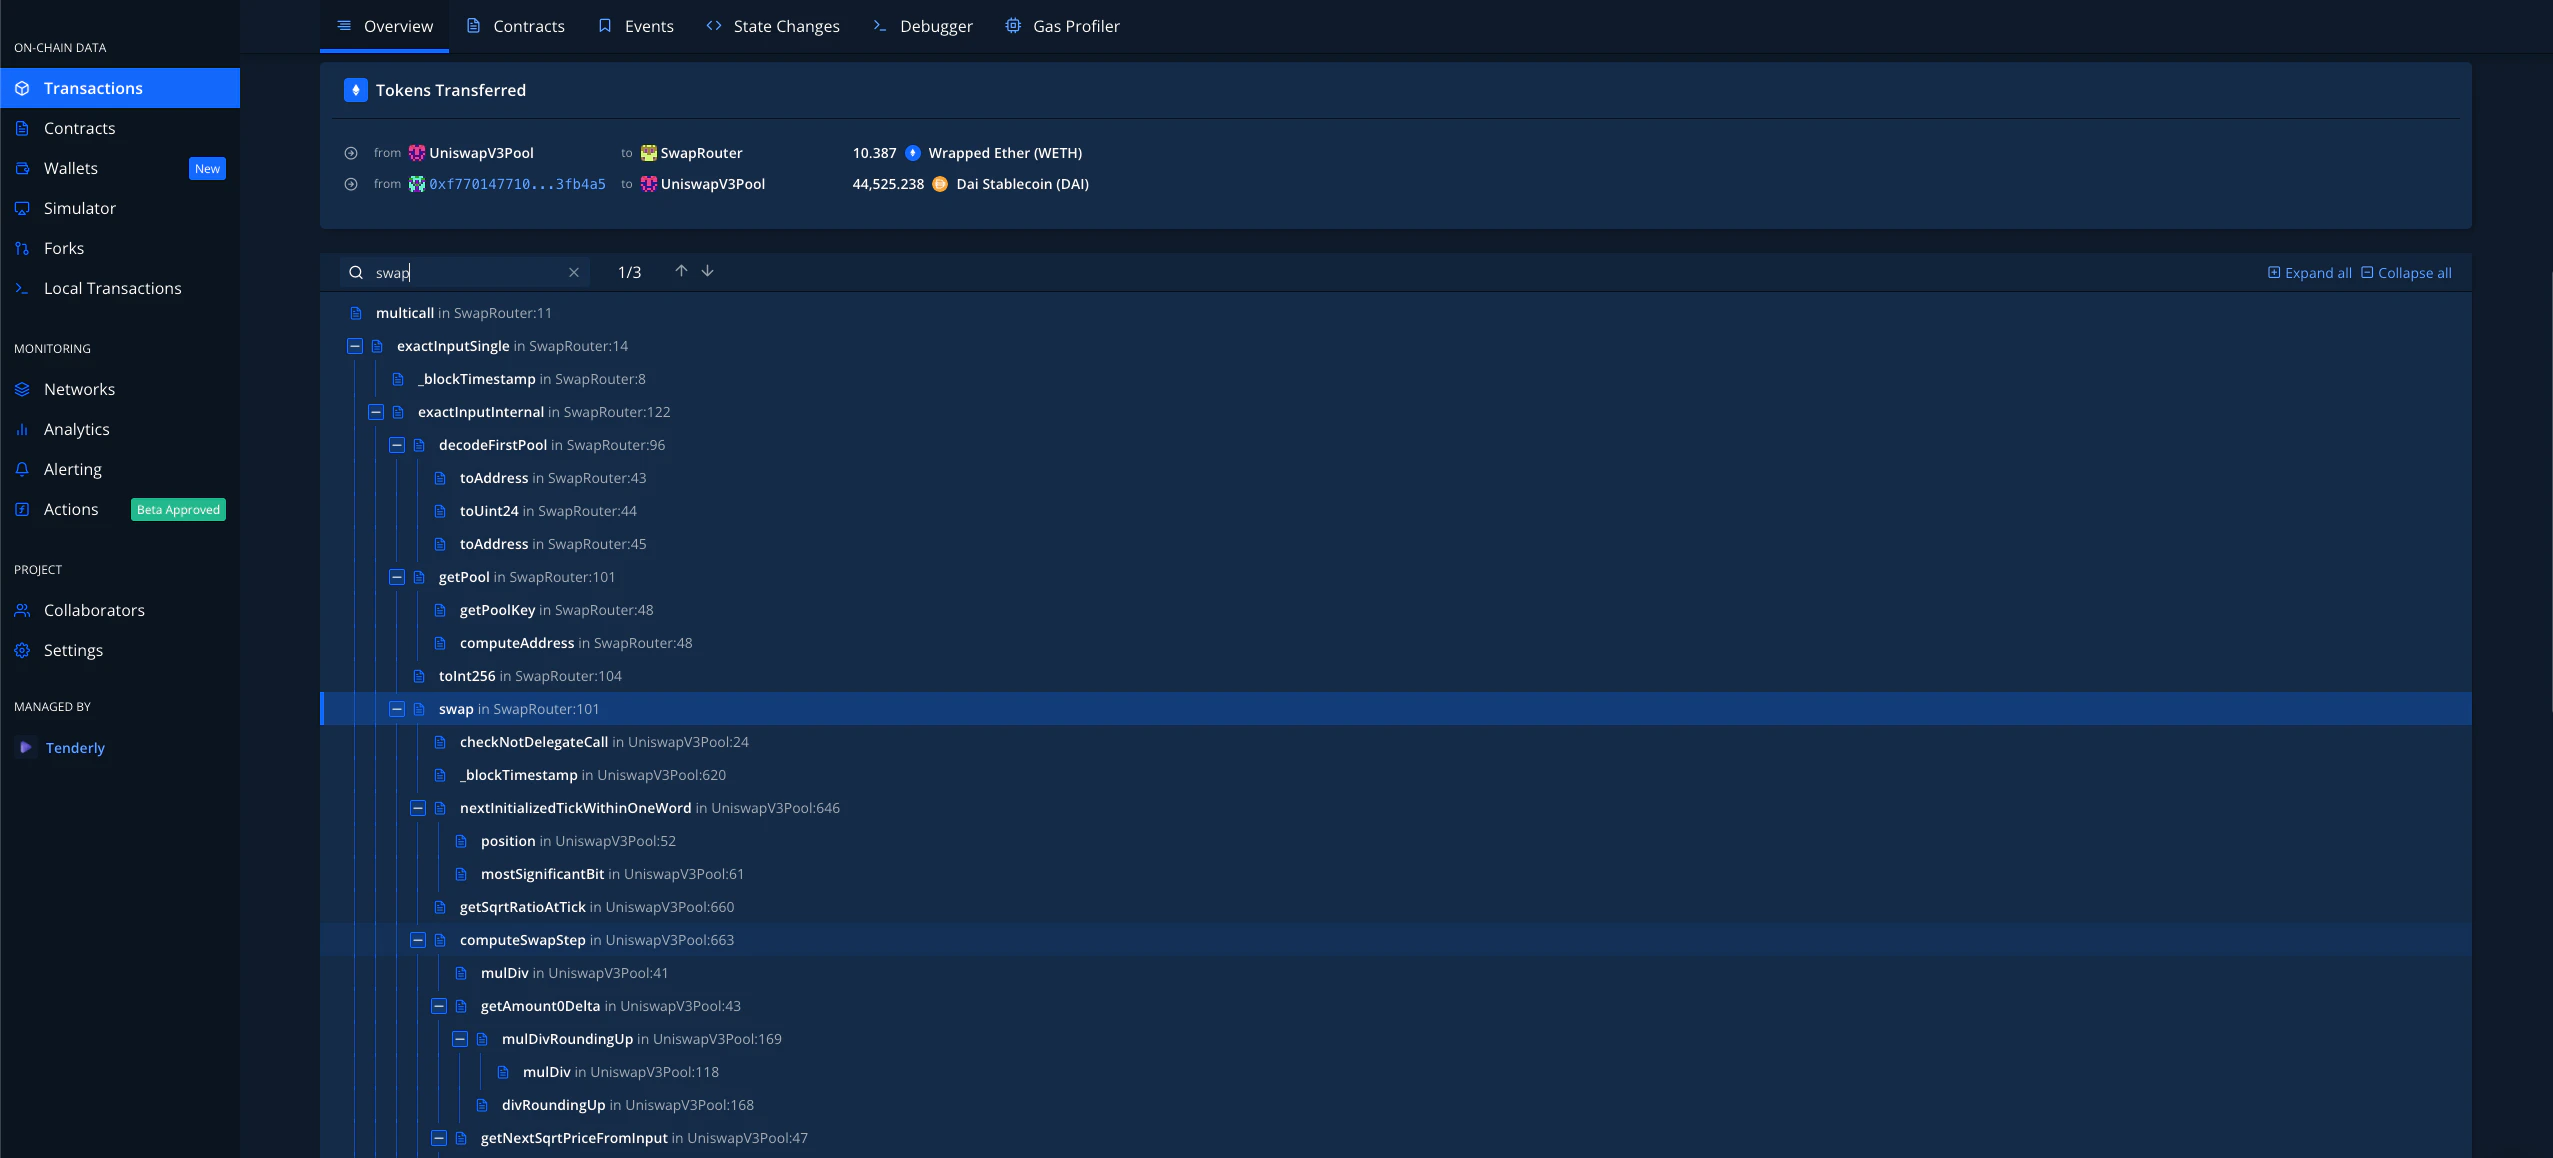
 You can also search the Execution Trace, as well as easily navigate it with your keyboard arrows:
.gif?s=a0d62baa5fb34537882b14b439bfef4d) ### Call and Function Trace
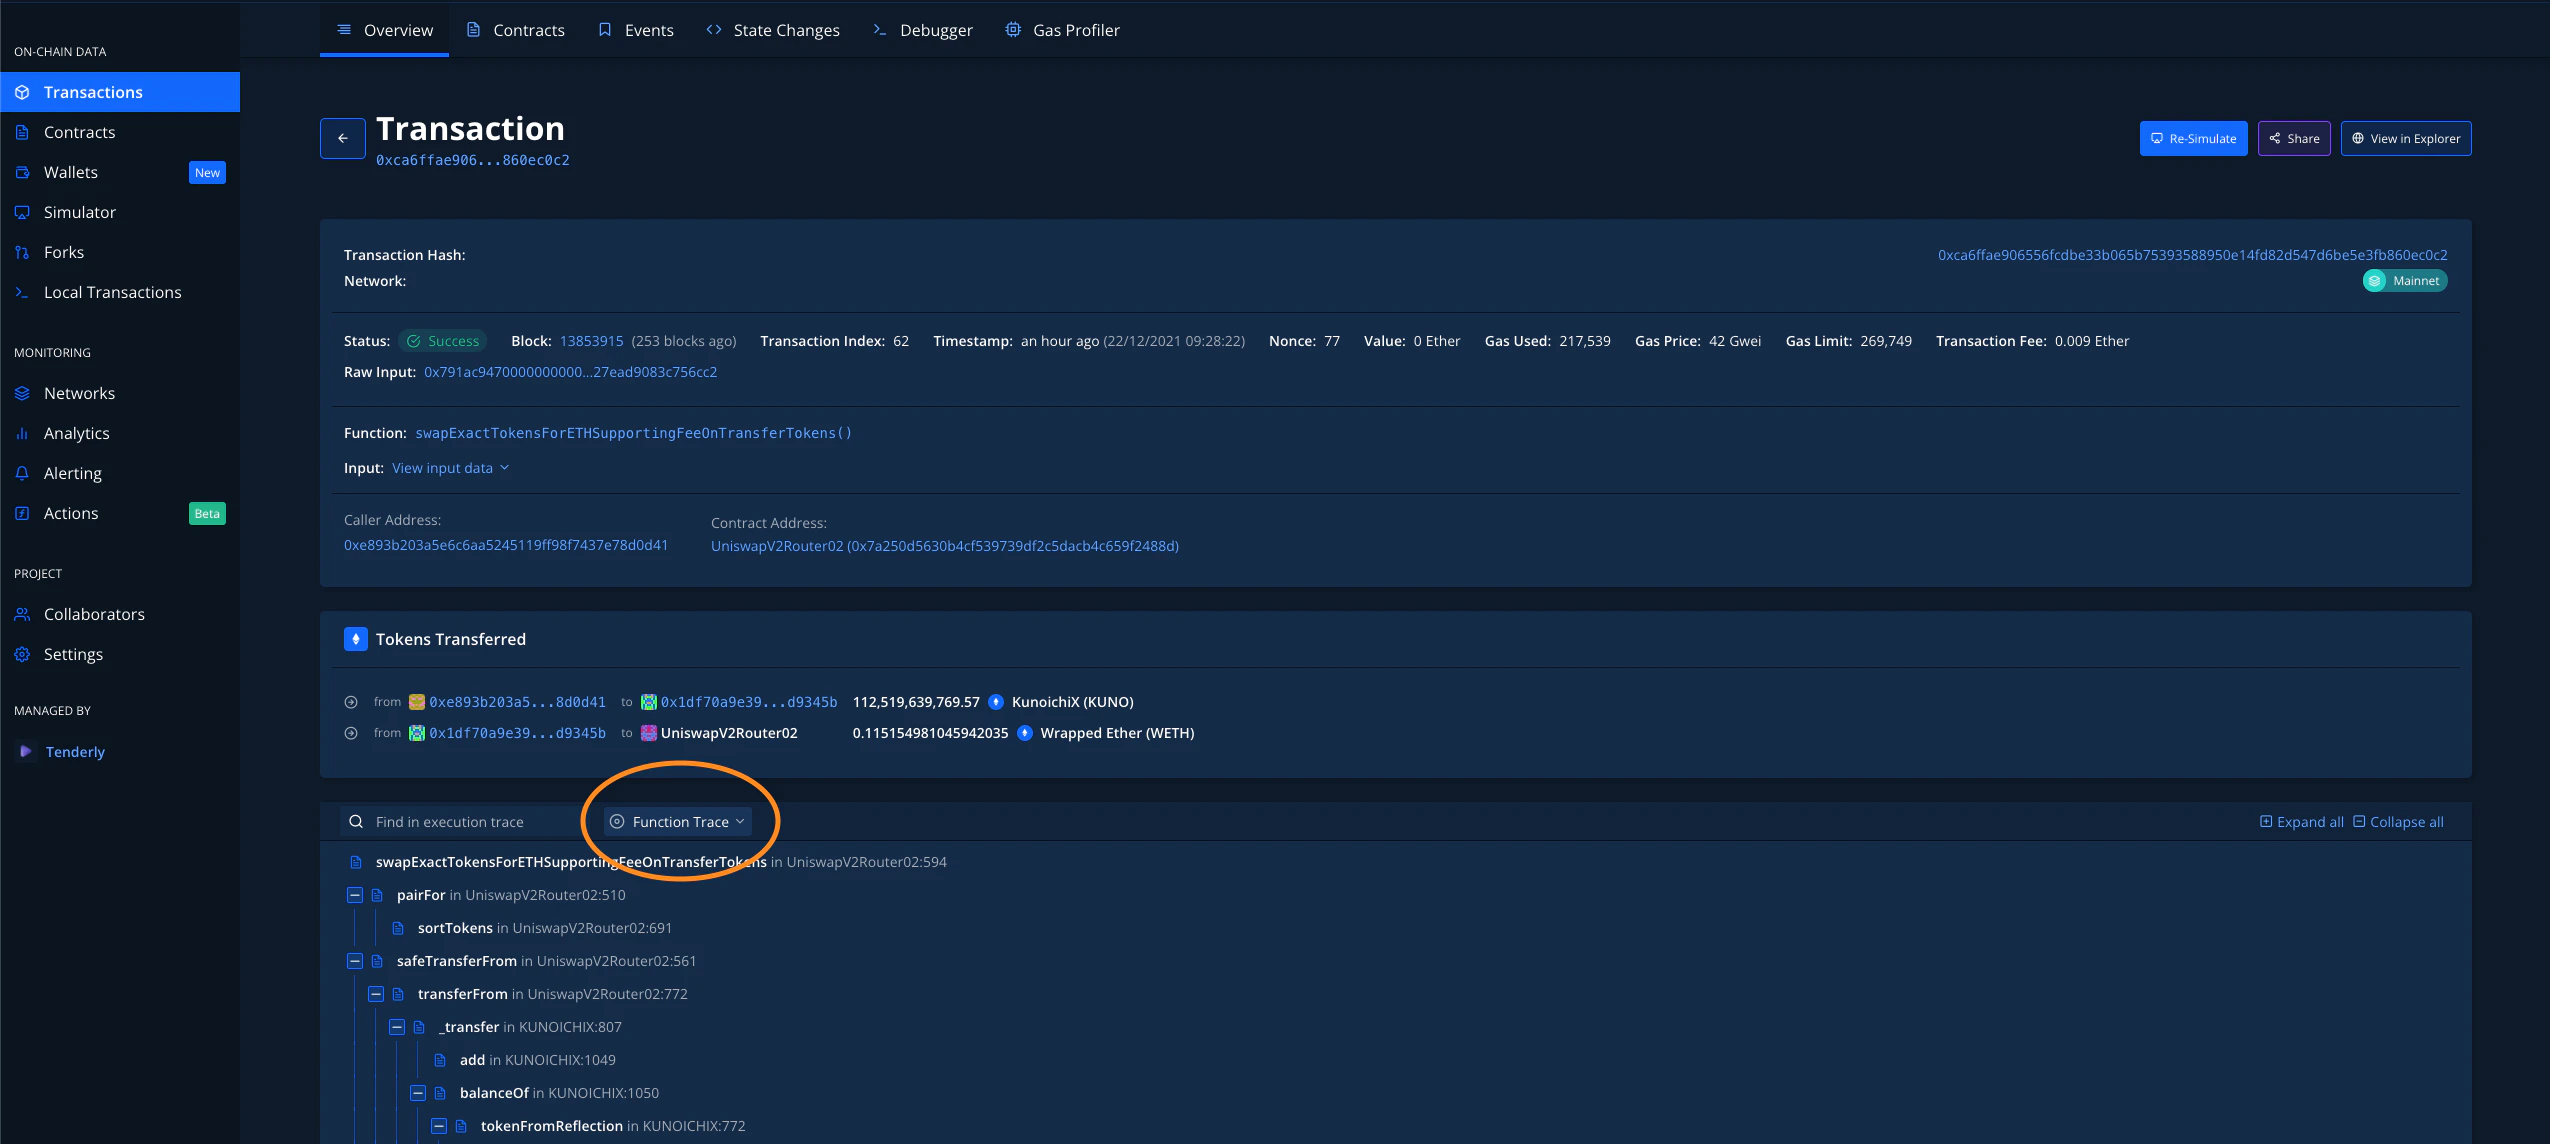
In the Execution Trace section, you'll find a dropdown menu right next to the search field. By default, it's set to **Function Trace**, which means it will show all external and internal calls that happened in this transaction.
### Call and Function Trace
In the Execution Trace section, you'll find a dropdown menu right next to the search field. By default, it's set to **Function Trace**, which means it will show all external and internal calls that happened in this transaction.
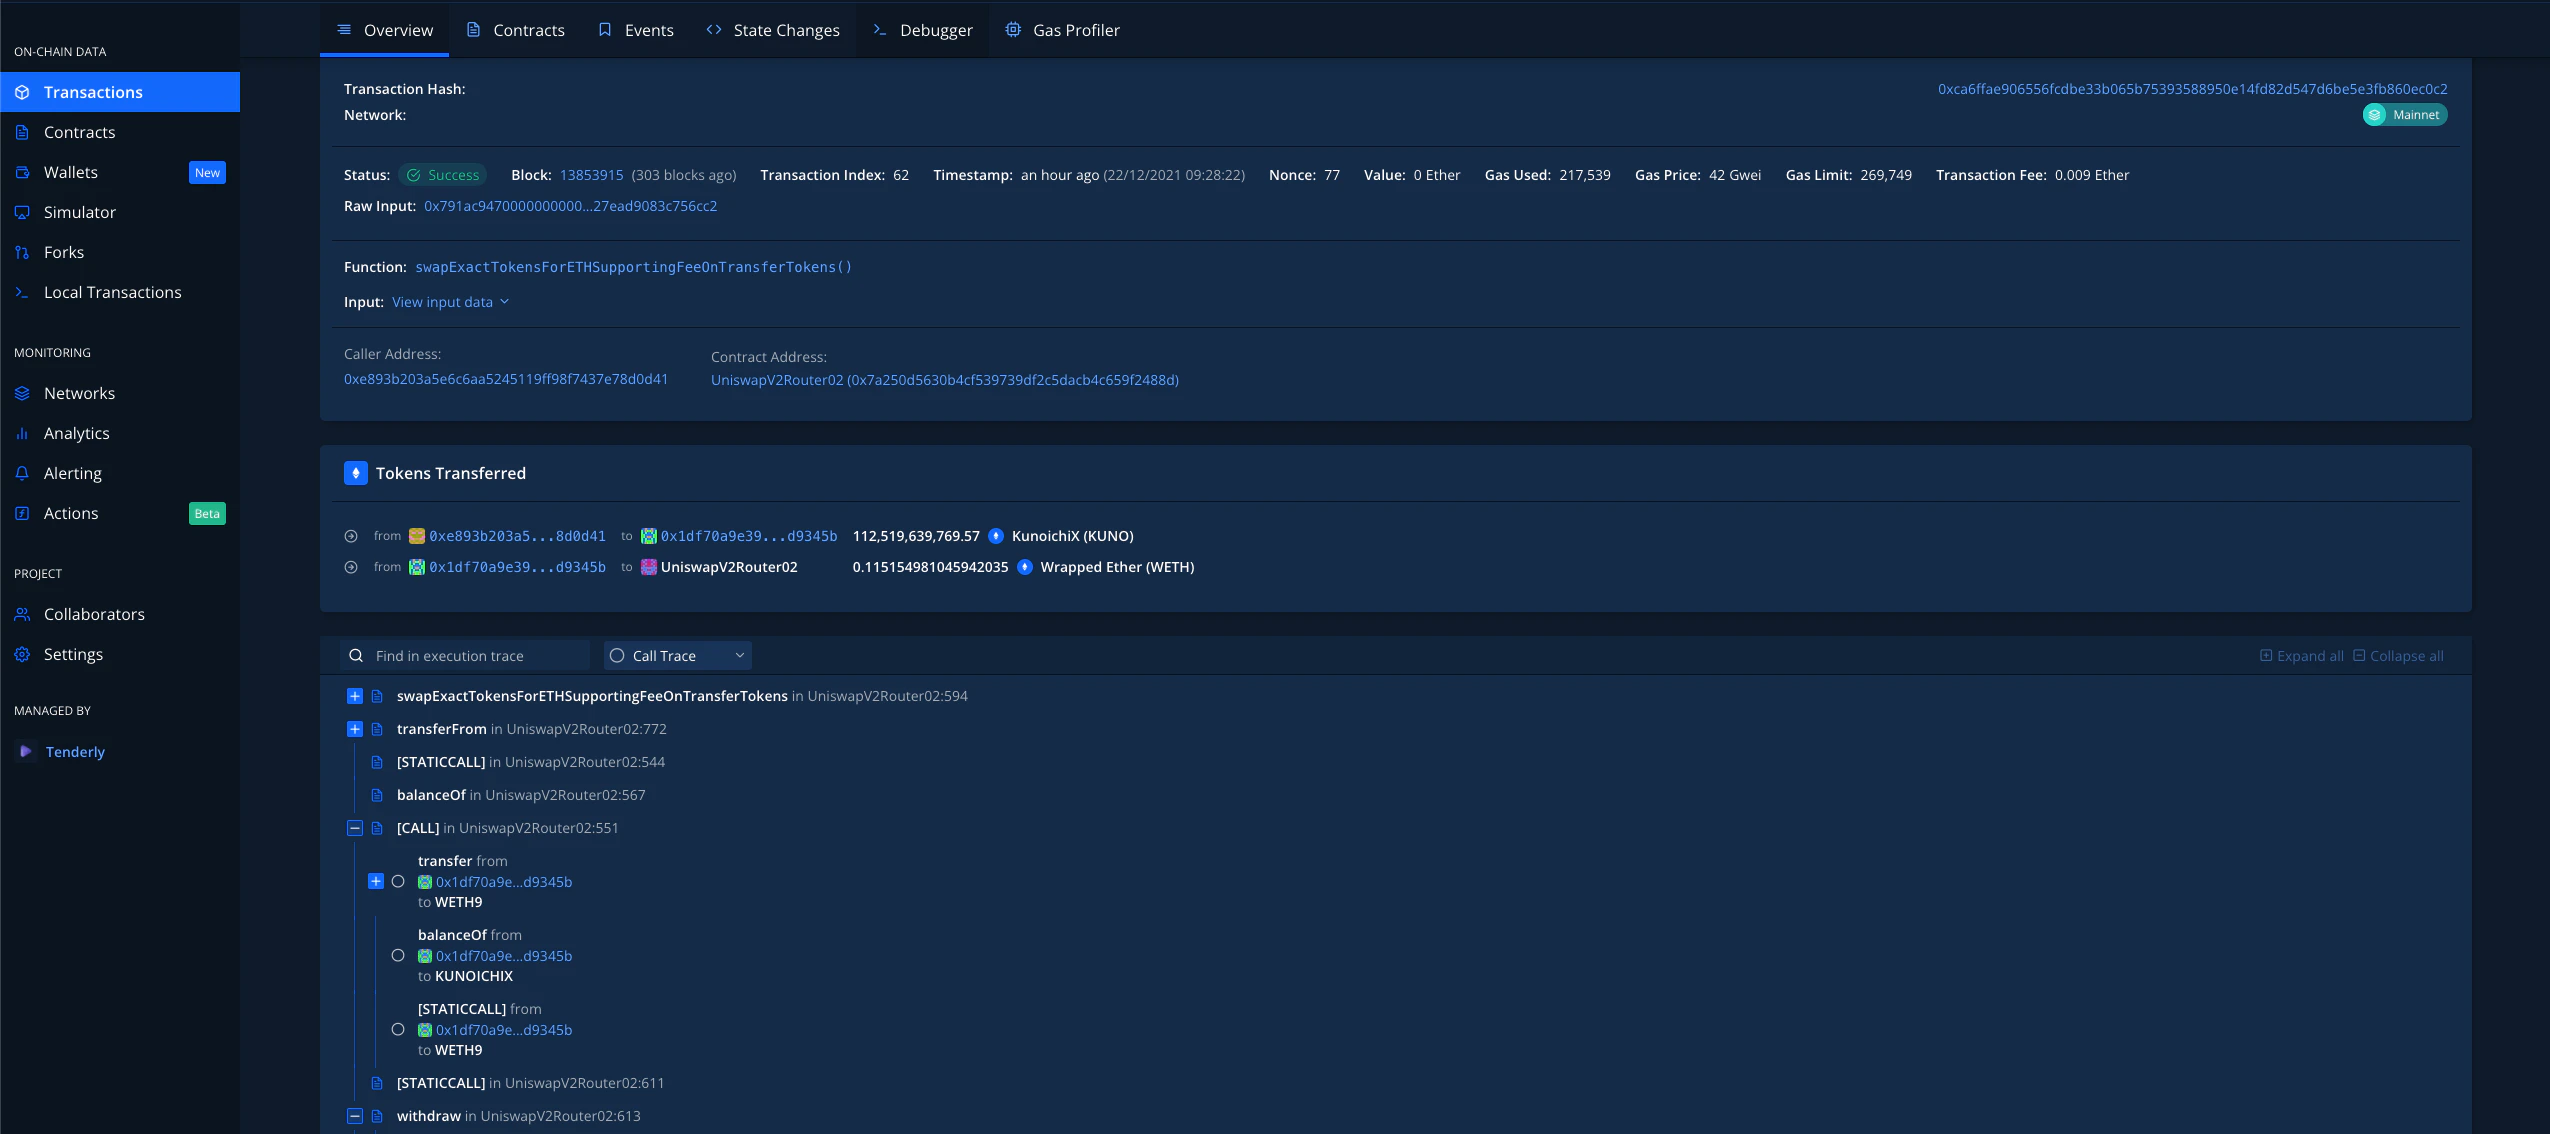
 For a better overview of key calls, switch it to **Call Trace**, which shows only external calls that happened in the transaction.
 You can **comment and prioritize any trace you want**, either for yourself or to make
collaboration in the project easier. You can [**read more about it
here**](/debugger/commenting).
This feature is available in [**Debugger**](/debugger/overview) as well. Now, let's say you want to really dig really deep into your (or any other) Transaction. Let's go through each of the tabs available.
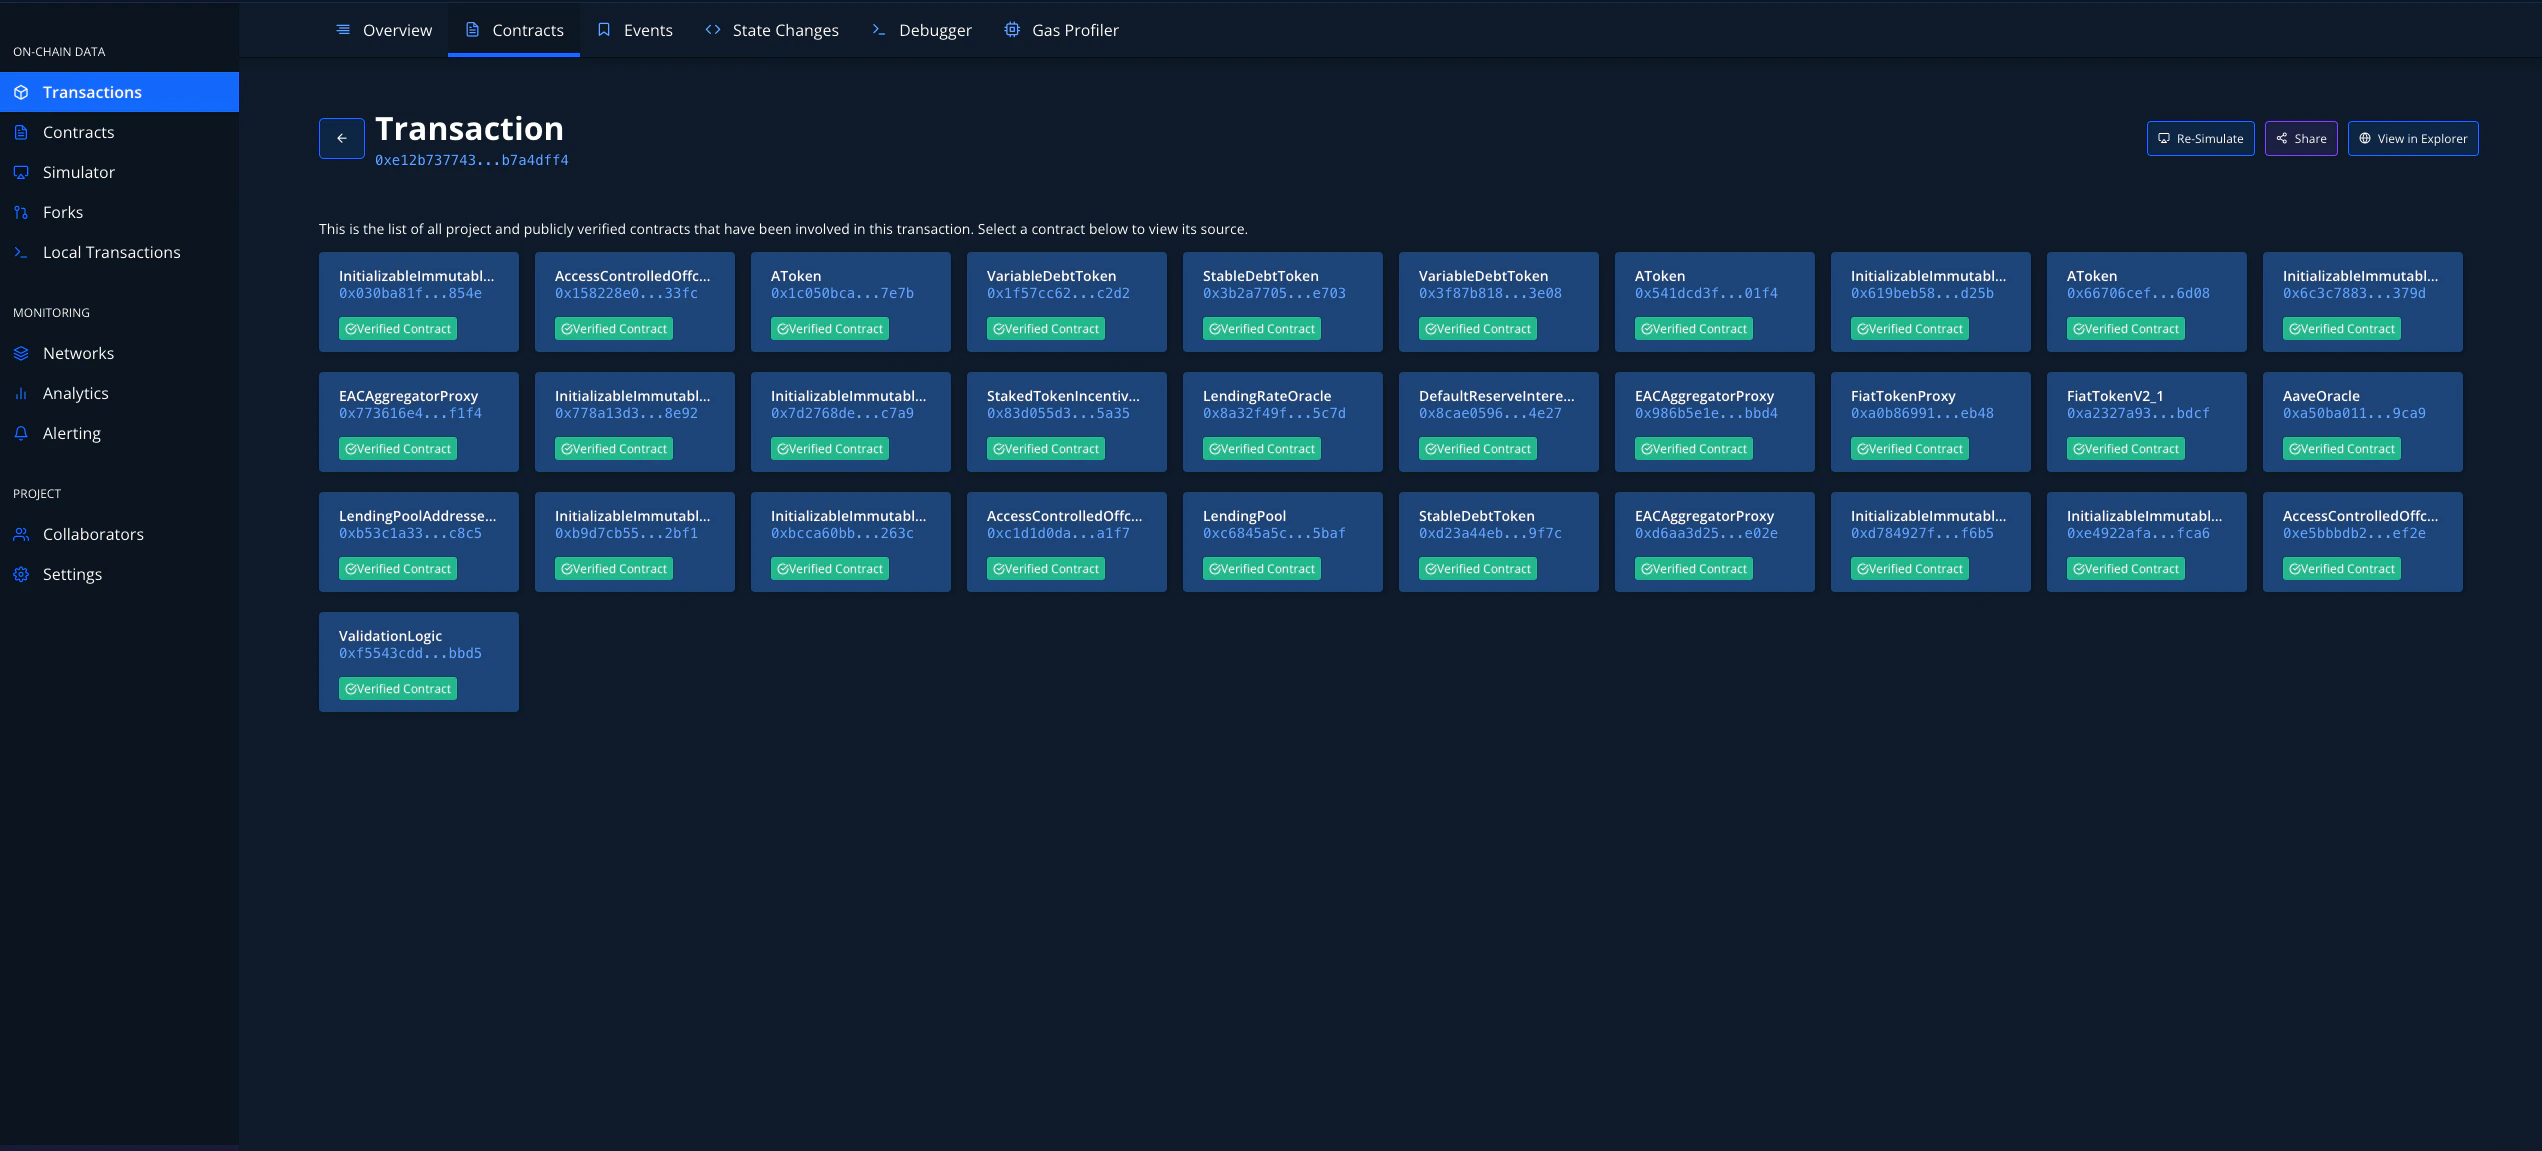
### Contracts
When you're in the **Transaction Overview** tab, in the upper navigation, you can click **Contracts** (or **Addresses**) to see all of the contracts that have been involved in a certain transaction:
You can **comment and prioritize any trace you want**, either for yourself or to make
collaboration in the project easier. You can [**read more about it
here**](/debugger/commenting).
This feature is available in [**Debugger**](/debugger/overview) as well. Now, let's say you want to really dig really deep into your (or any other) Transaction. Let's go through each of the tabs available.
### Contracts
When you're in the **Transaction Overview** tab, in the upper navigation, you can click **Contracts** (or **Addresses**) to see all of the contracts that have been involved in a certain transaction:
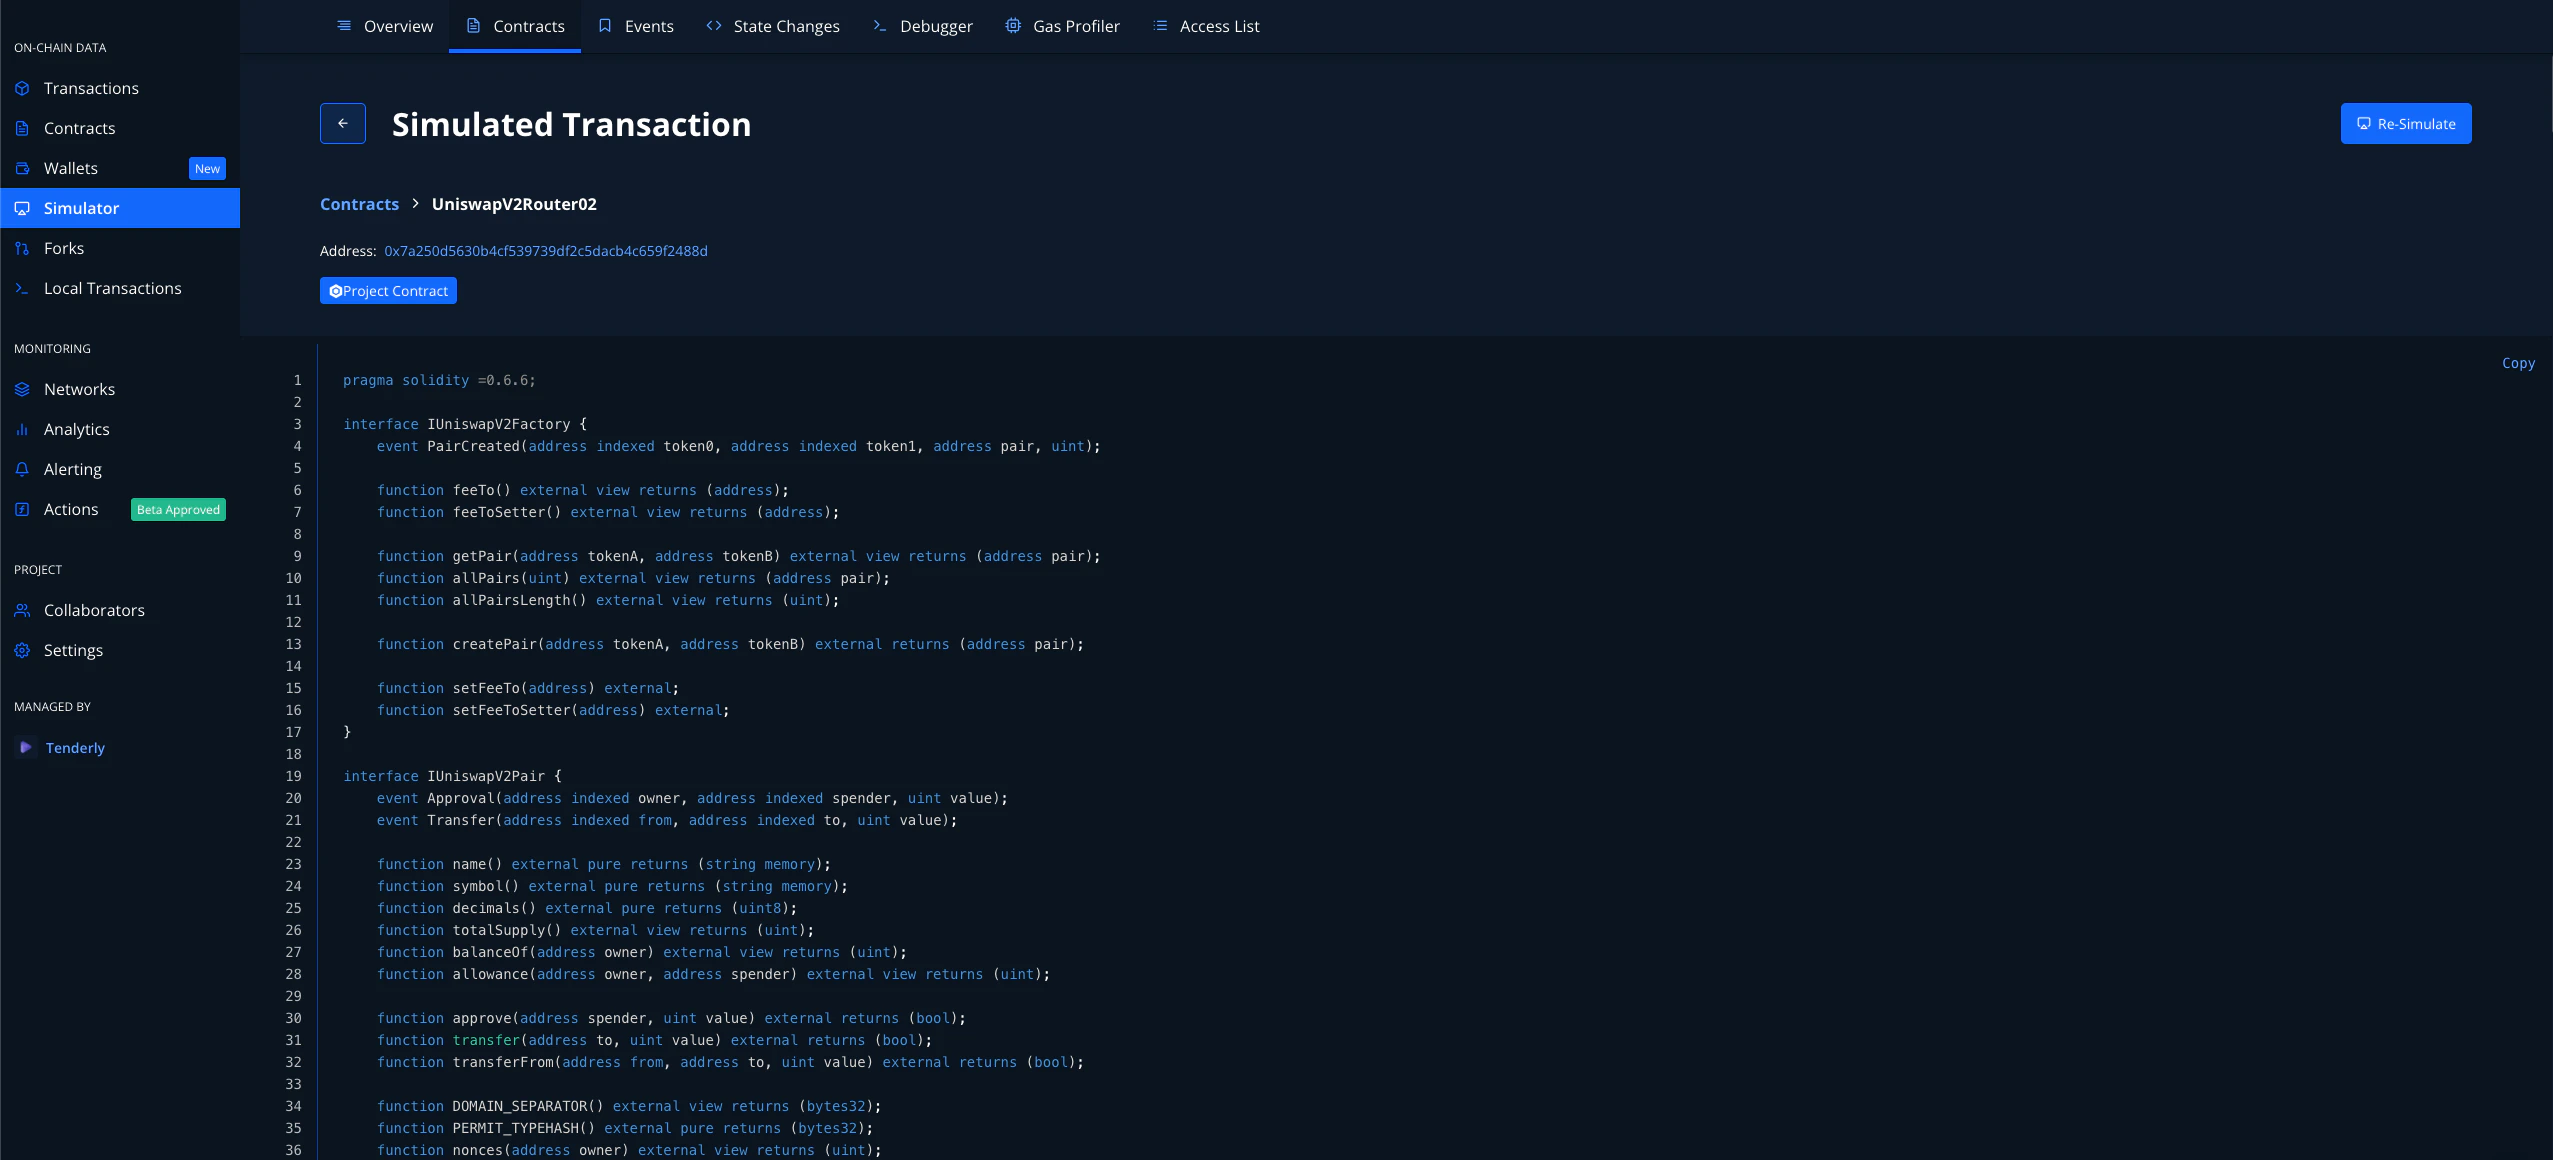
 By clicking on a contract, you can view its source code:
 ### Events
Smart Contract Events are the de-facto way of notifying interested parties that some event has occurred. The Logs themselves also contain valuable information in addition to the information that a particular event has occurred.
### Events
Smart Contract Events are the de-facto way of notifying interested parties that some event has occurred. The Logs themselves also contain valuable information in addition to the information that a particular event has occurred.
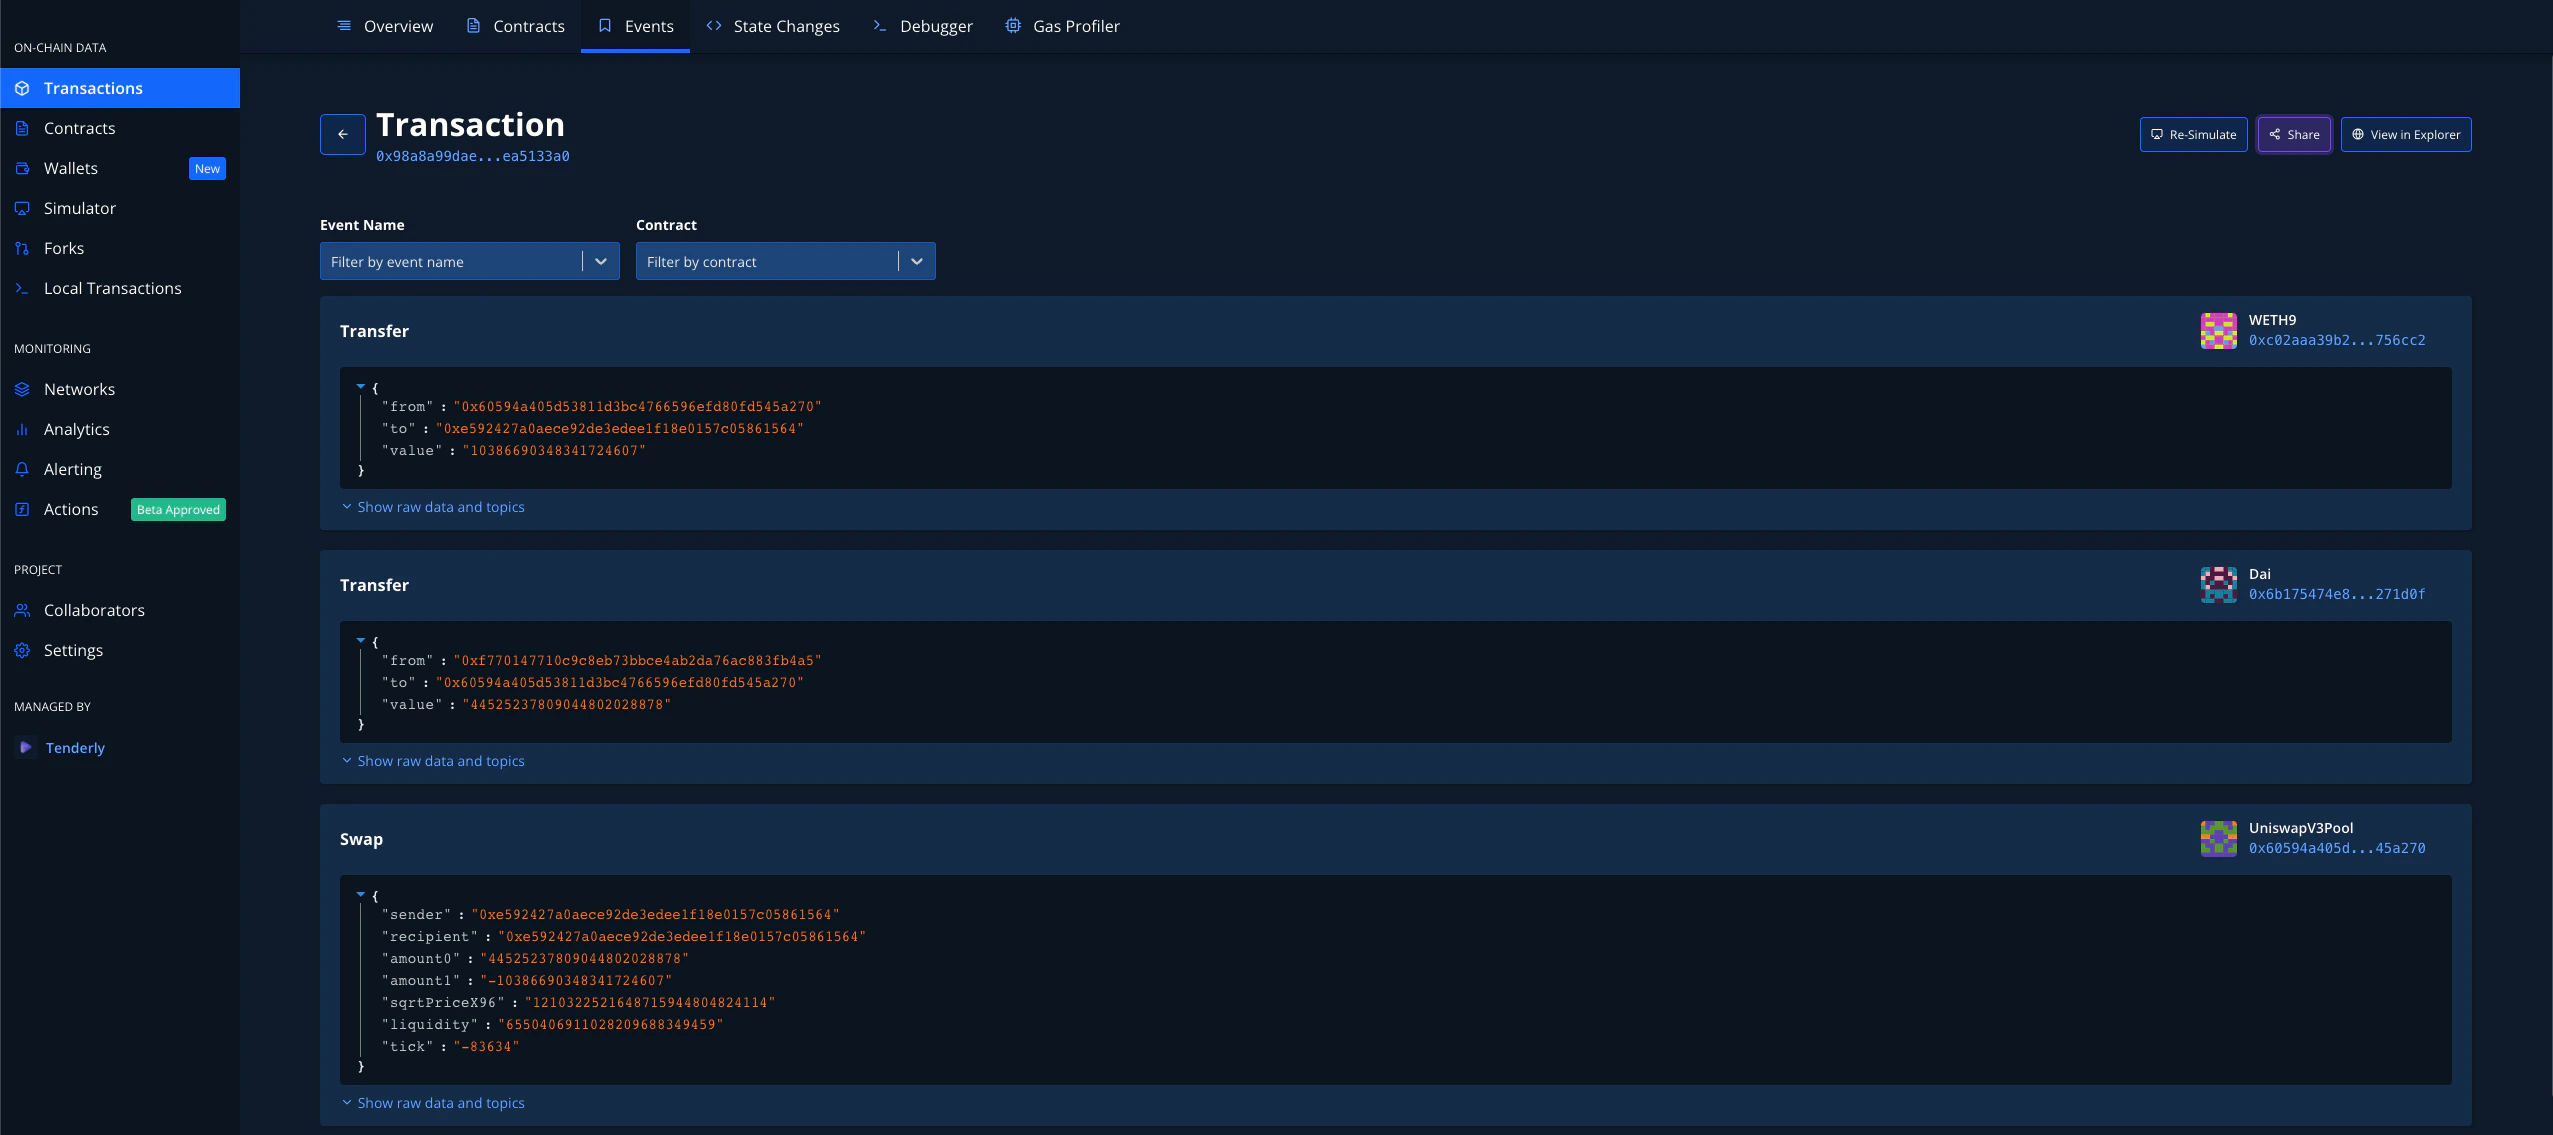 When we click the **Events** tab, we can see all of the Events that were [emitted during a transaction](https://dashboard.tenderly.co/tx/mainnet/0x98a8a99daec2823836ac155003ec7c798ded926a86e1c165716dd0d0ea5133a0). What is even better is that **the event parameters are already decoded and shown in a human-readable format**. No more time wasted decoding hex strings to see what happened. You can also filter the Events by Name and Smart Contract.
### State Changes
As Smart Contracts are getting more and more complex, the states of those smart contracts are getting more complex as well.
When we click the **Events** tab, we can see all of the Events that were [emitted during a transaction](https://dashboard.tenderly.co/tx/mainnet/0x98a8a99daec2823836ac155003ec7c798ded926a86e1c165716dd0d0ea5133a0). What is even better is that **the event parameters are already decoded and shown in a human-readable format**. No more time wasted decoding hex strings to see what happened. You can also filter the Events by Name and Smart Contract.
### State Changes
As Smart Contracts are getting more and more complex, the states of those smart contracts are getting more complex as well.
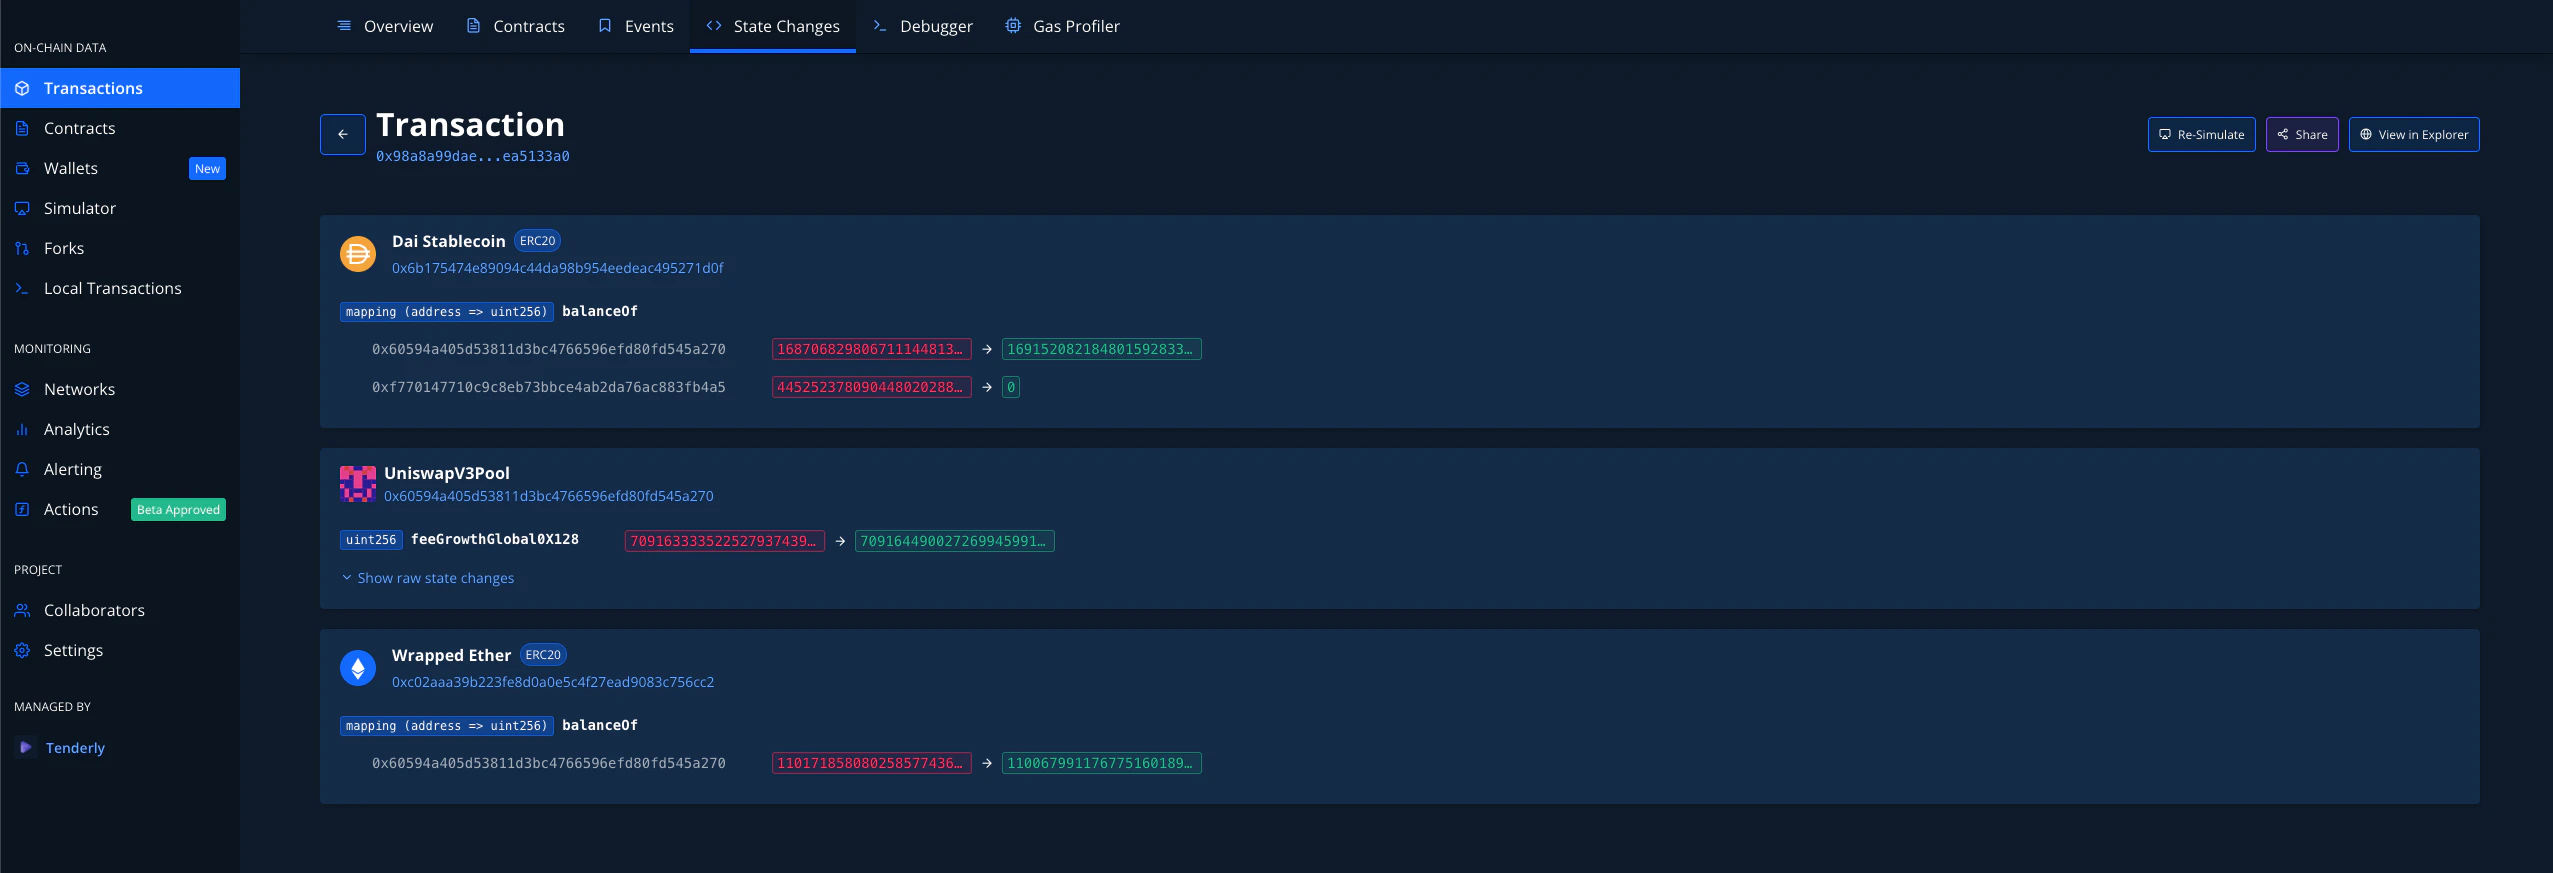 Here we see that not only does Tenderly show the state variables that were changed, but also **all of them are decoded for your convenience**. **And yes, structures are decoded correctly as well**.
You can see that transaction and its intricacies [here](https://dashboard.tenderly.co/tx/mainnet/0x98a8a99daec2823836ac155003ec7c798ded926a86e1c165716dd0d0ea5133a0).
### Debugger
Debugging stack traces is an important part of any developer's workflow both locally and in production. By clicking on the **Debugger** tab, you'll be able to deep-dive into everything that happened with your (or any other) transaction.
Here we see that not only does Tenderly show the state variables that were changed, but also **all of them are decoded for your convenience**. **And yes, structures are decoded correctly as well**.
You can see that transaction and its intricacies [here](https://dashboard.tenderly.co/tx/mainnet/0x98a8a99daec2823836ac155003ec7c798ded926a86e1c165716dd0d0ea5133a0).
### Debugger
Debugging stack traces is an important part of any developer's workflow both locally and in production. By clicking on the **Debugger** tab, you'll be able to deep-dive into everything that happened with your (or any other) transaction.
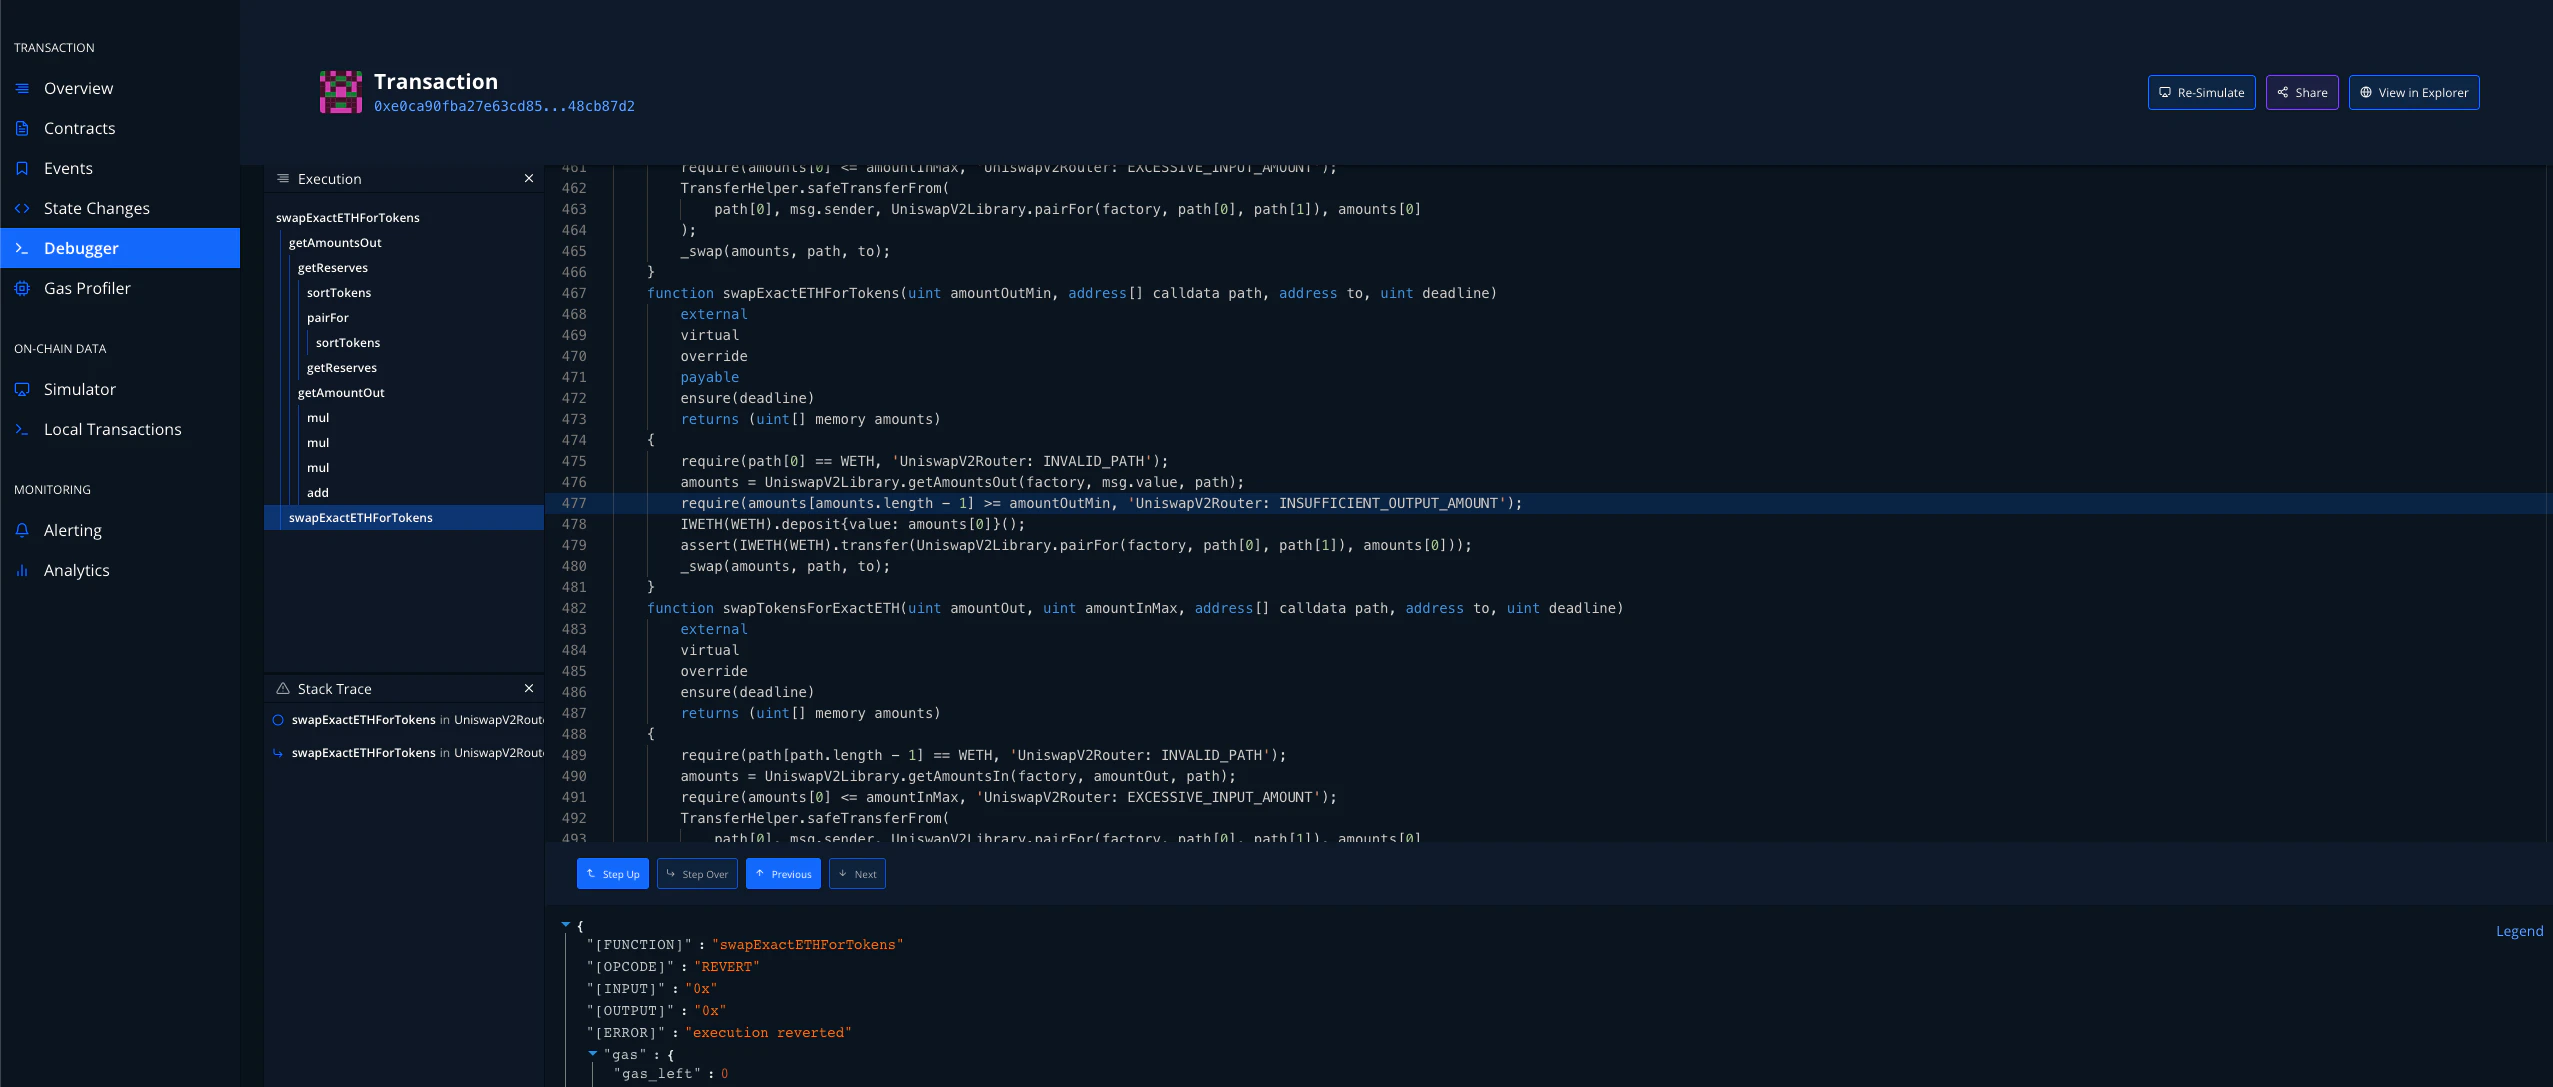 **The stack trace above shows the exact line of code where the transaction failed**. From there, you can click **Debug Error** and find the issue in no time. Check out[ **how to use Tenderly Debugger**](/debugger/overview) and [**investigate failed transactions**](/debugger/overview)!
### Gas Profiler
**The stack trace above shows the exact line of code where the transaction failed**. From there, you can click **Debug Error** and find the issue in no time. Check out[ **how to use Tenderly Debugger**](/debugger/overview) and [**investigate failed transactions**](/debugger/overview)!
### Gas Profiler
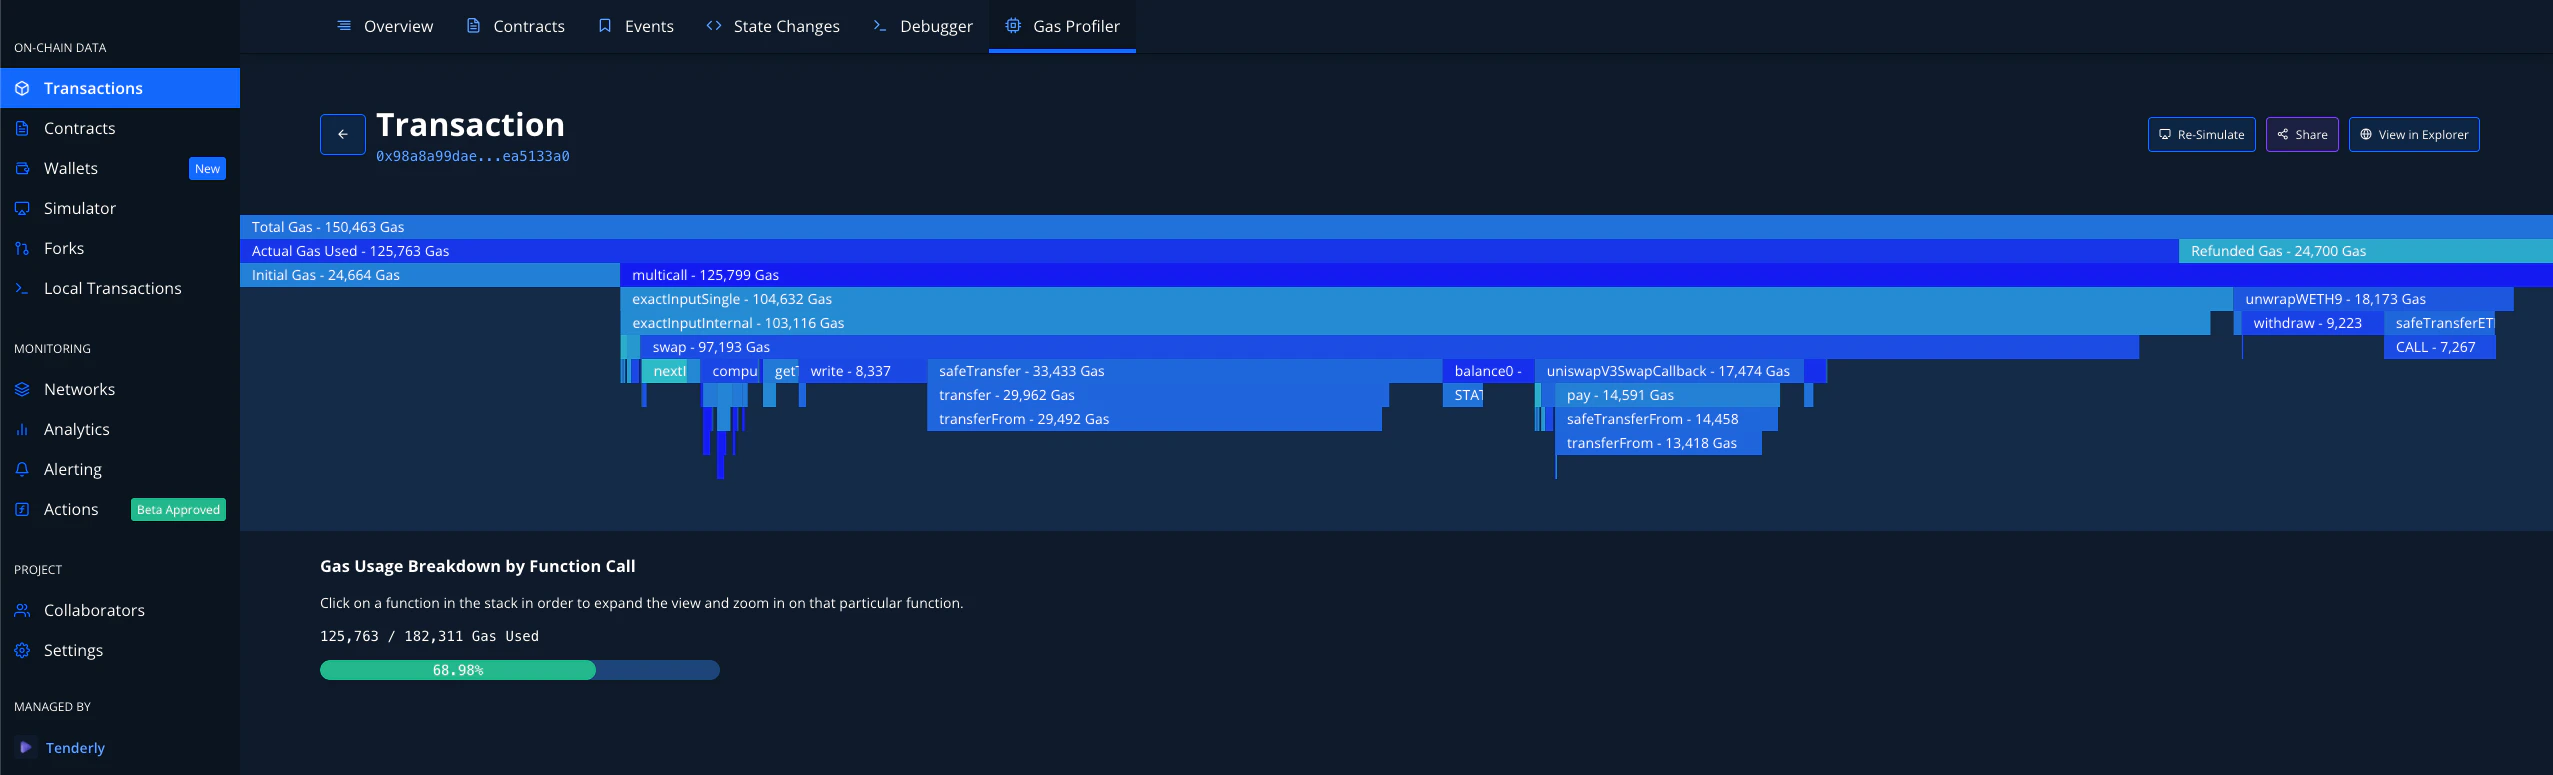 The chart you see in the image above is called a flame graph. It's a common way to show the usage of a resource like a CPU. You can find the example above [here](https://dashboard.tenderly.co/tx/mainnet/0x98a8a99daec2823836ac155003ec7c798ded926a86e1c165716dd0d0ea5133a0).
Each line shows the sum cost of the lines beneath it. If you click on any of the lines (functions), you can see a detailed breakdown of the gas cost of the functions that were invoked.
The chart you see in the image above is called a flame graph. It's a common way to show the usage of a resource like a CPU. You can find the example above [here](https://dashboard.tenderly.co/tx/mainnet/0x98a8a99daec2823836ac155003ec7c798ded926a86e1c165716dd0d0ea5133a0).
Each line shows the sum cost of the lines beneath it. If you click on any of the lines (functions), you can see a detailed breakdown of the gas cost of the functions that were invoked.
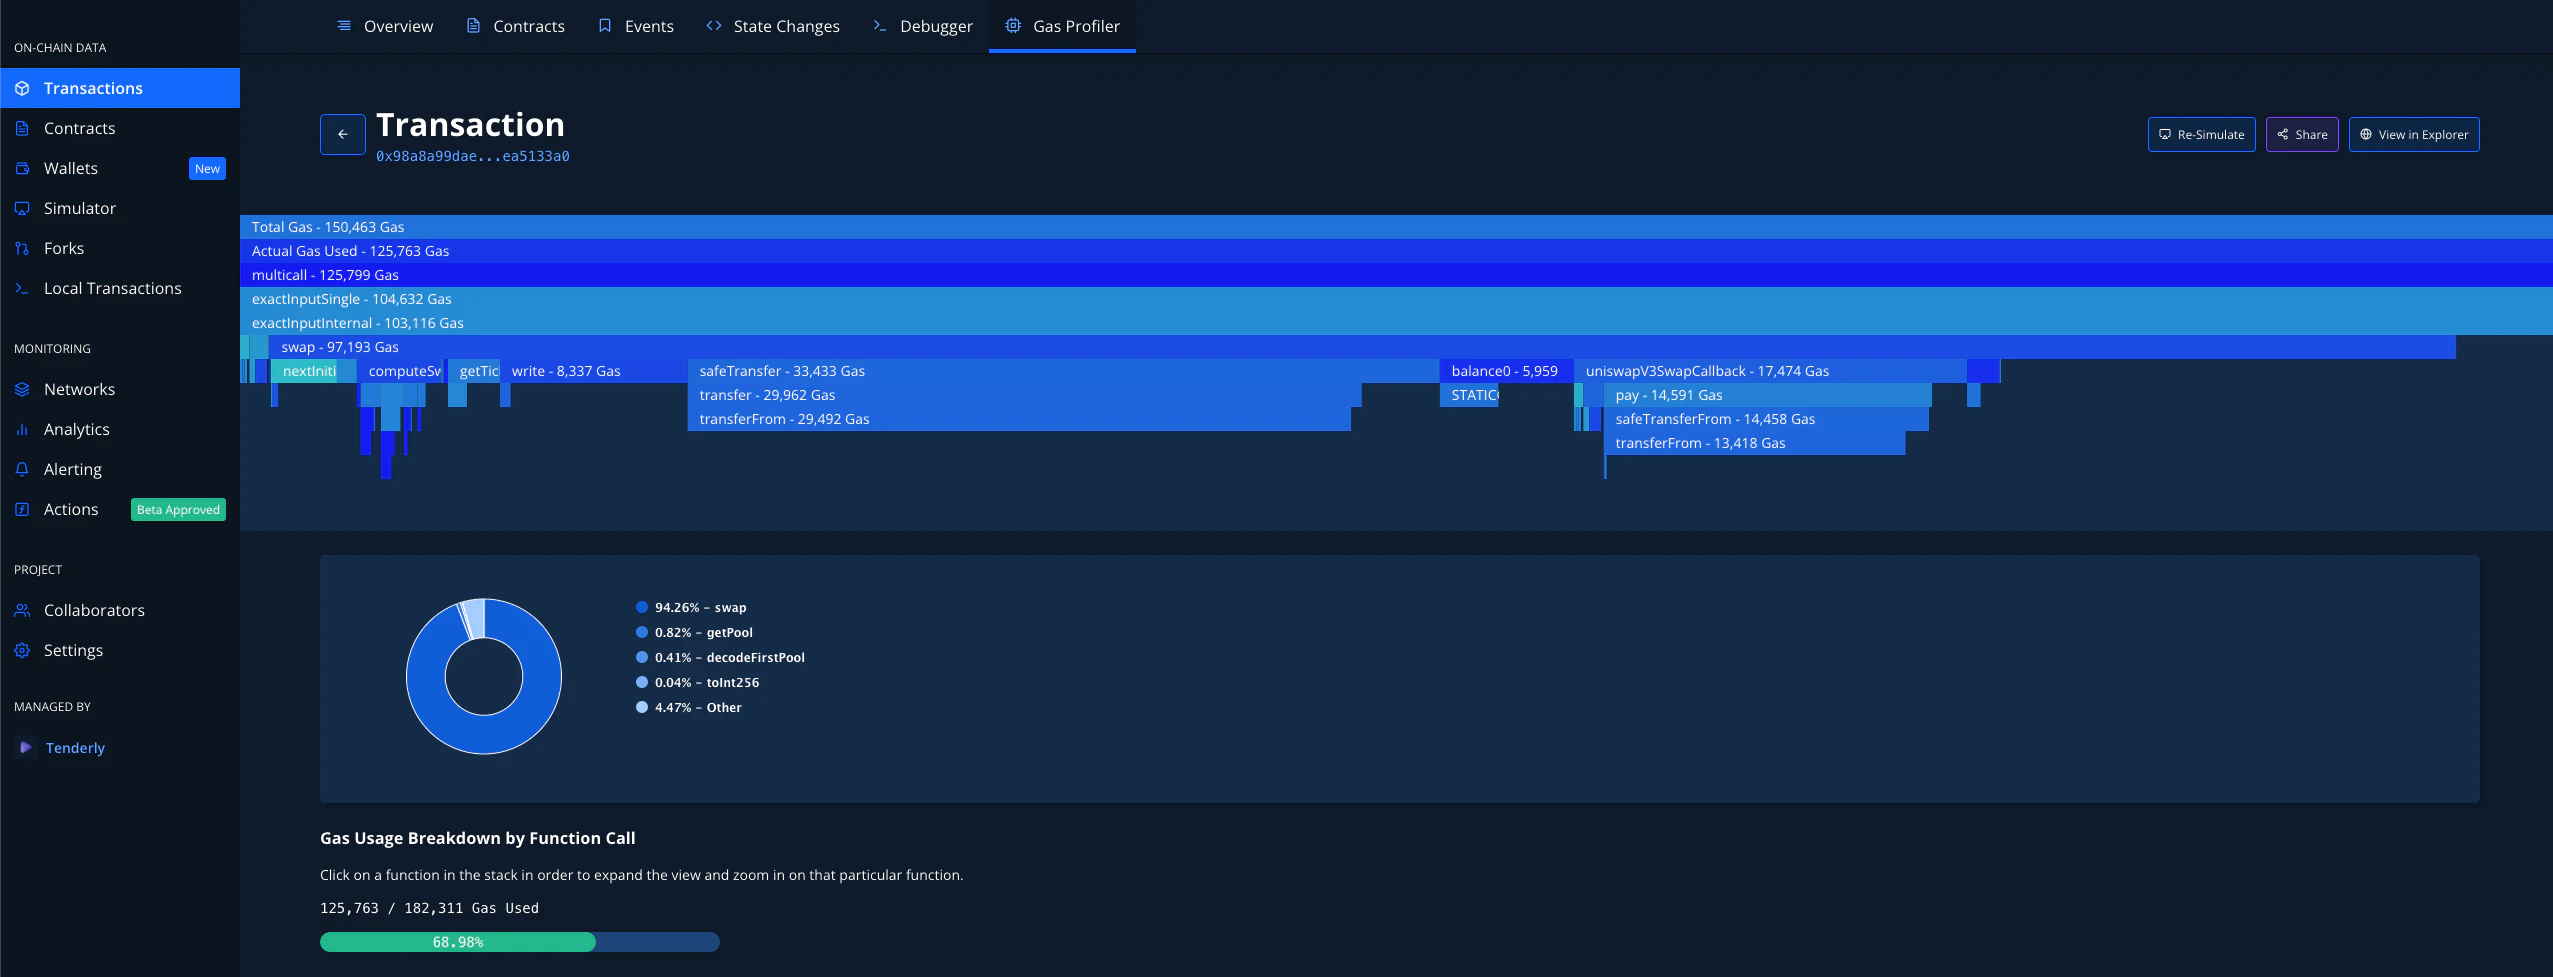 You can finally see which functions are using the most gas and pick the right parts of your code to optimize.