> ## Documentation Index
> Fetch the complete documentation index at: https://docs.tenderly.co/llms.txt
> Use this file to discover all available pages before exploring further.
# How to Use Tenderly Debugger
> Step through transaction execution line by line, inspect state changes, and identify the exact revert point in any smart contract with Tenderly Debugger.
The Tenderly Debugger steps through an EVM transaction's execution, one call and source line at a time, exposing the execution trace, stack, contract state, and the exact point where a transaction reverts. Use it to find why a transaction failed, inspect contract state at any step, and replay a transaction against verified Solidity source.
Watch this quick video to learn the basics of using Debugger and follow the quickstart below for a detailed feature walkthrough.
[Watch on Loom →](https://www.loom.com/share/09413e8a867f4ddeaa41a5080d771895?sid=b8f60cda-fcb8-401b-ba9a-8bb69630fe9a)
## Debugger quickstart
To use the Debugger, you need to start from a specific transaction. Try this [example transaction](https://dashboard.tenderly.co/tx/0x1696cfc031695003b8a58f0379c7f111b34c7612a67681354dc57cb5853c5c63/debugger?trace=0.2.6.21.1\&pk_vid=4405d1610803d9751776942168287f02).
1. Go to the **Transactions** tab on the left side or search for a transaction hash in the top Explorer bar.
2. Click the **Debugger** button located at the top right.
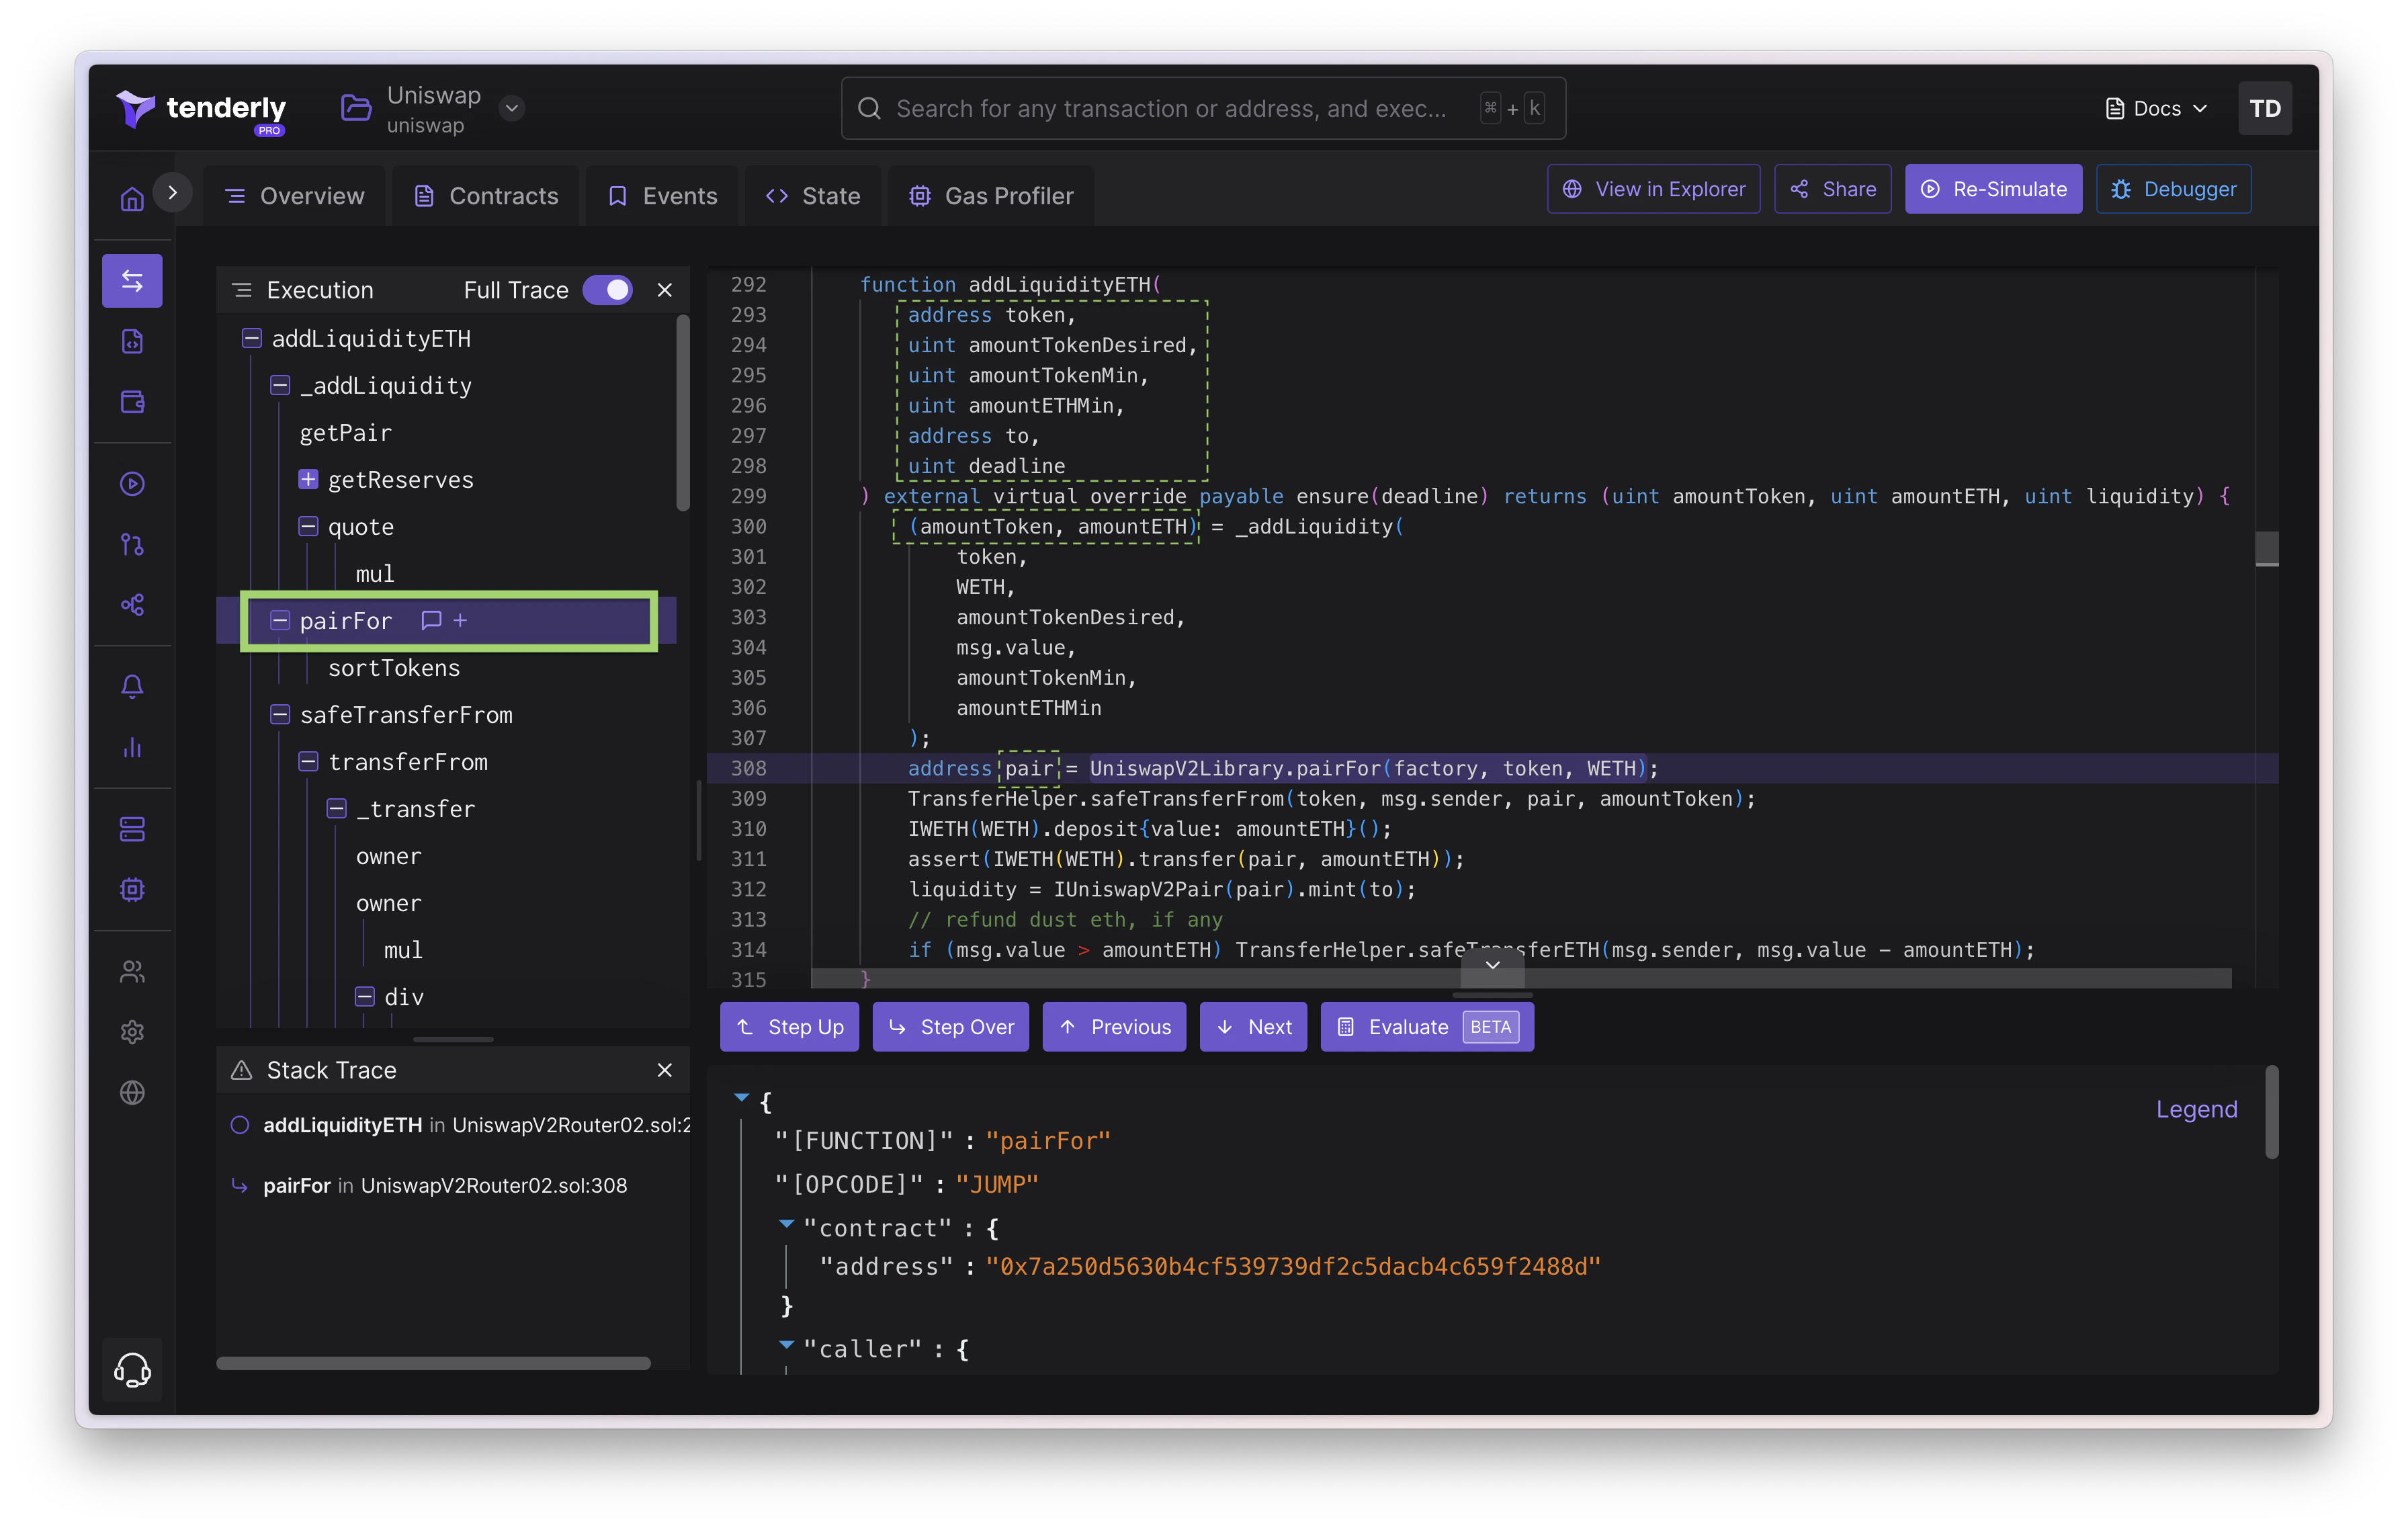
The Debugger interface is comprised of four main panels:
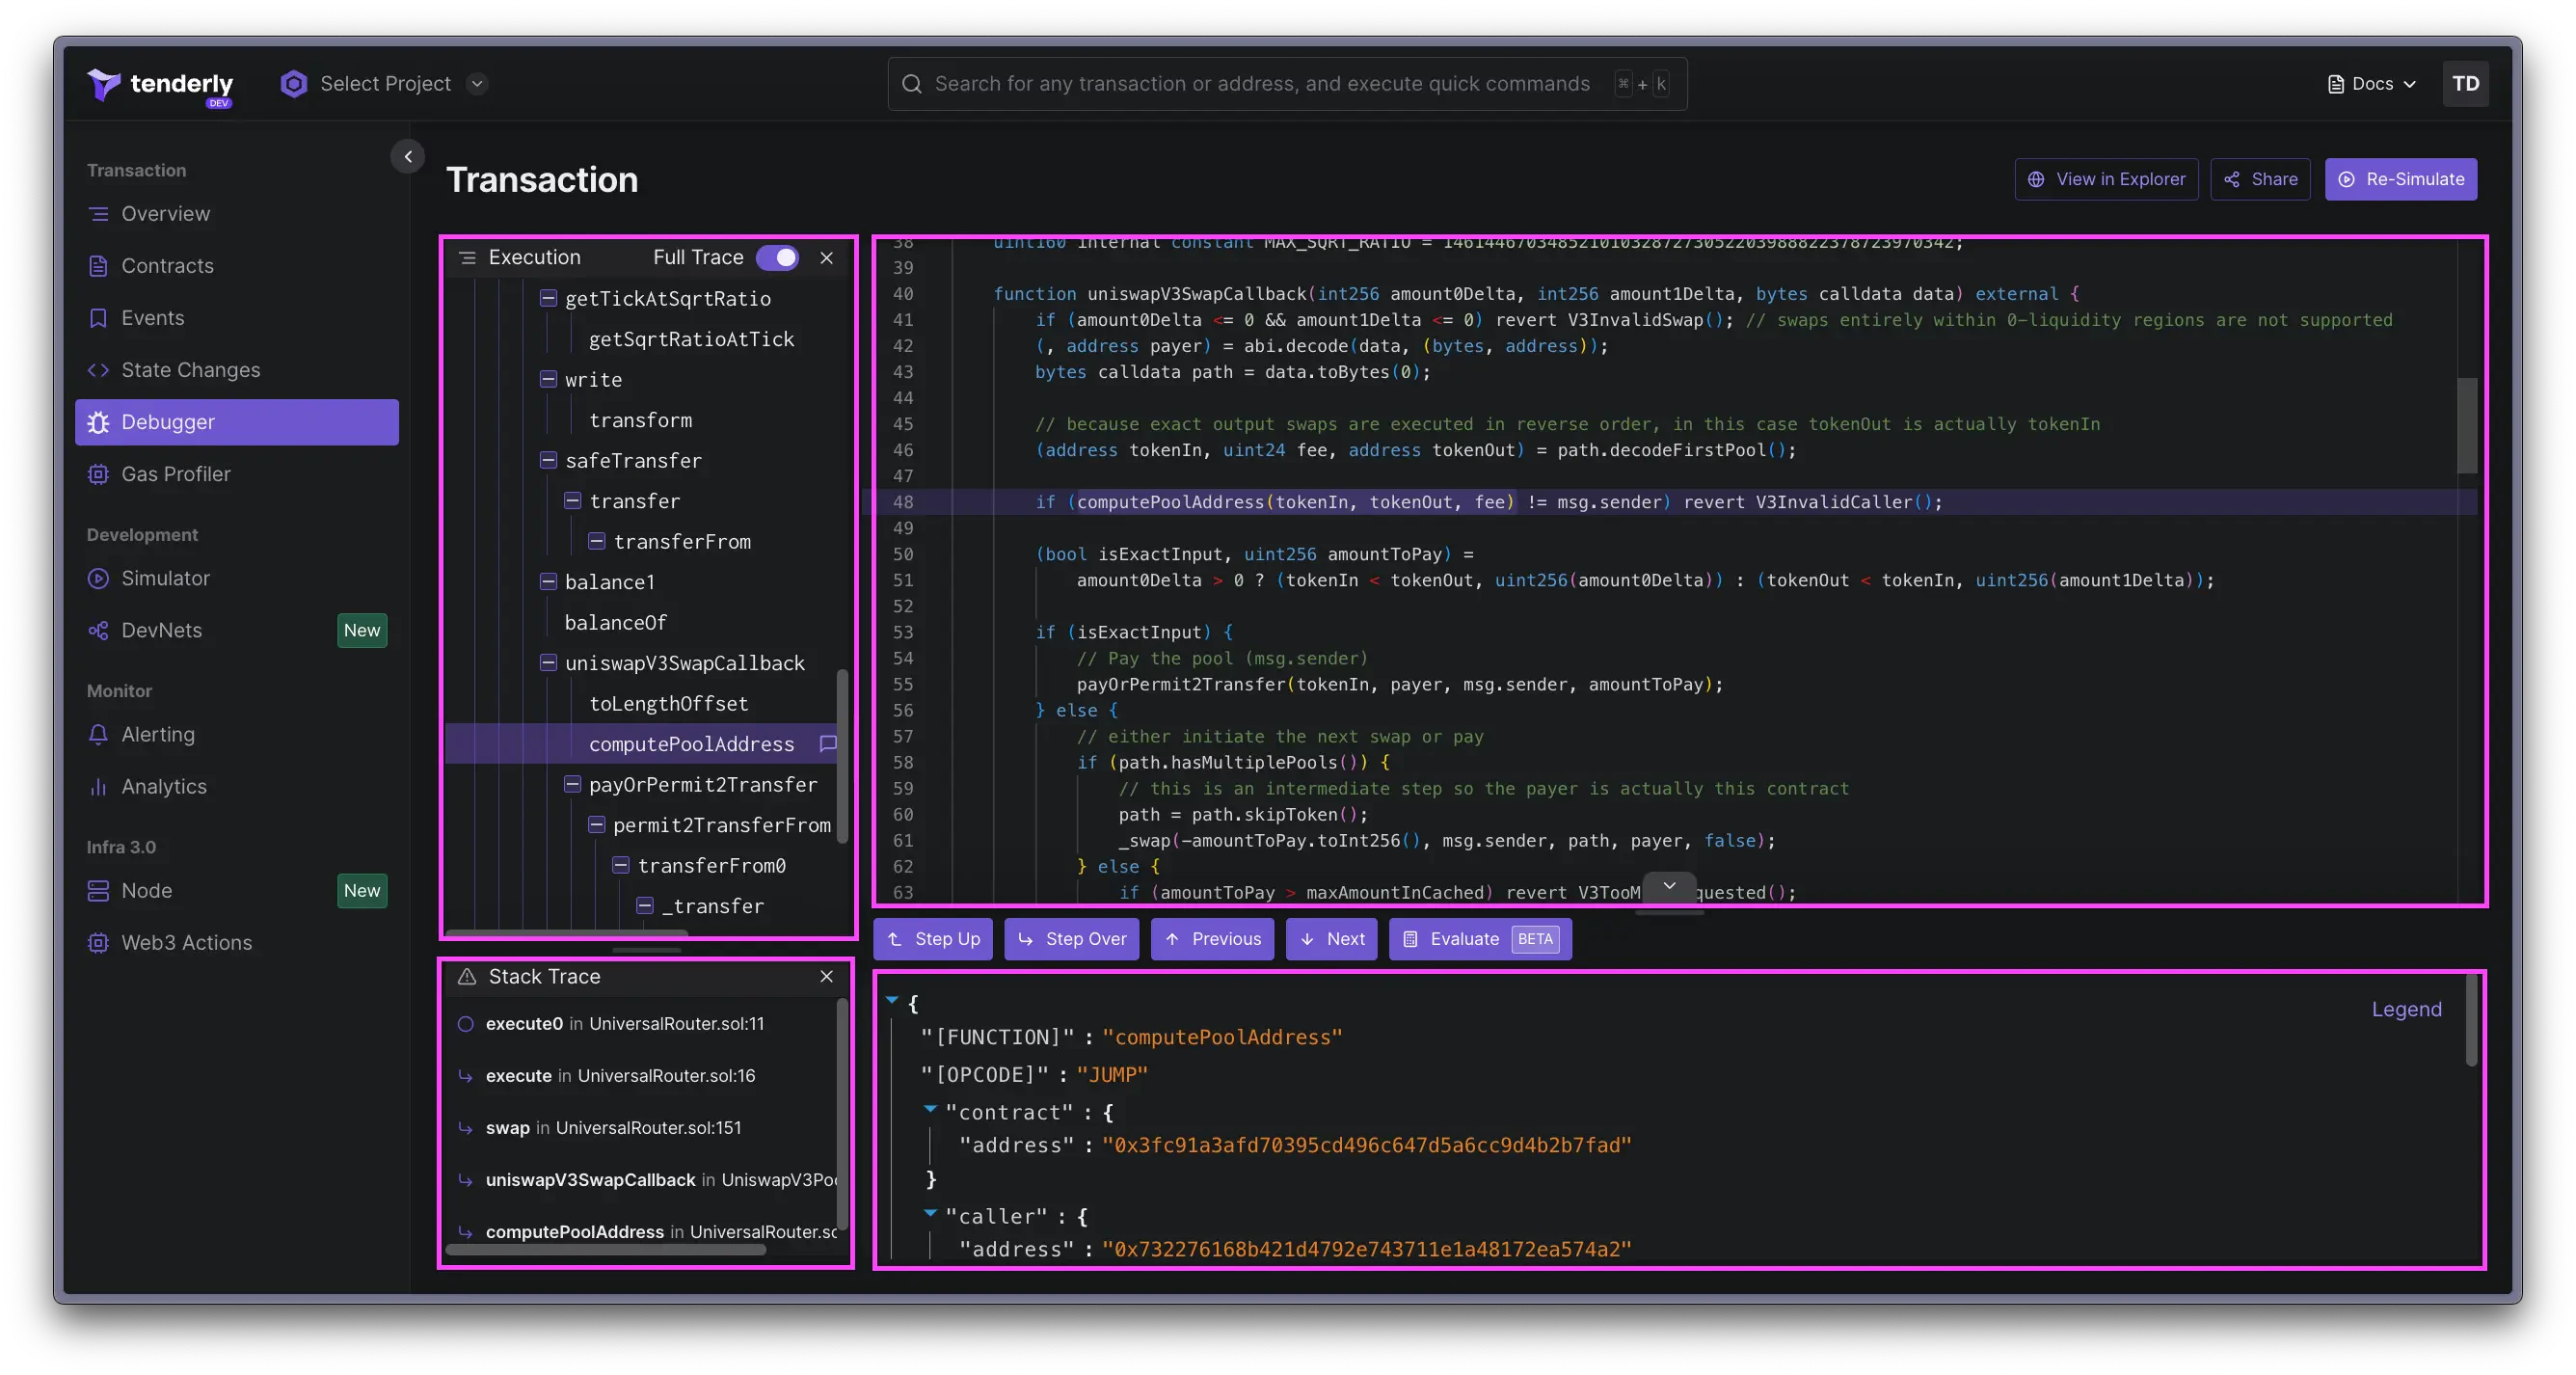 * **Execution trace** (top left): Displays the sequence of calls made during the transaction.
* **Smart contract source code** (top right): Shows the code of the contract being interacted with.
* **Stack trace** (bottom left): Lists the methods called leading up to the current function.
* **Call information** (bottom right): Provides detailed info about the current call.
## Execution trace
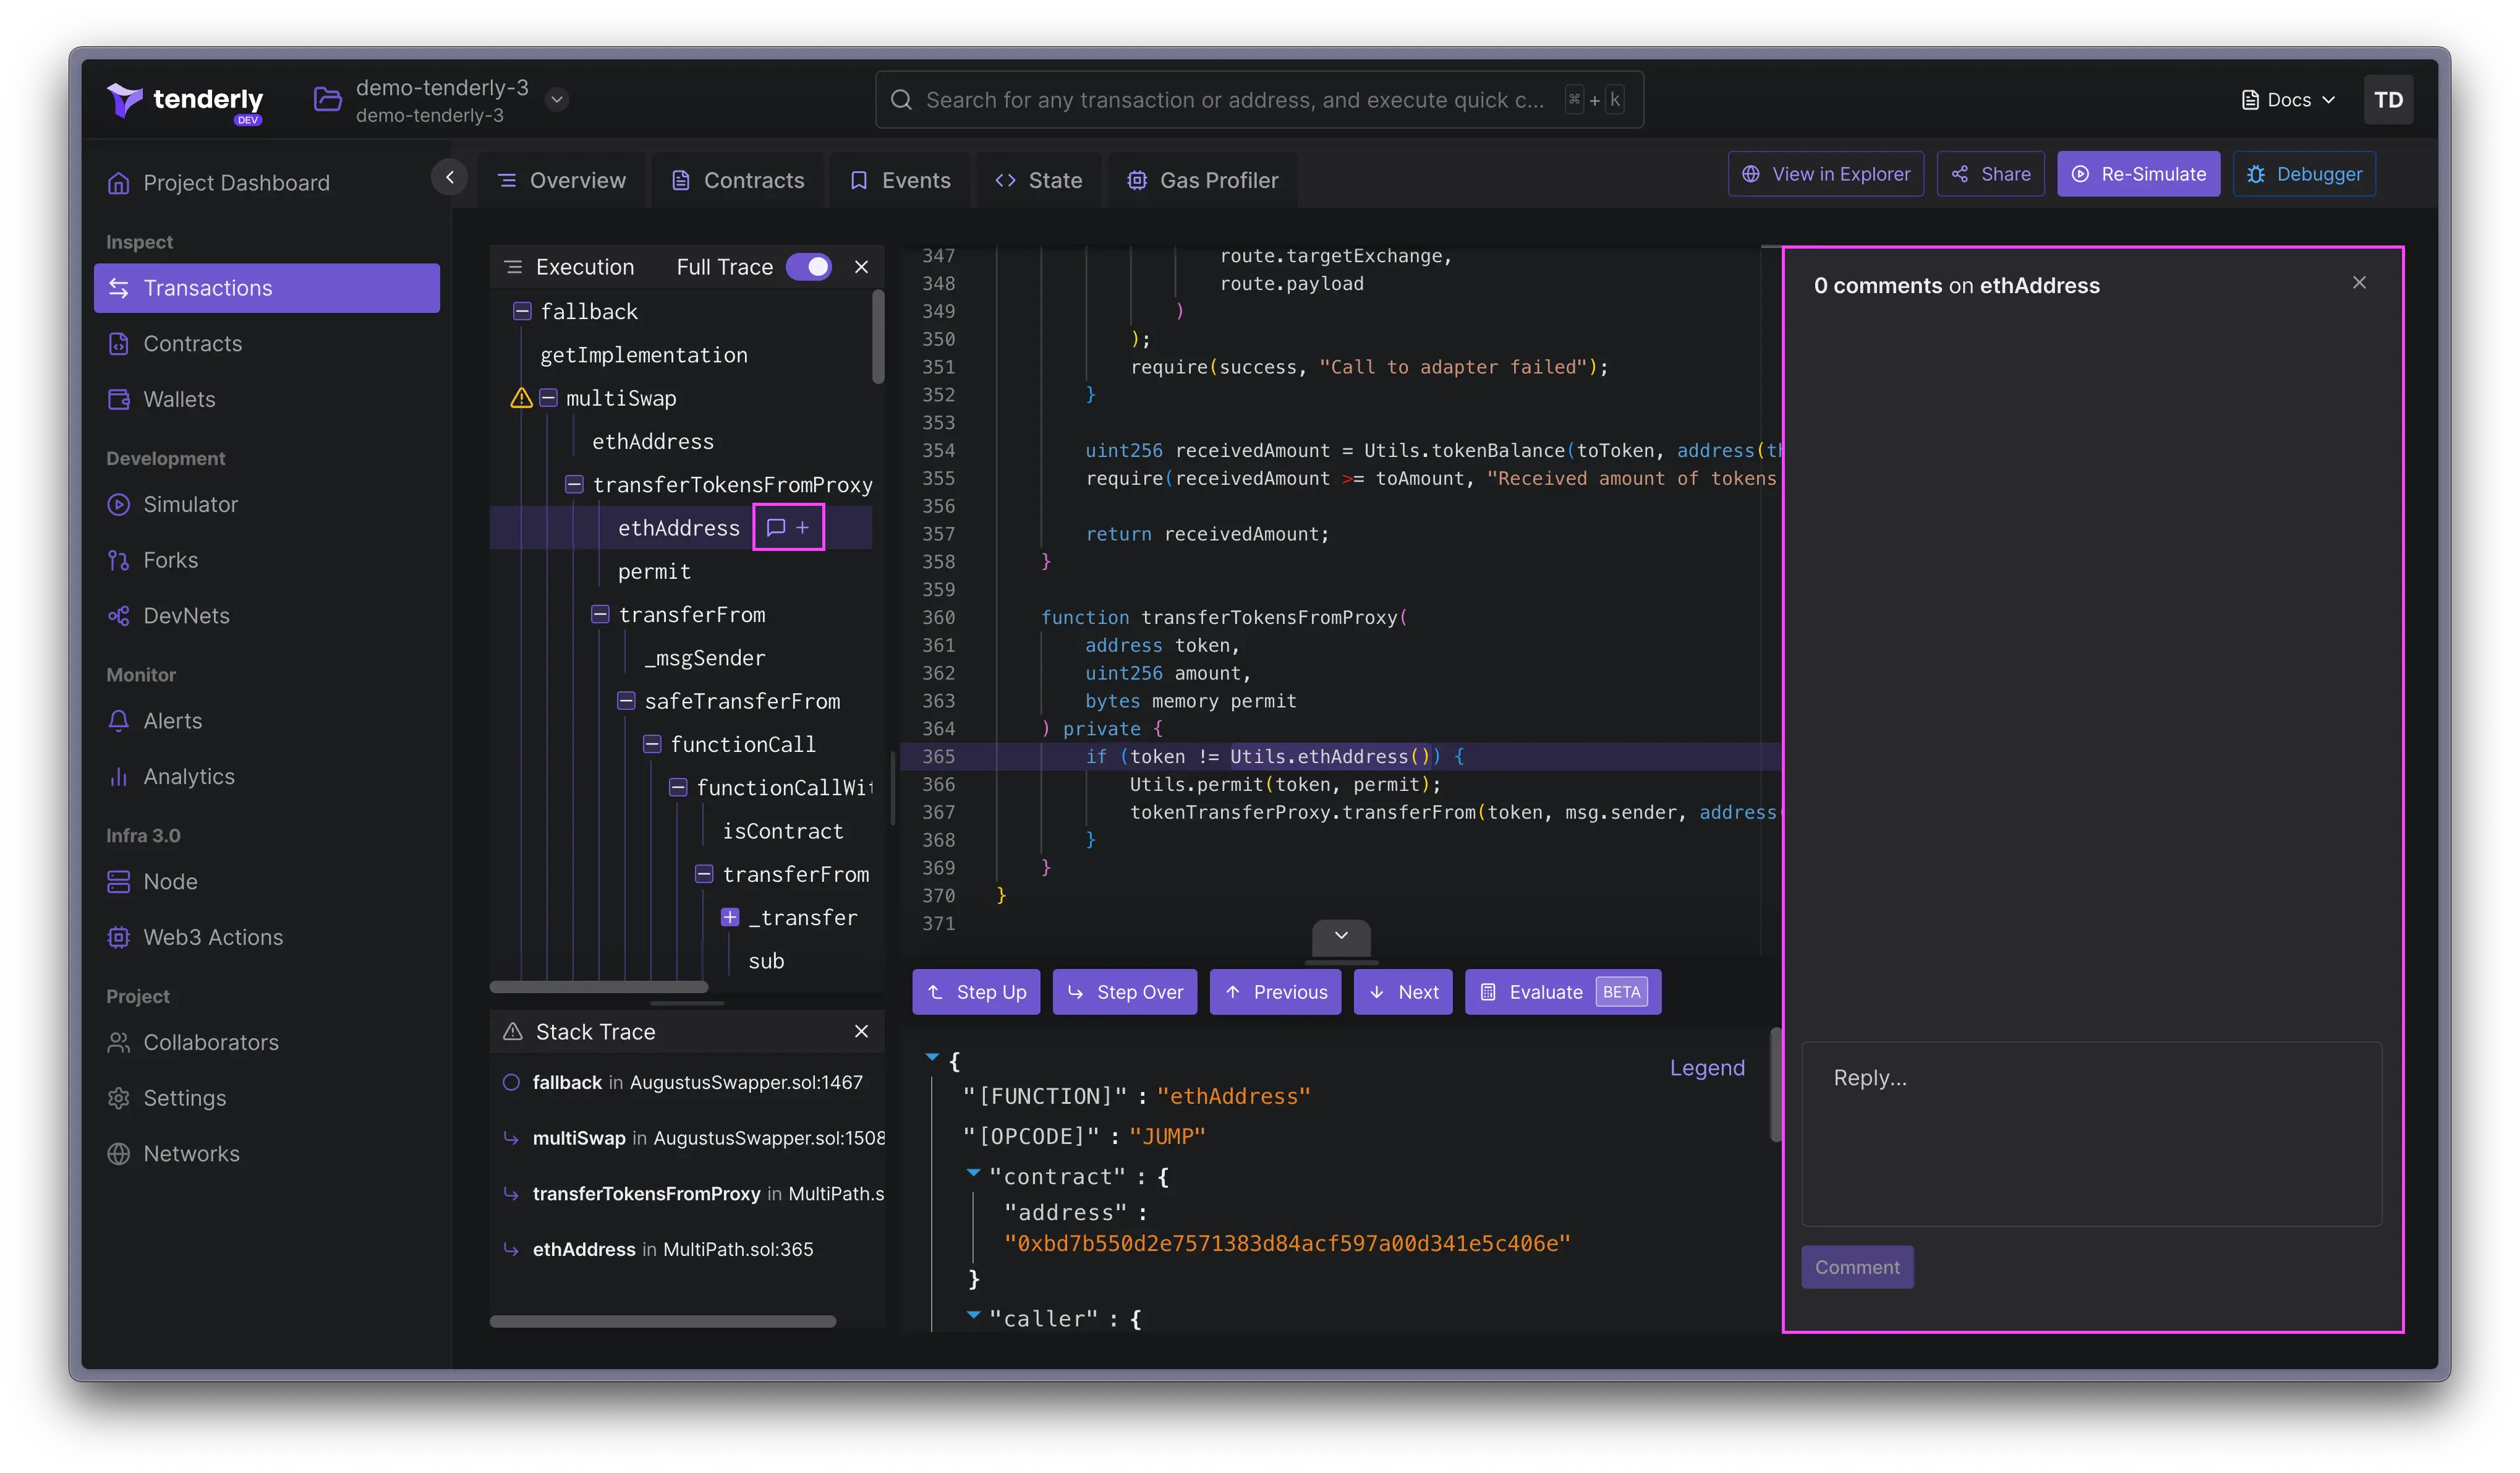
The **Execution Trace** section lets you see every call made during a transaction's life cycle. A handy toggle allows you to filter the view between the full trace or just the `CALL`s and `DELEGATECALL`s.
You can also leave comments directly on any part of the trace, useful for collaboration or personal notes.
* **Execution trace** (top left): Displays the sequence of calls made during the transaction.
* **Smart contract source code** (top right): Shows the code of the contract being interacted with.
* **Stack trace** (bottom left): Lists the methods called leading up to the current function.
* **Call information** (bottom right): Provides detailed info about the current call.
## Execution trace
The **Execution Trace** section lets you see every call made during a transaction's life cycle. A handy toggle allows you to filter the view between the full trace or just the `CALL`s and `DELEGATECALL`s.
You can also leave comments directly on any part of the trace, useful for collaboration or personal notes.
 ## Stack trace
The **Stack Trace** offers a look at the methods that have been invoked leading up to the active function call, giving you a clearer picture of the transaction's flow.
## Decoding call information
Here, you get decoded details about the current call in the transaction's execution trace in JSON format. This includes:
* Invoked function's name
* Opcodes (`JUMP`, `CALL`, `DELEGATECALL`, `STATICCALL`, `CREATE2`, `CREATE`, `REVERT`, `JUMPDEST`)
* Contract and caller addresses, plus the caller's balance
* Decoded inputs and outputs
* Gas usage stats, showing total gas used, gas consumed by the current function, and remaining gas
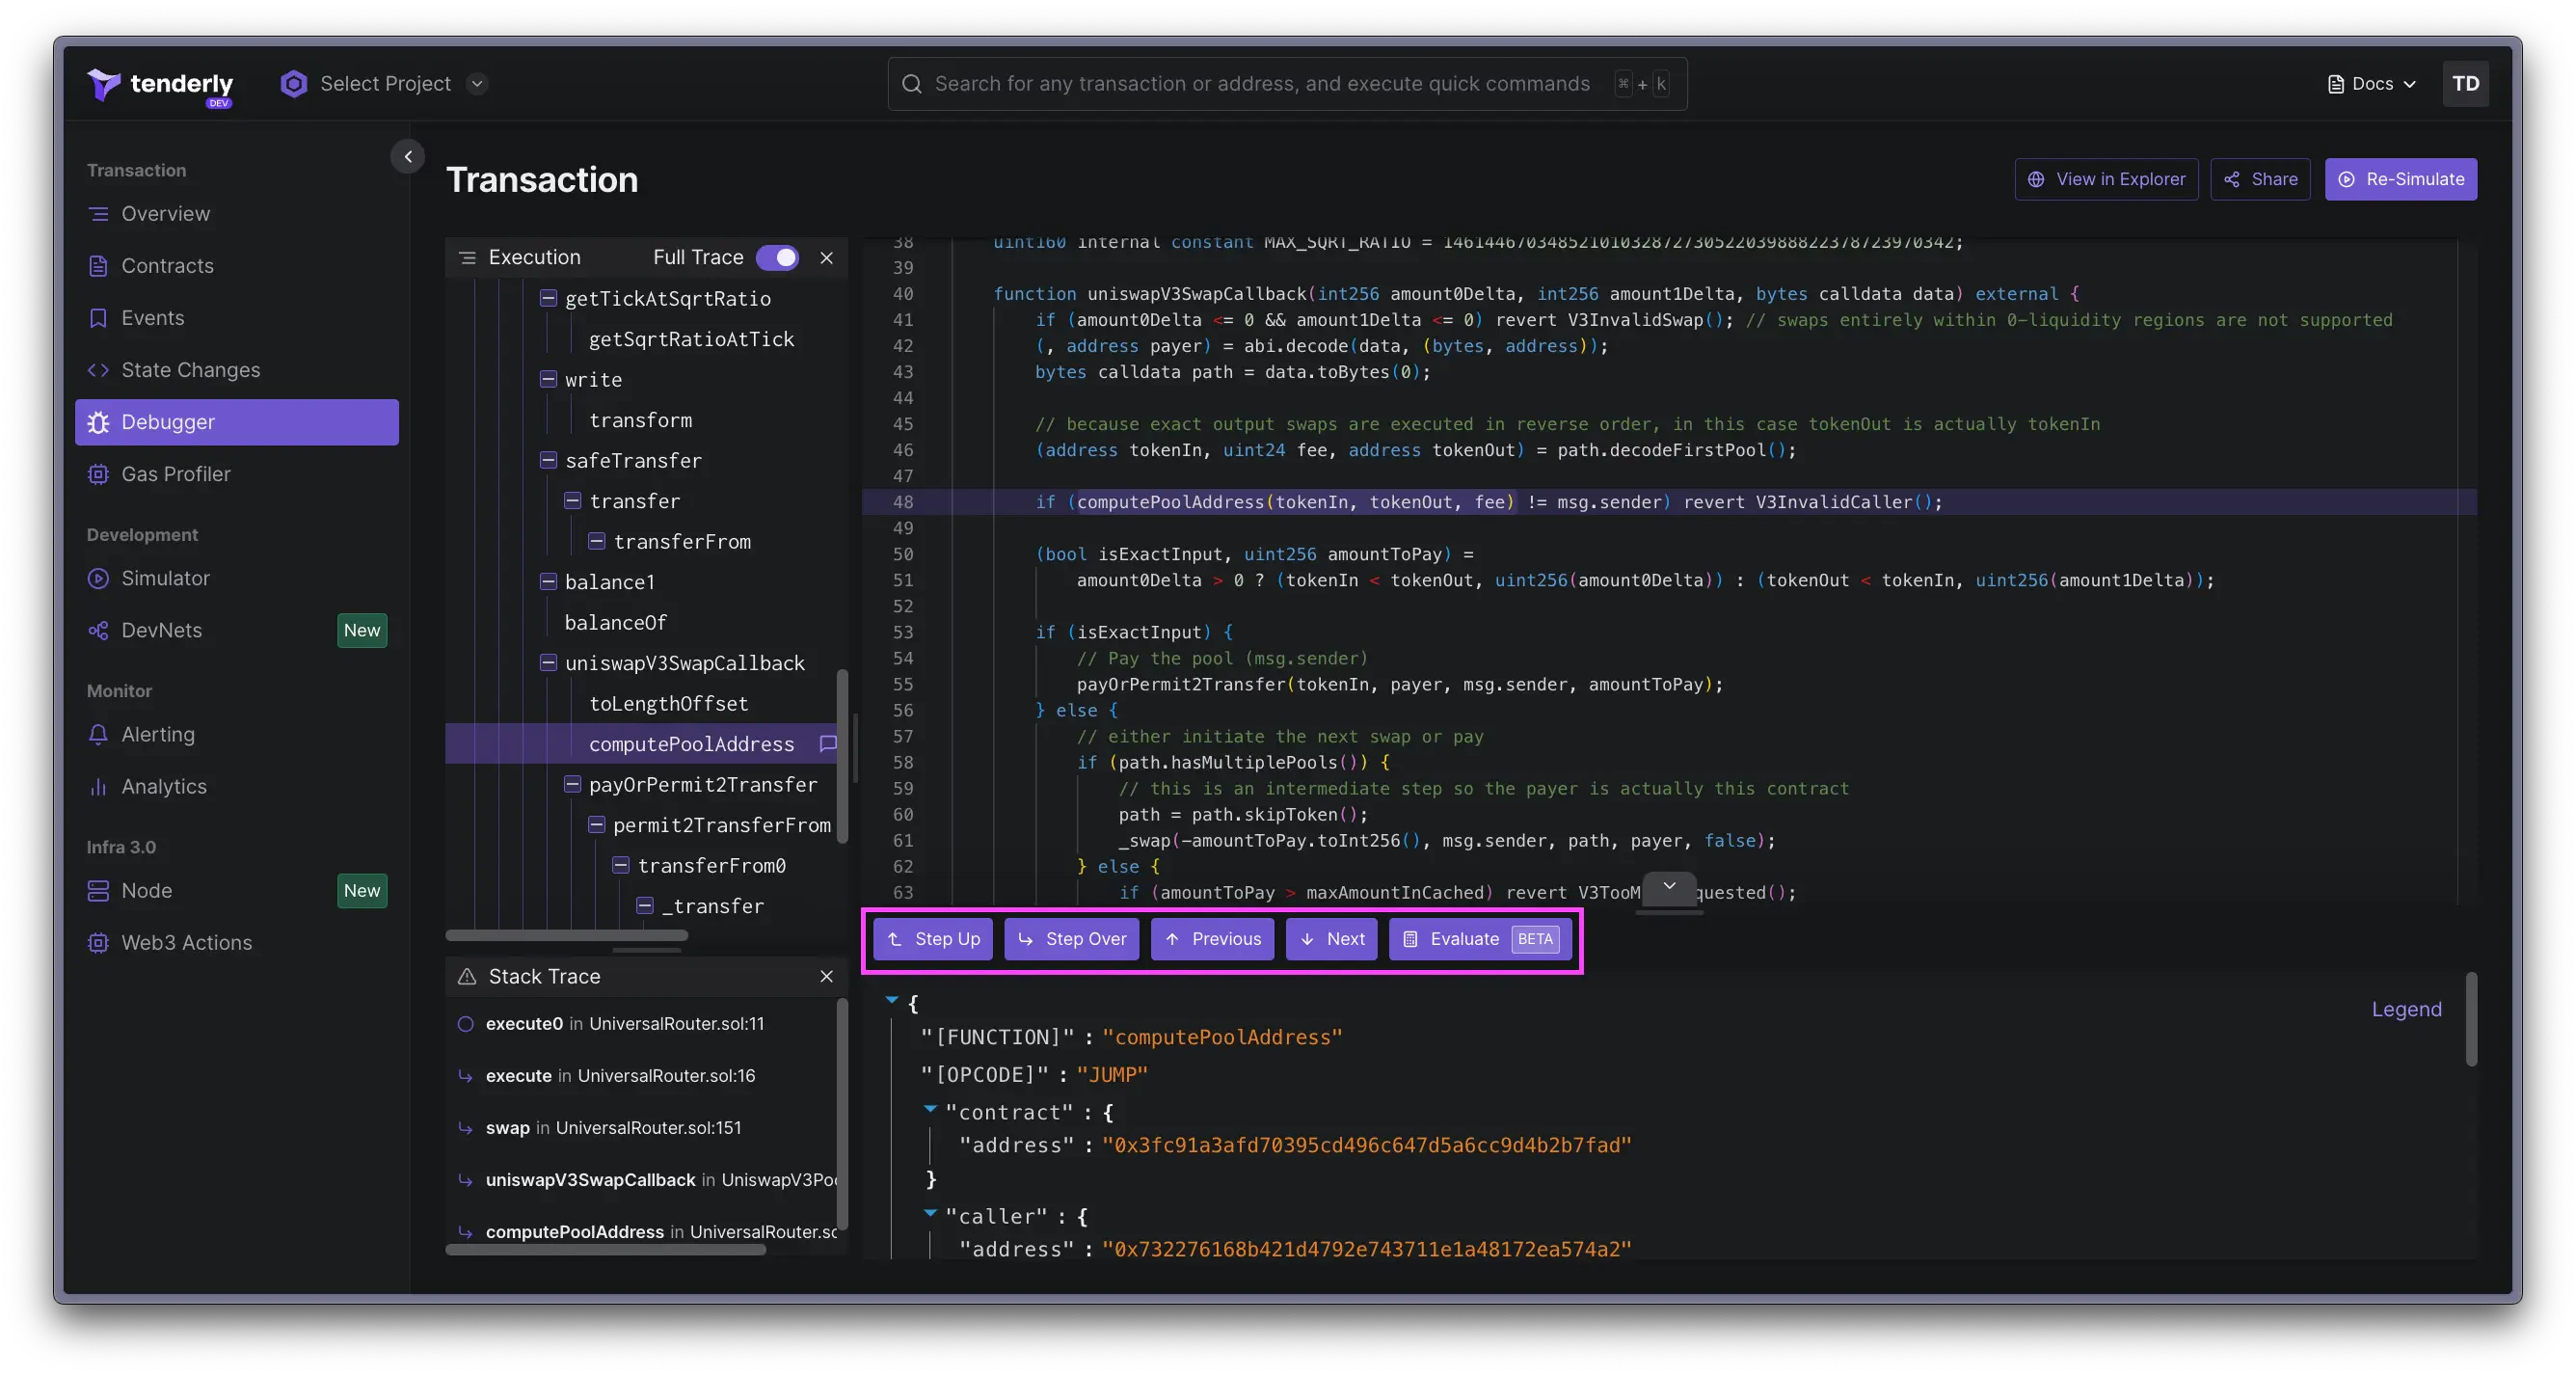
## Navigating through the call trace
Jumping through the call trace and code lines is straightforward with the Debugger's navigation buttons.
**Next/Previous** moves you through the call trace, while **Step Up** and **Step Over** help you navigate the stack trace and call levels.
## Stack trace
The **Stack Trace** offers a look at the methods that have been invoked leading up to the active function call, giving you a clearer picture of the transaction's flow.
## Decoding call information
Here, you get decoded details about the current call in the transaction's execution trace in JSON format. This includes:
* Invoked function's name
* Opcodes (`JUMP`, `CALL`, `DELEGATECALL`, `STATICCALL`, `CREATE2`, `CREATE`, `REVERT`, `JUMPDEST`)
* Contract and caller addresses, plus the caller's balance
* Decoded inputs and outputs
* Gas usage stats, showing total gas used, gas consumed by the current function, and remaining gas
## Navigating through the call trace
Jumping through the call trace and code lines is straightforward with the Debugger's navigation buttons.
**Next/Previous** moves you through the call trace, while **Step Up** and **Step Over** help you navigate the stack trace and call levels.
 ## Evaluating expressions
The **Evaluate** feature allows you to test out expressions directly within the Debugger. This is perfect for checking global variables, contract variables, function arguments, and local variables.
## Evaluating expressions
The **Evaluate** feature allows you to test out expressions directly within the Debugger. This is perfect for checking global variables, contract variables, function arguments, and local variables.
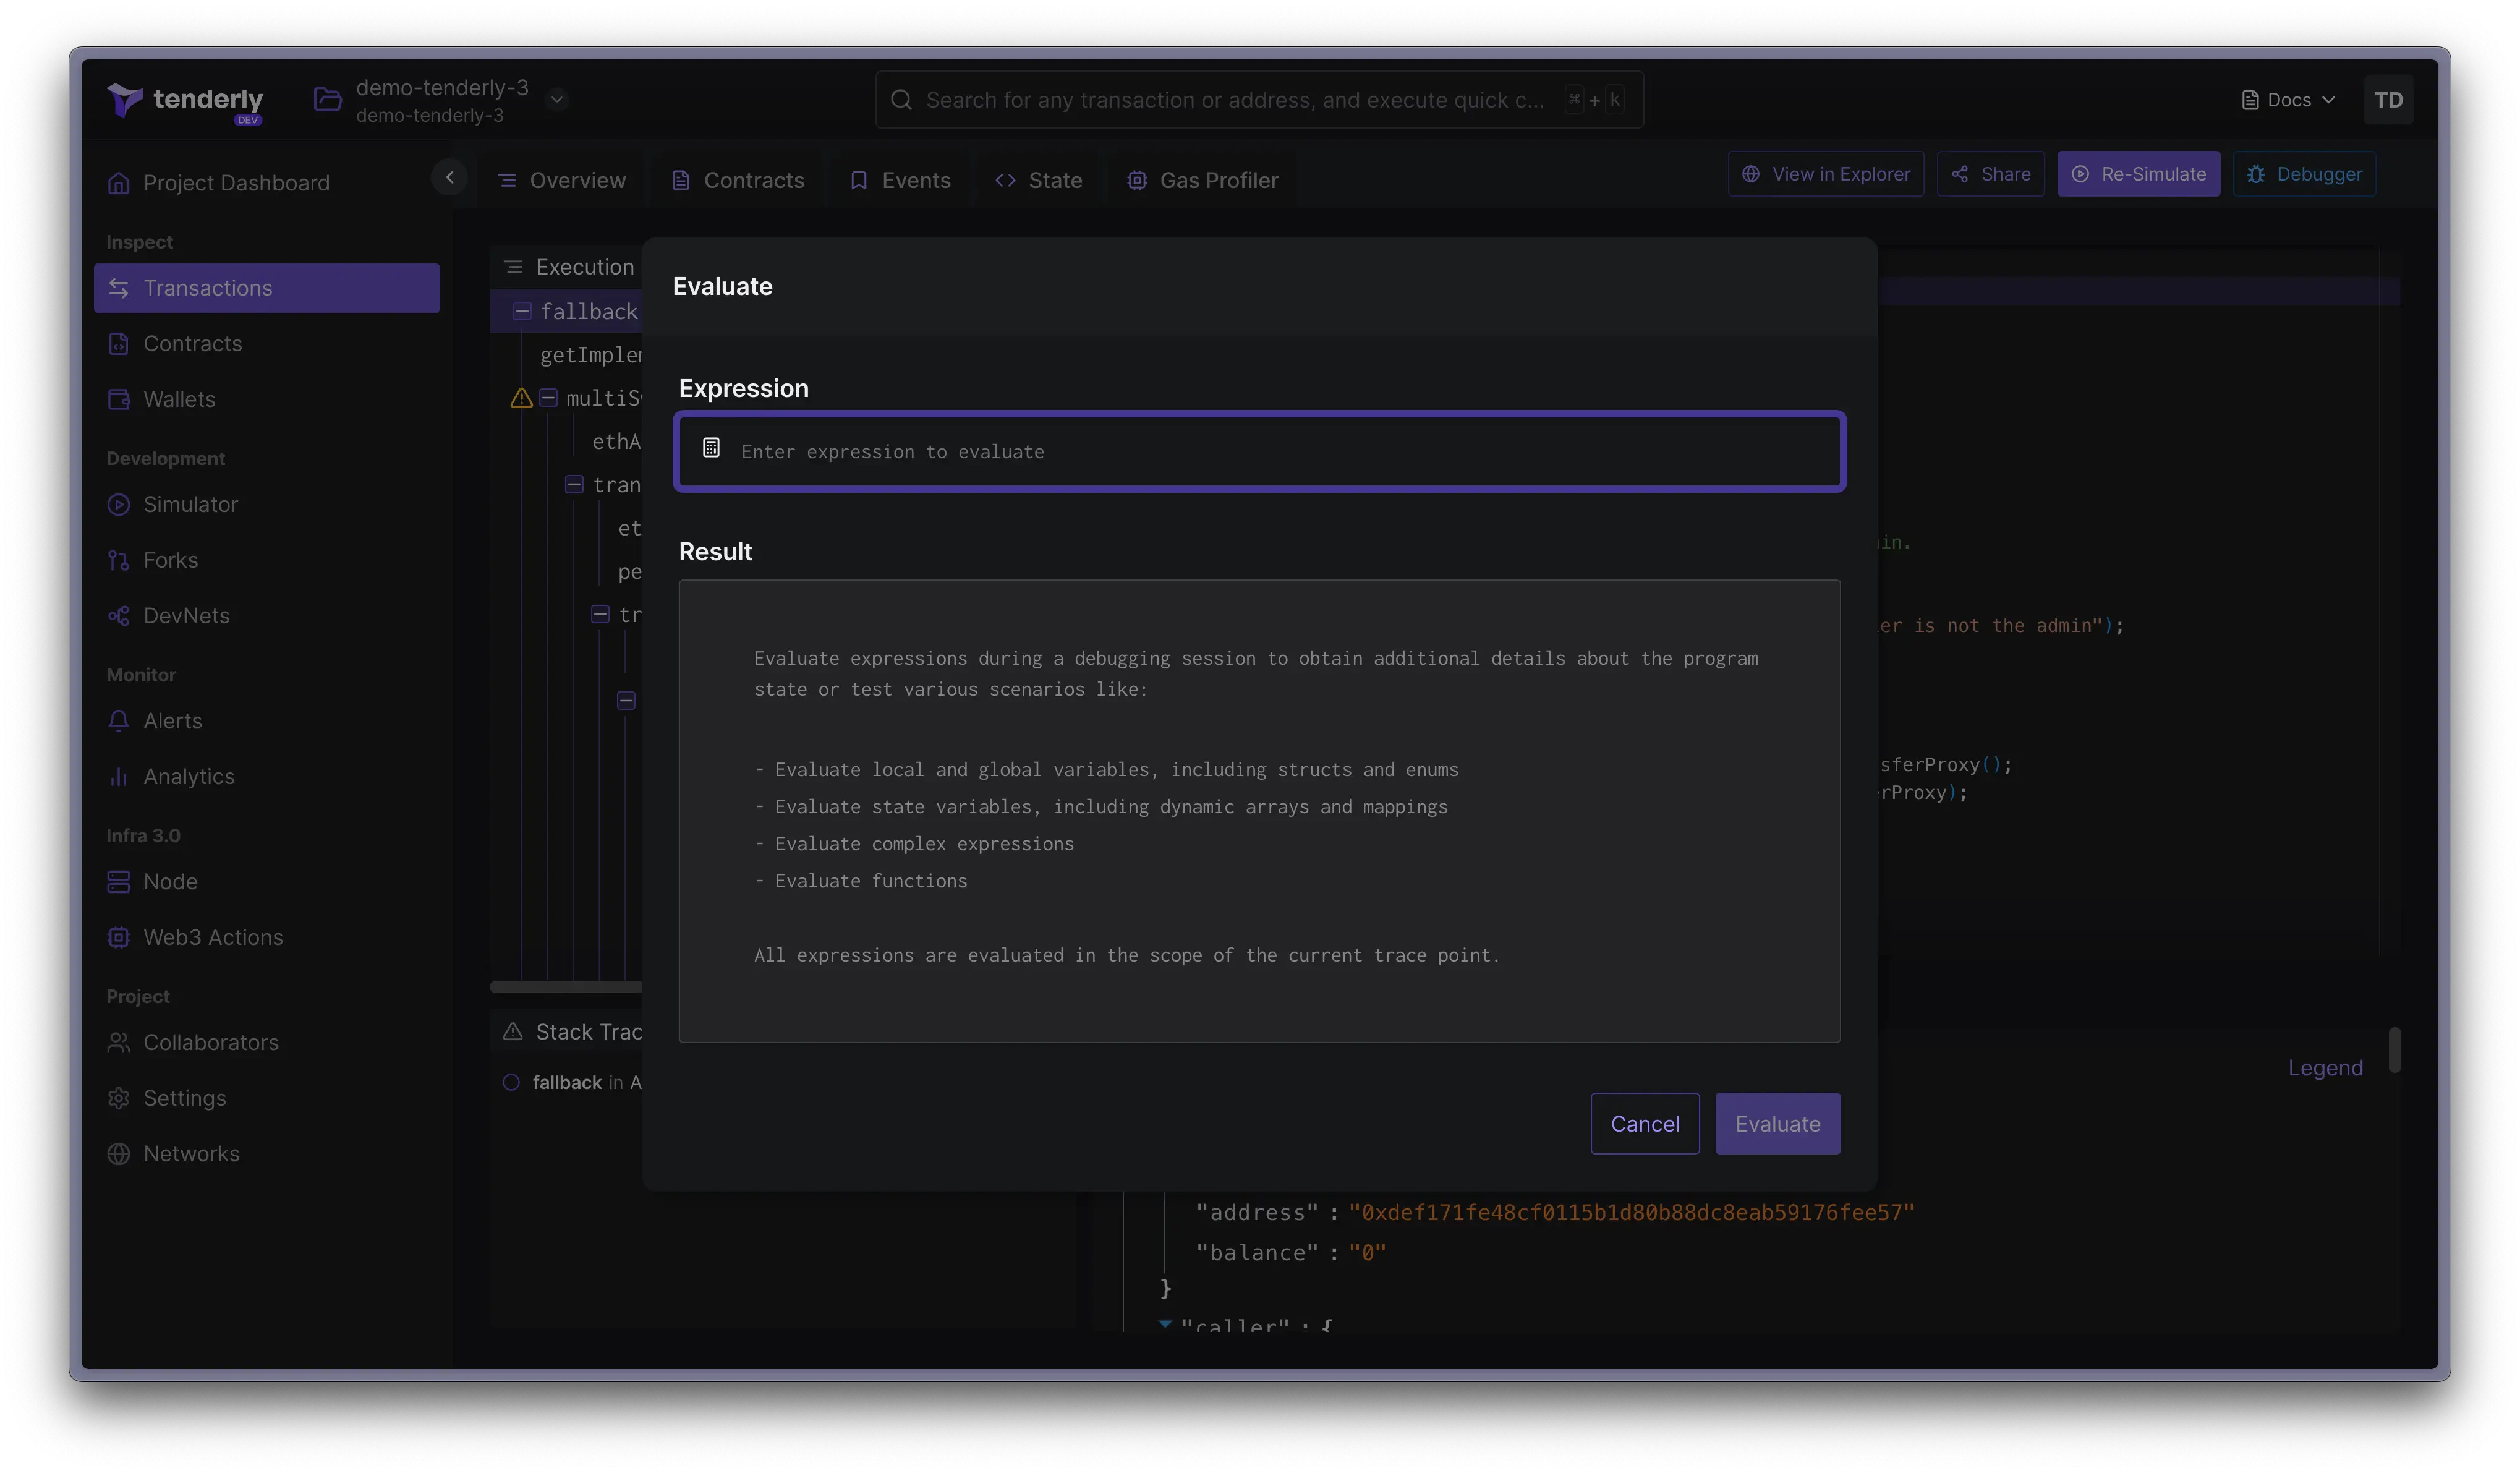 The current version of **Evaluate** supports expressions in the form of arrays and structs. Tuples are not supported so they can't be evaluated.
 Note that Evaluate is still under development and we're working hard to make it even more powerful.