> ## Documentation Index
> Fetch the complete documentation index at: https://docs.tenderly.co/llms.txt
> Use this file to discover all available pages before exploring further.
# Execution Overview
> function trace, call trace, contracts, events, state changes, और gas profiler के साथ एक जगह पर transaction का समग्र दृश्य प्राप्त करें।
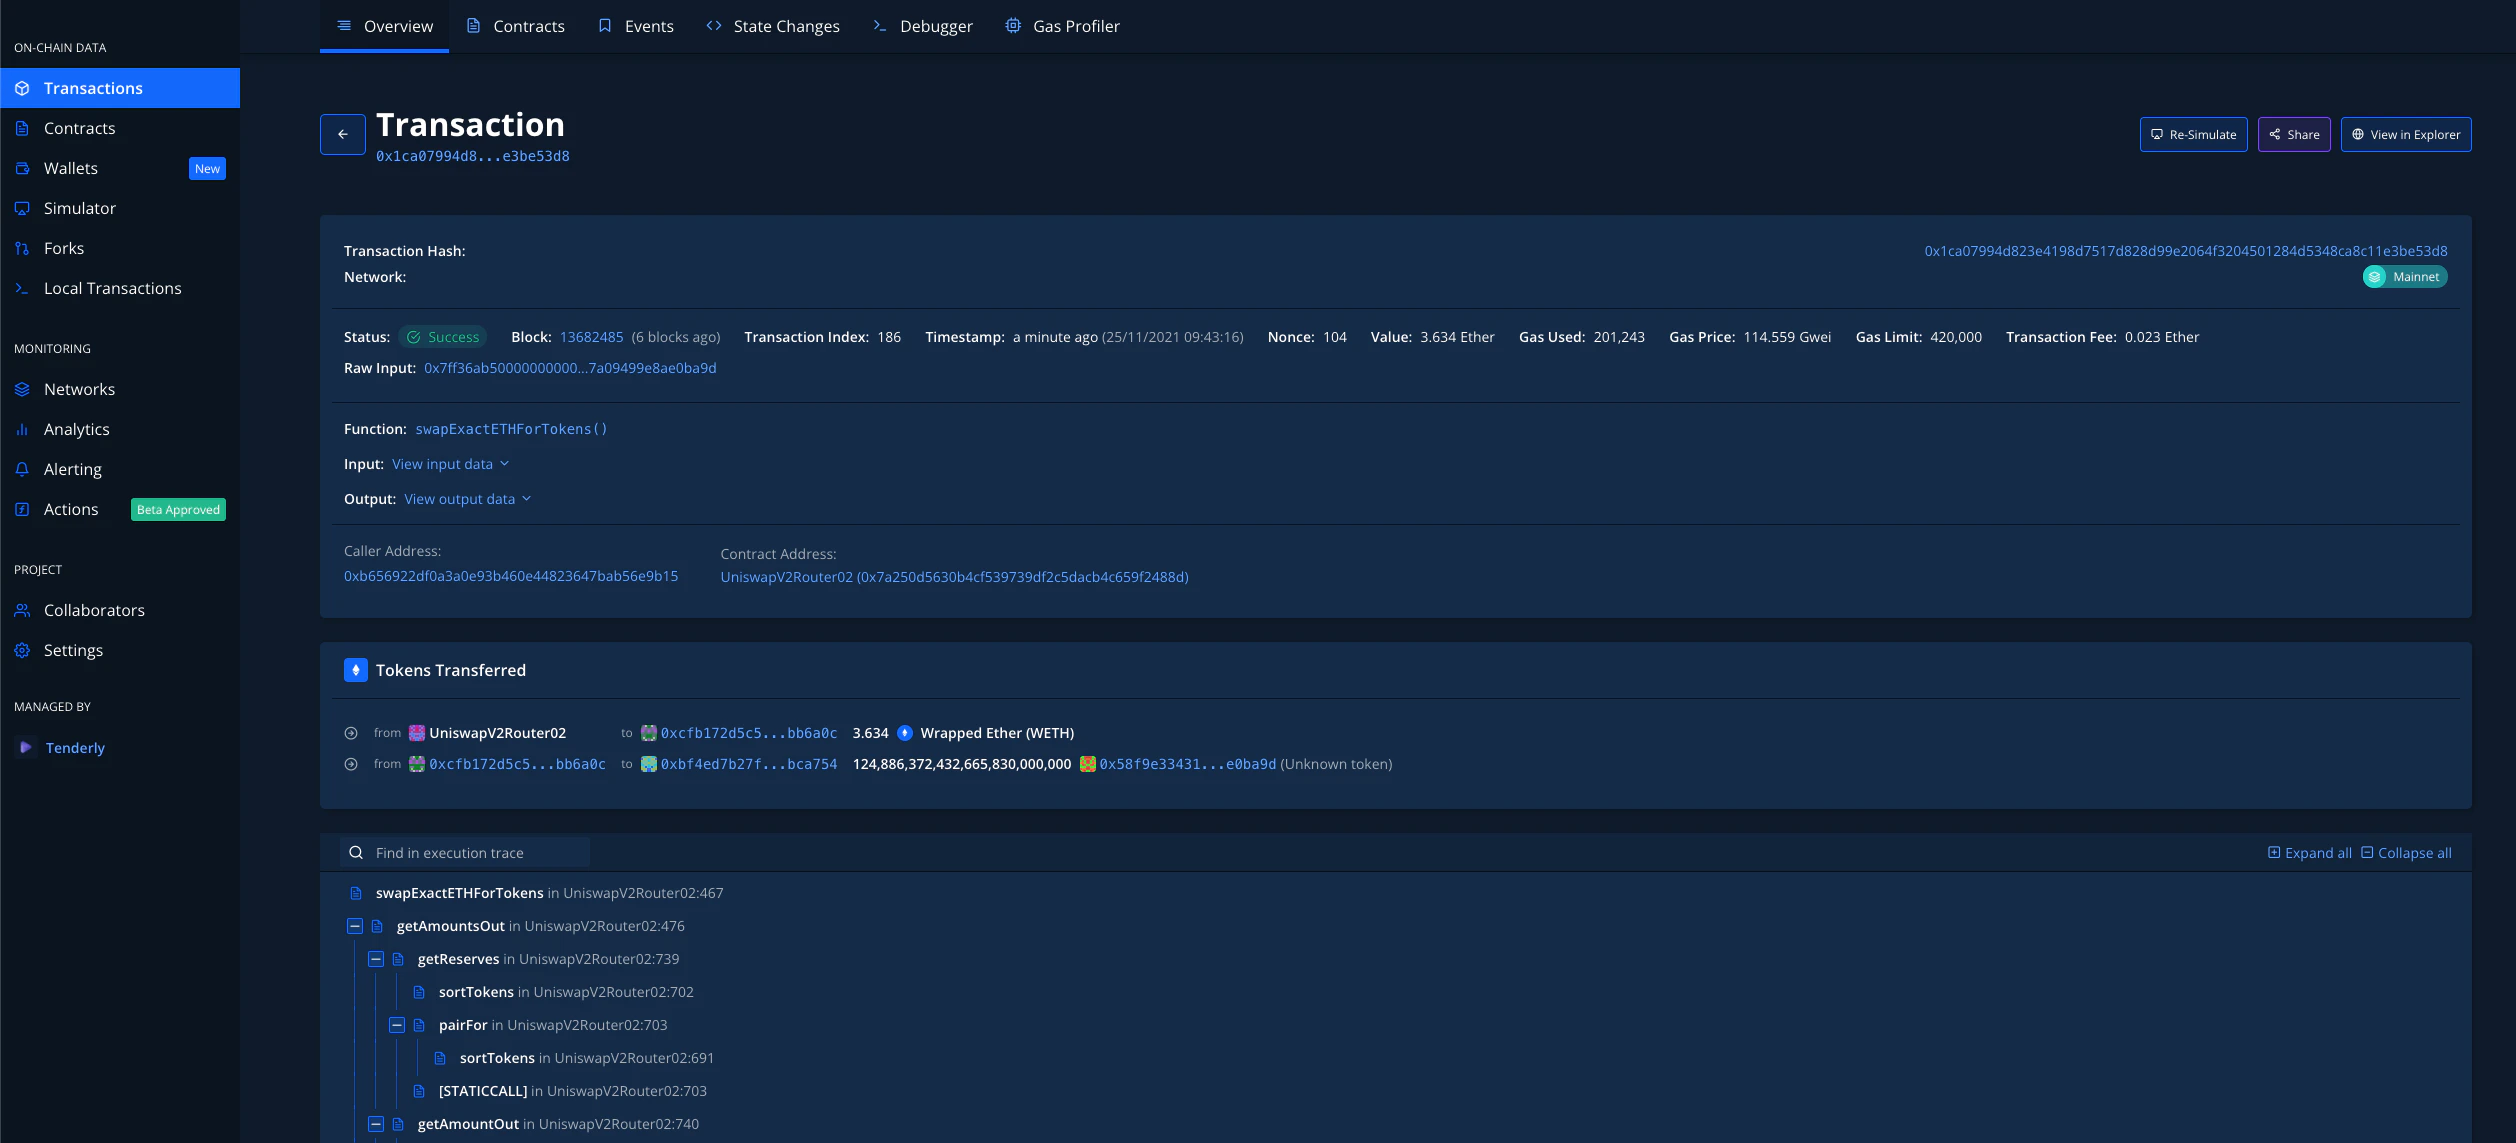
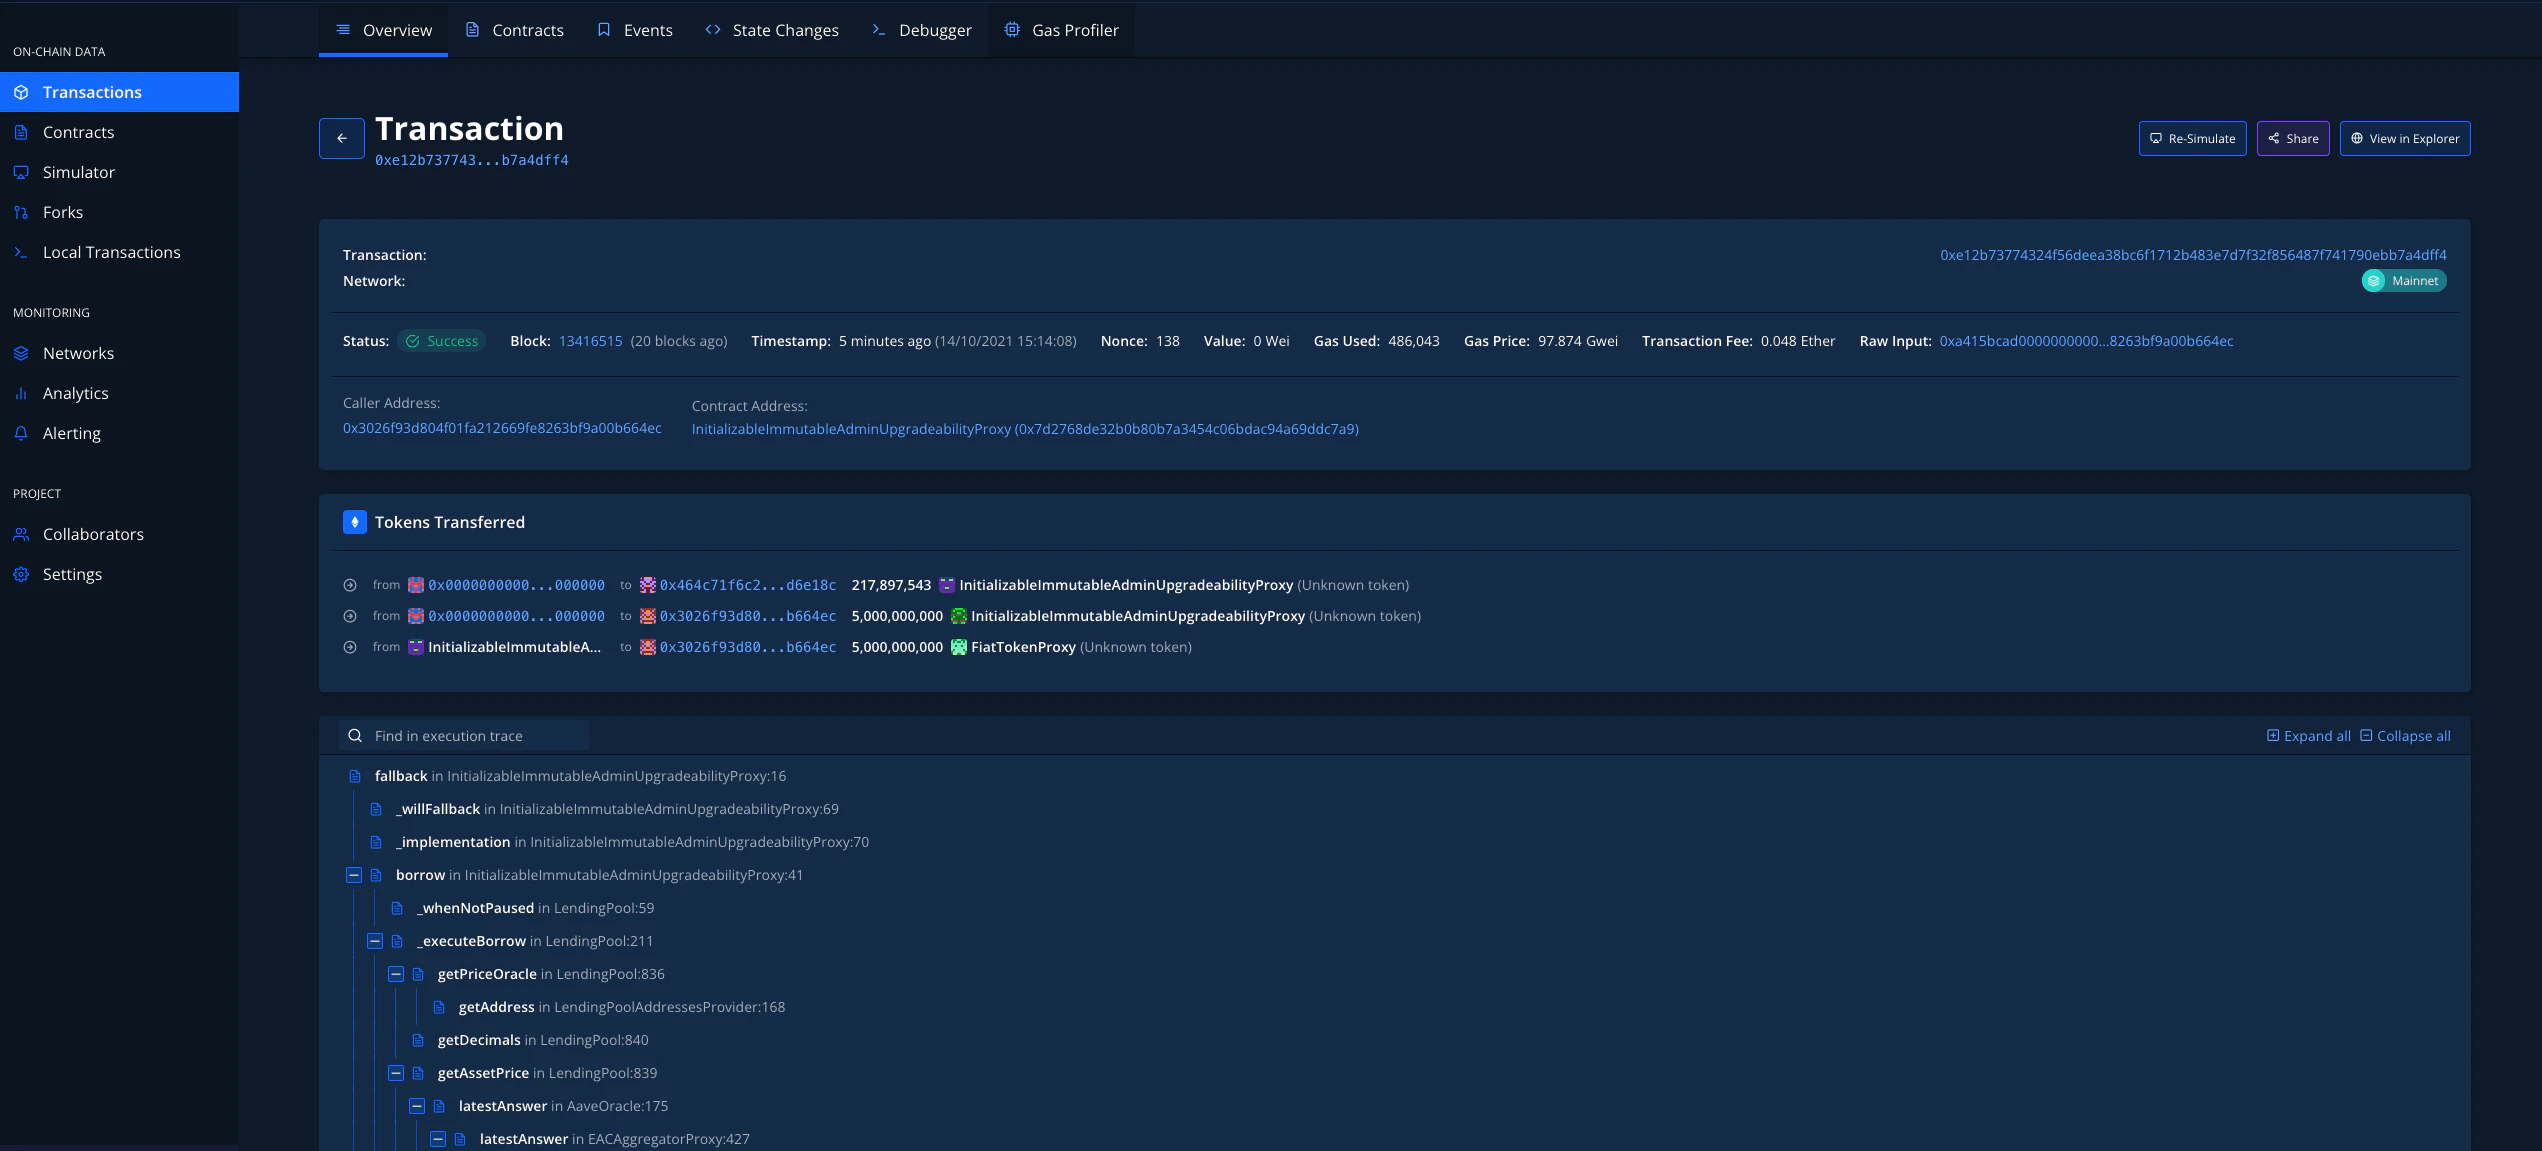
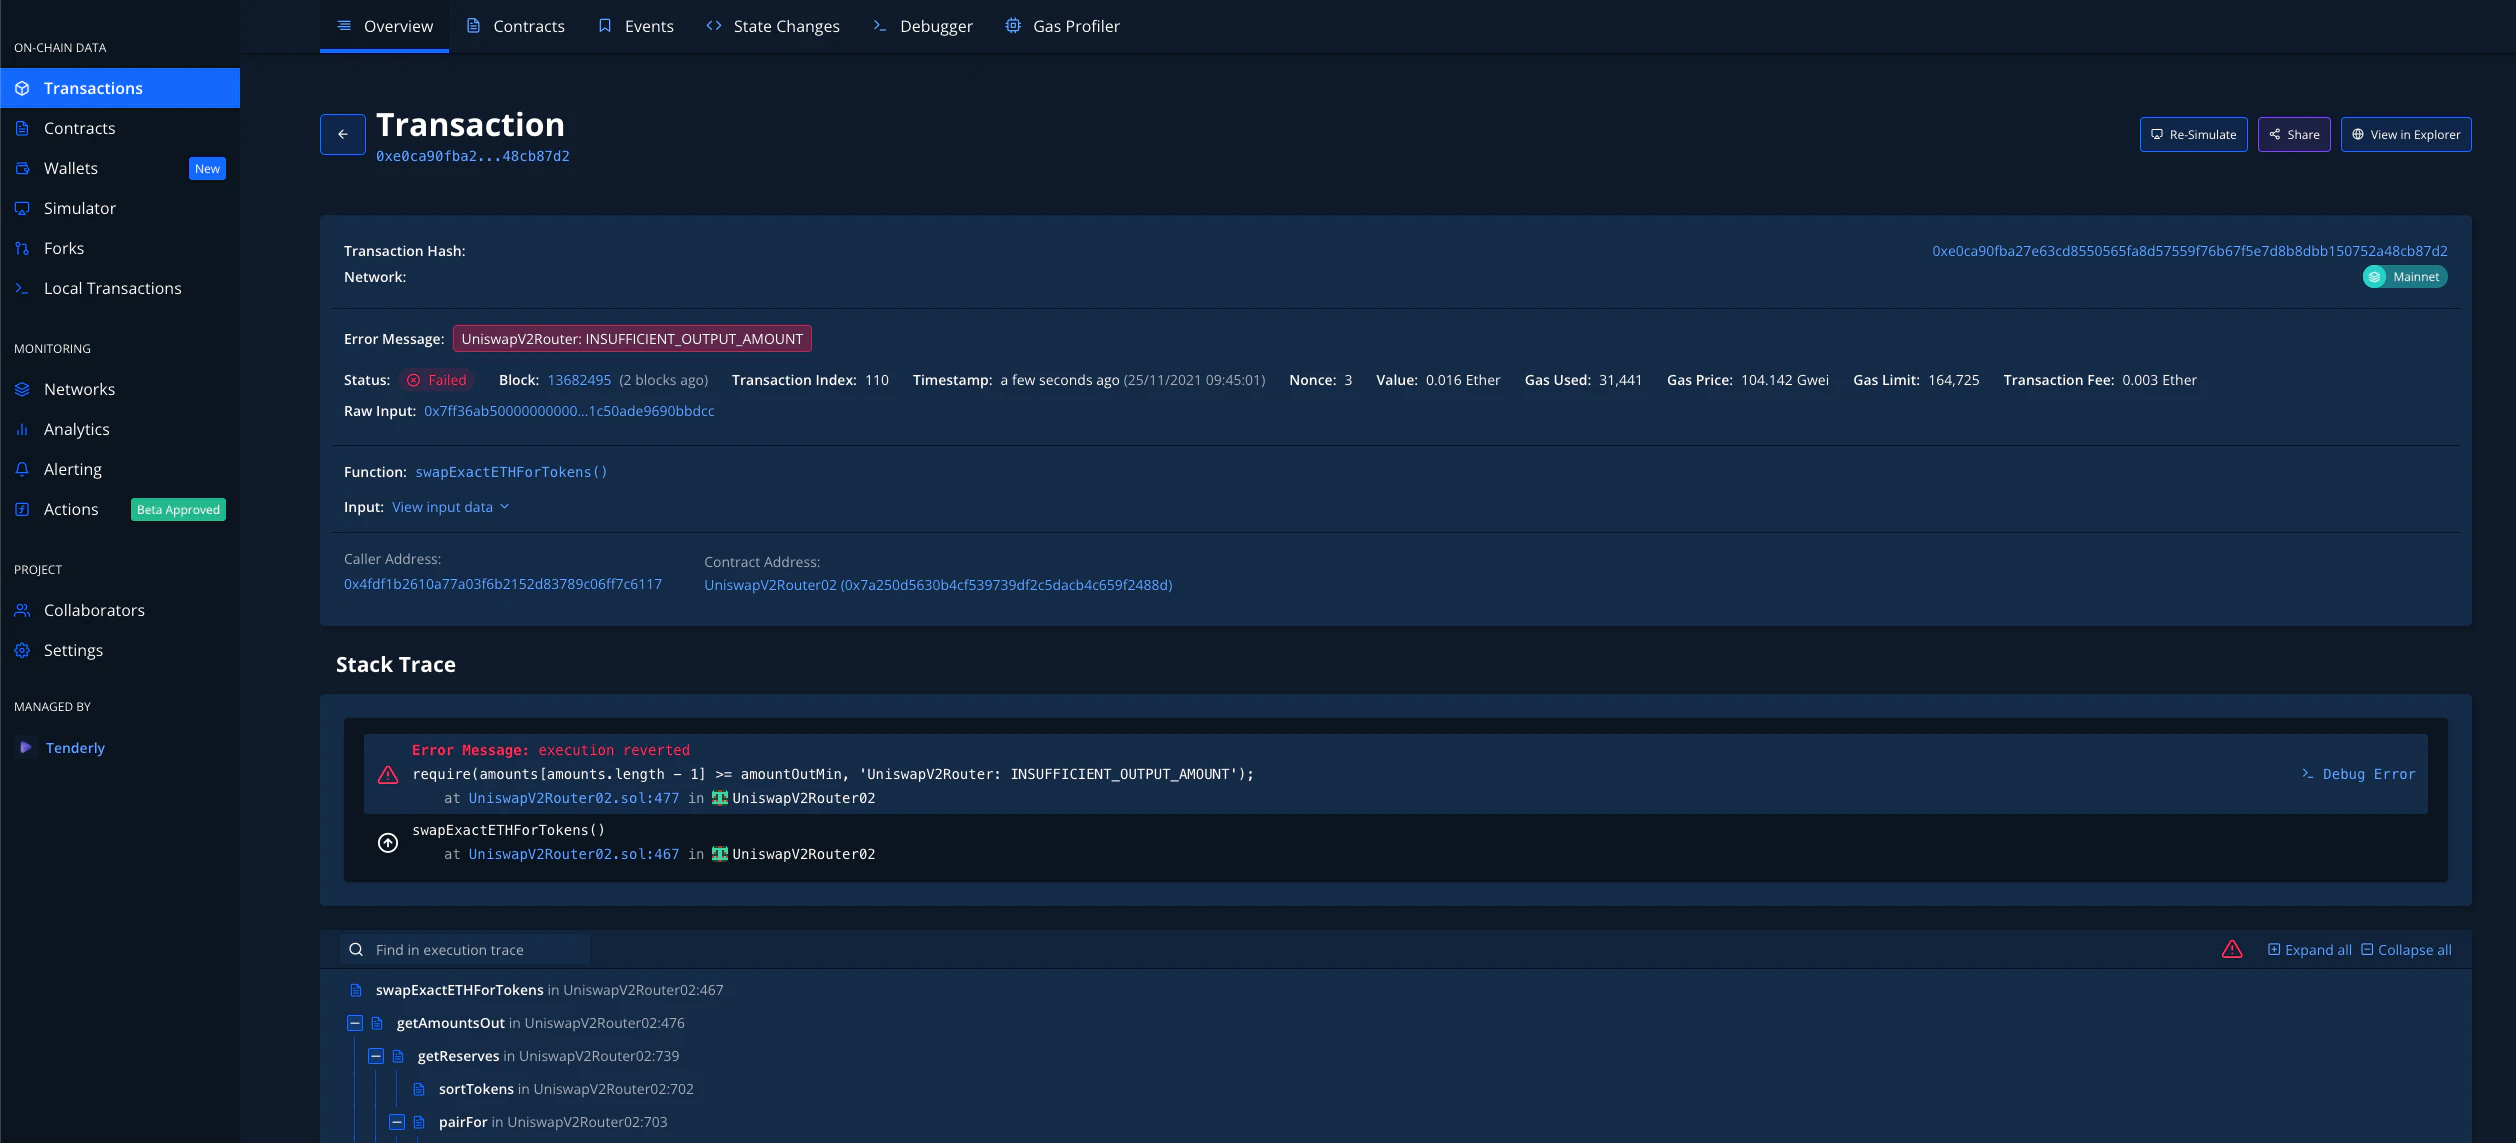 Execution Overview - इसे transaction के समग्र दृश्य के रूप में सोचें। एक नज़र में, आप उन सभी Smart Contracts के सटीक code paths देख सकते हैं जो किसी दिए गए transaction में भाग लेते हैं। आप ऊपर की images से transactions को [**यहाँ (successful)**](https://dashboard.tenderly.co/tx/mainnet/0x1ca07994d823e4198d7517d828d99e2064f3204501284d5348ca8c11e3be53d8) और [**यहाँ (failed)**](https://dashboard.tenderly.co/tx/mainnet/0xe0ca90fba27e63cd8550565fa8d57559f76b67f5e7d8b8dbb150752a48cb87d2) क्लिक करके खोल सकते हैं।
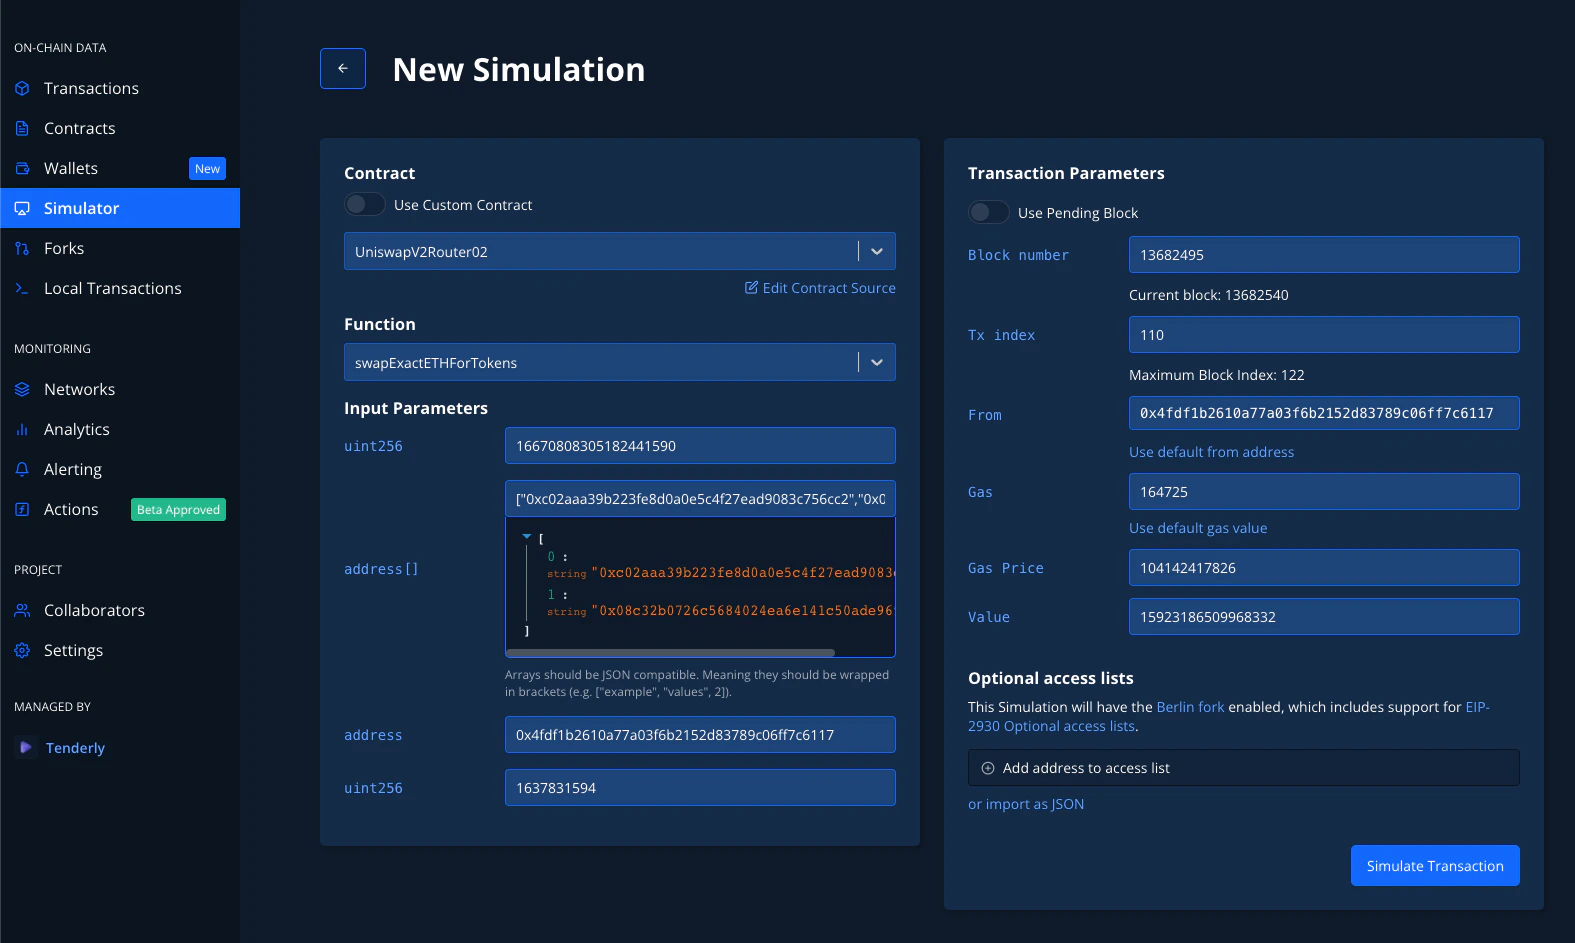
पहले tab में - **Transaction Overview** - आप transaction के सभी elements को देख और navigate कर सकते हैं। इसके अलावा, आप ऊपर दाईं ओर बटन पर क्लिक करके, विभिन्न parameters का उपयोग करके, या यहाँ तक कि परिणाम का निरीक्षण करने के लिए source code बदलकर तुरंत transaction को (Re)Simulate कर सकते हैं - [**Simulations के बारे में यहाँ और पढ़ें**](/simulator-ui/overview)।
Execution Overview - इसे transaction के समग्र दृश्य के रूप में सोचें। एक नज़र में, आप उन सभी Smart Contracts के सटीक code paths देख सकते हैं जो किसी दिए गए transaction में भाग लेते हैं। आप ऊपर की images से transactions को [**यहाँ (successful)**](https://dashboard.tenderly.co/tx/mainnet/0x1ca07994d823e4198d7517d828d99e2064f3204501284d5348ca8c11e3be53d8) और [**यहाँ (failed)**](https://dashboard.tenderly.co/tx/mainnet/0xe0ca90fba27e63cd8550565fa8d57559f76b67f5e7d8b8dbb150752a48cb87d2) क्लिक करके खोल सकते हैं।
पहले tab में - **Transaction Overview** - आप transaction के सभी elements को देख और navigate कर सकते हैं। इसके अलावा, आप ऊपर दाईं ओर बटन पर क्लिक करके, विभिन्न parameters का उपयोग करके, या यहाँ तक कि परिणाम का निरीक्षण करने के लिए source code बदलकर तुरंत transaction को (Re)Simulate कर सकते हैं - [**Simulations के बारे में यहाँ और पढ़ें**](/simulator-ui/overview)।
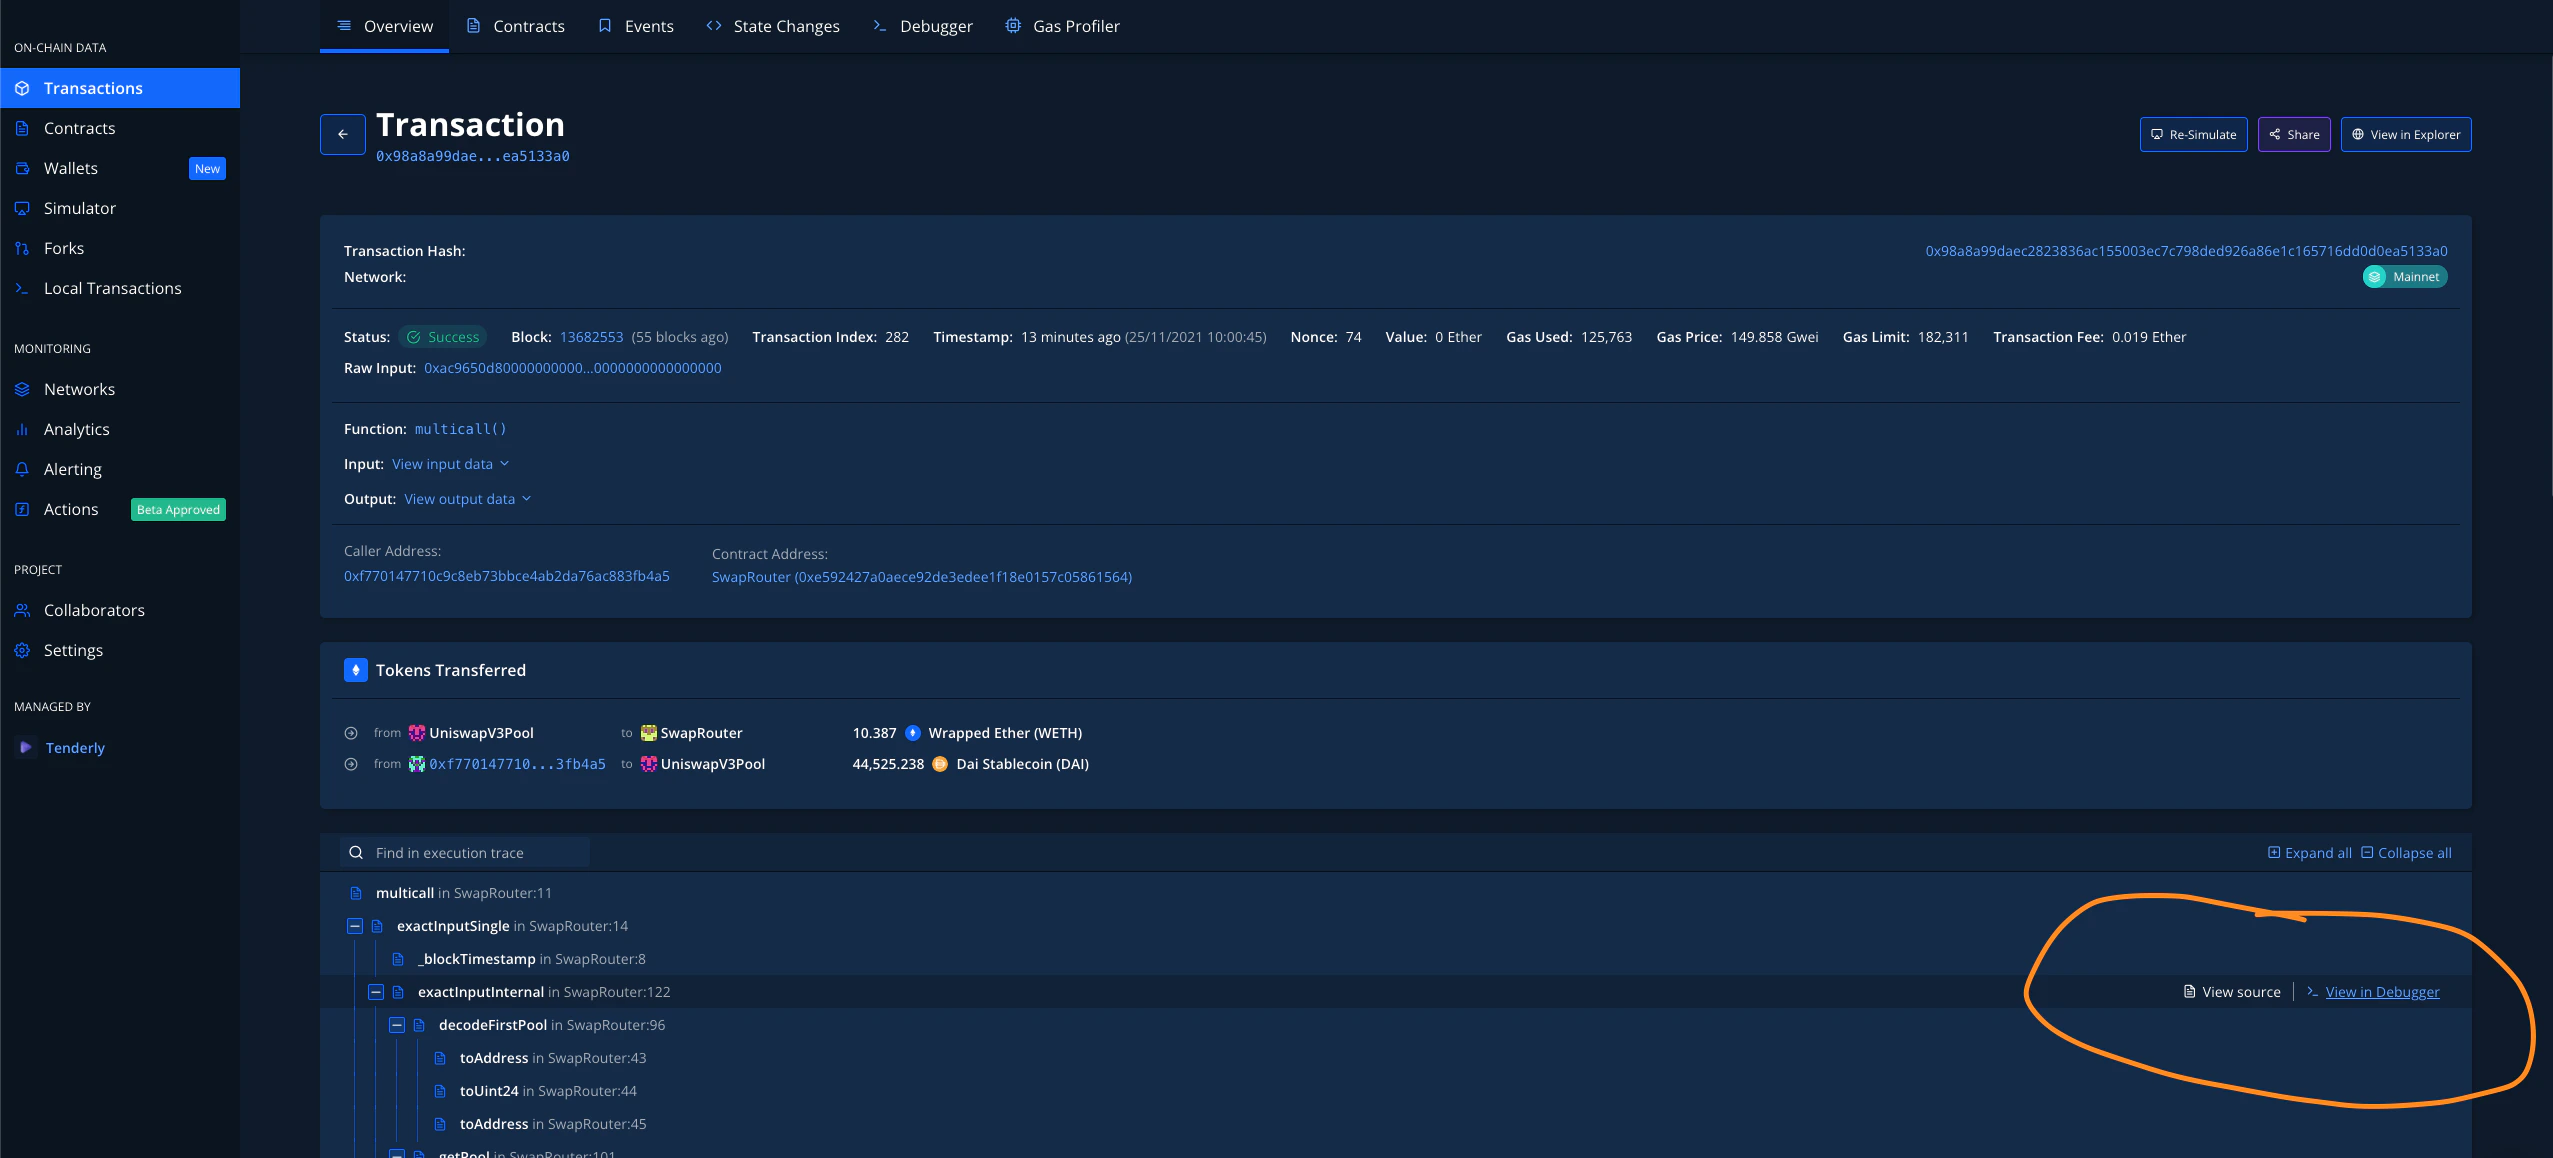
 Overview Tab tab से, आप तुरंत Contract Sources या Debugger में कूद सकते हैं यह देखने के लिए कि क्या हुआ:
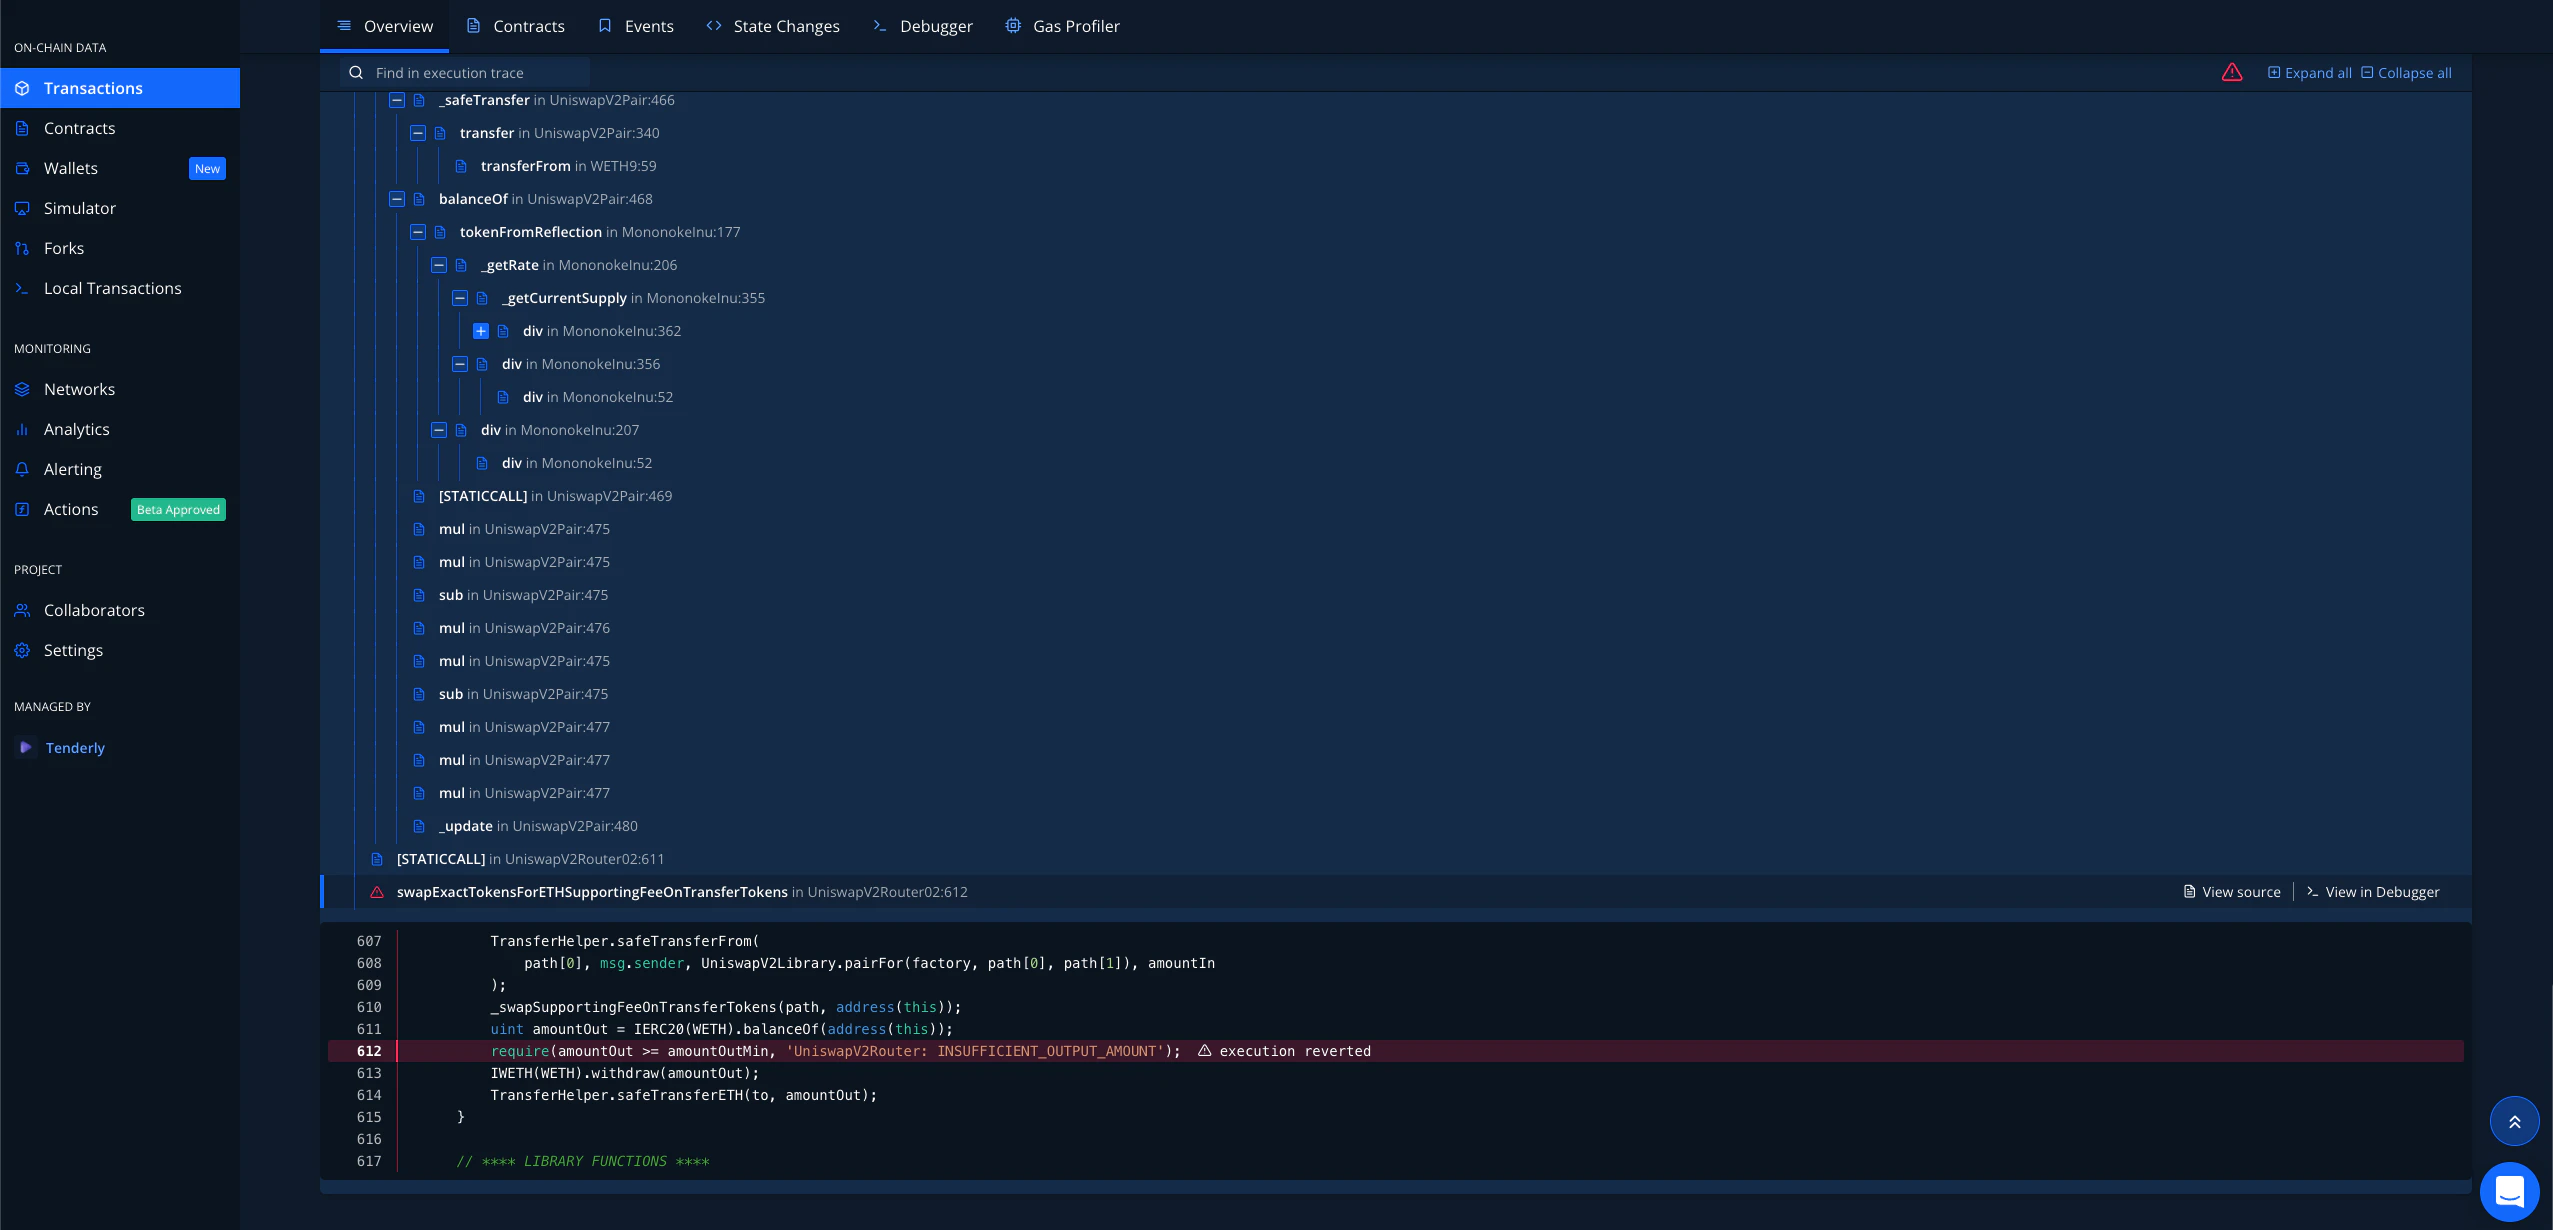
 यदि आप किसी विफल transaction को देख रहे हैं, तो अब आप **लाल warning आइकन पर क्लिक करके और फिर उस line पर क्लिक करके सीधे सभी fail points पर कूद सकते हैं जो विफल हुई**:
.webp?fit=max&auto=format&n=XsEZlaGXYskrtN68&q=85&s=556893b48138dd1e6381df0c638afcbf)
 आप Execution Trace को search भी कर सकते हैं, साथ ही अपने keyboard arrows के साथ इसे आसानी से navigate कर सकते हैं:
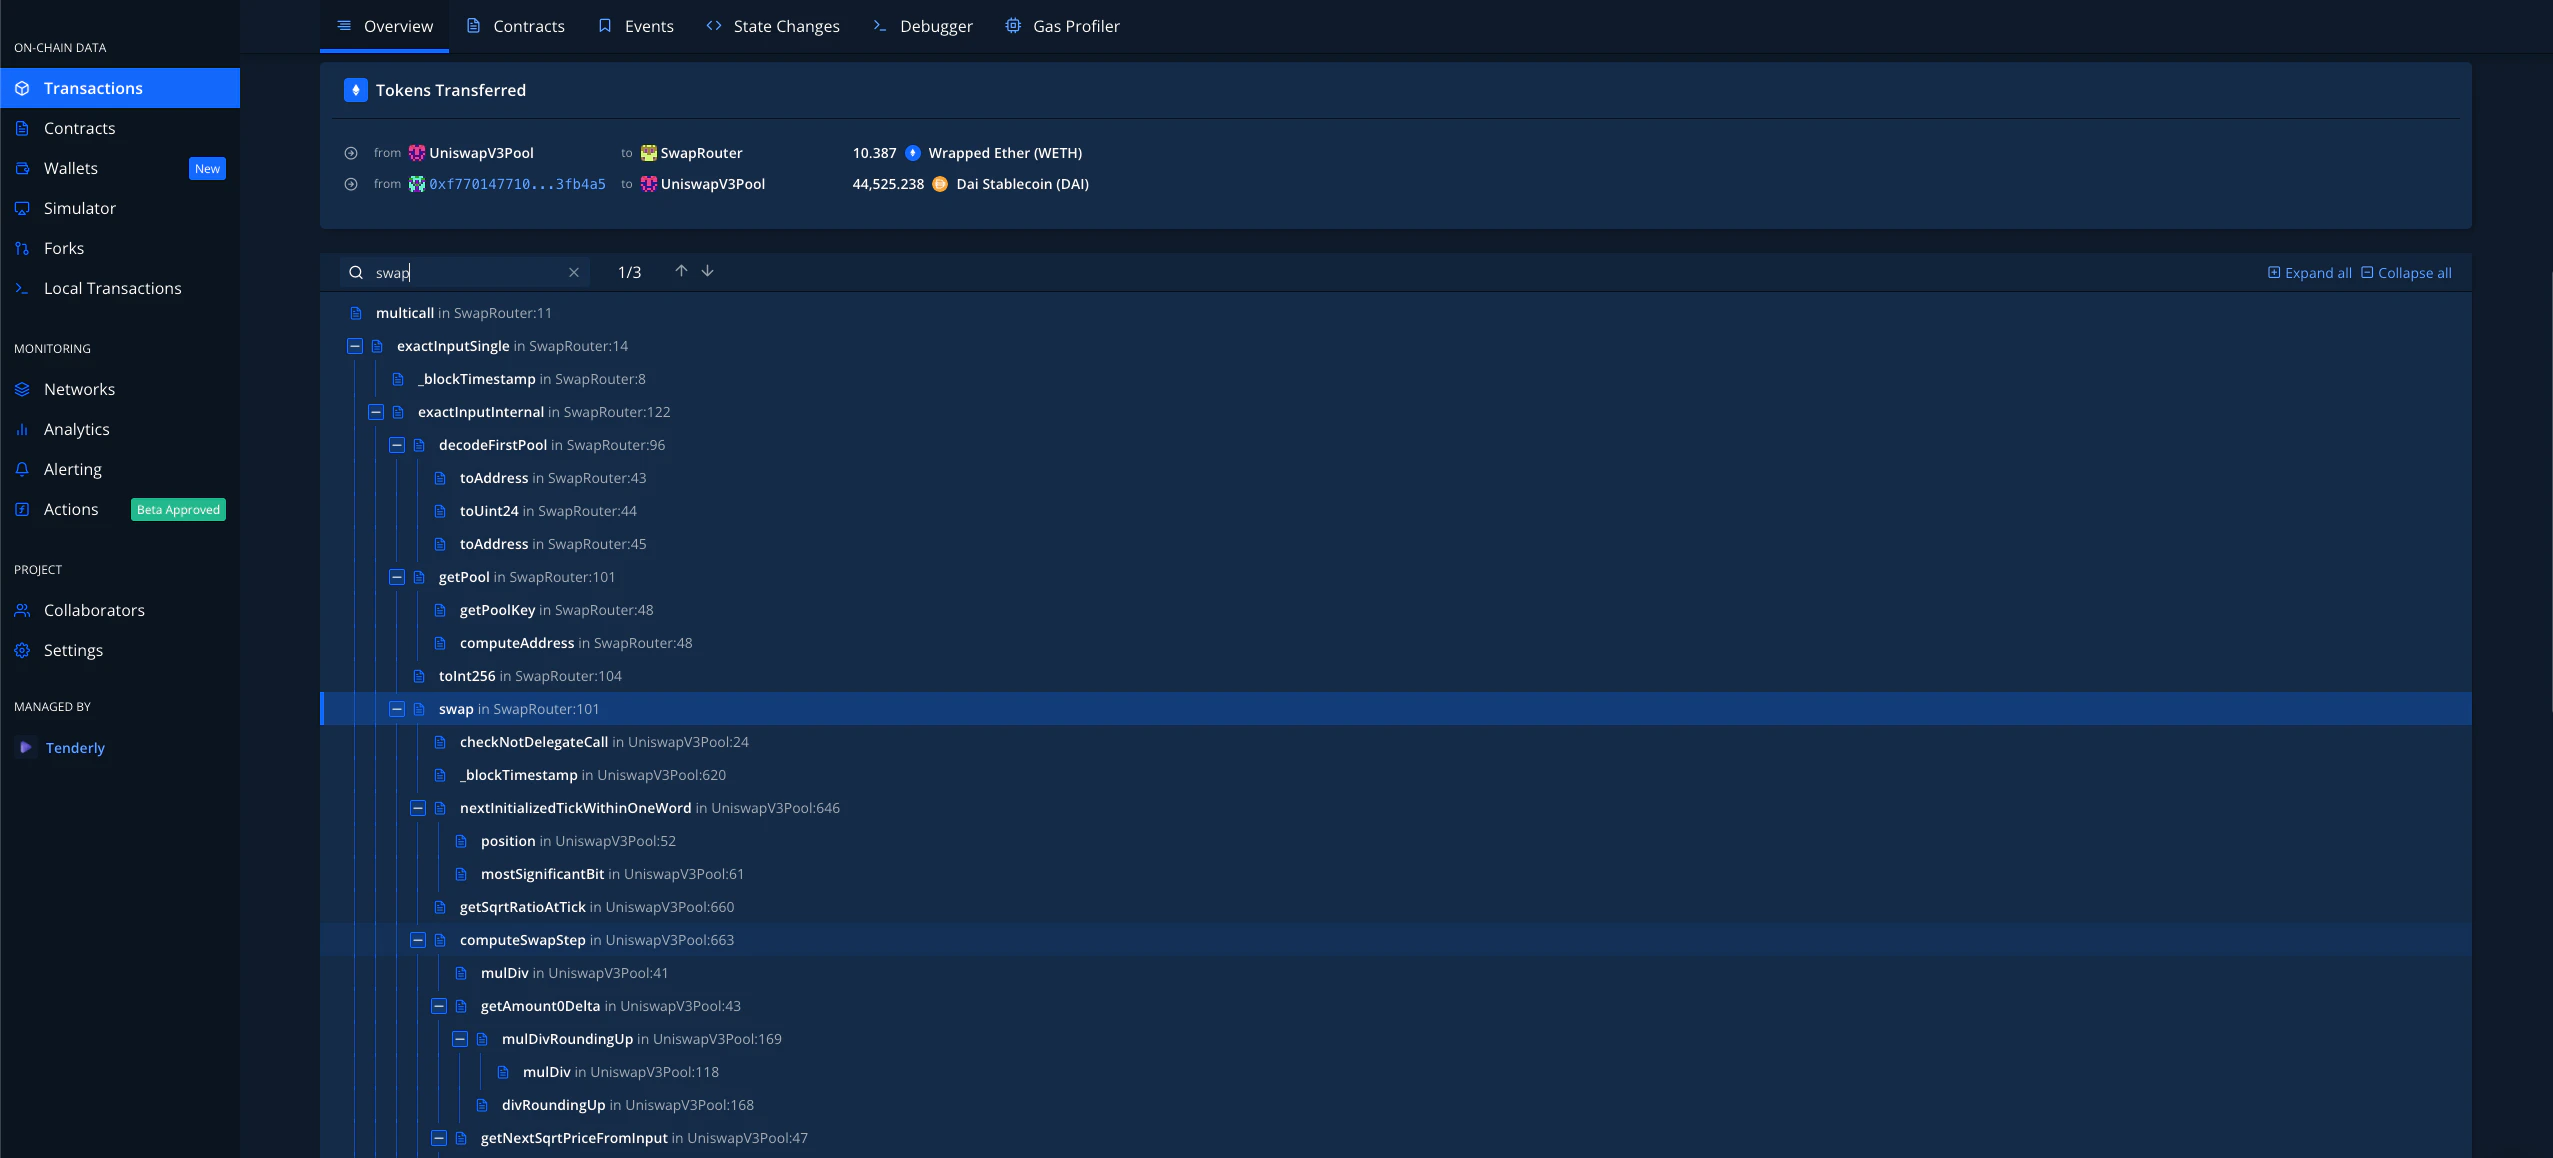
.gif?s=a0d62baa5fb34537882b14b439bfef4d) ### Call और Function Trace
Execution Trace section में, आपको search field के ठीक बगल में एक dropdown menu मिलेगा। डिफ़ॉल्ट रूप से, यह **Function Trace** पर सेट होता है, जिसका अर्थ है कि यह इस transaction में हुई सभी external और internal calls दिखाएगा।
### Call और Function Trace
Execution Trace section में, आपको search field के ठीक बगल में एक dropdown menu मिलेगा। डिफ़ॉल्ट रूप से, यह **Function Trace** पर सेट होता है, जिसका अर्थ है कि यह इस transaction में हुई सभी external और internal calls दिखाएगा।
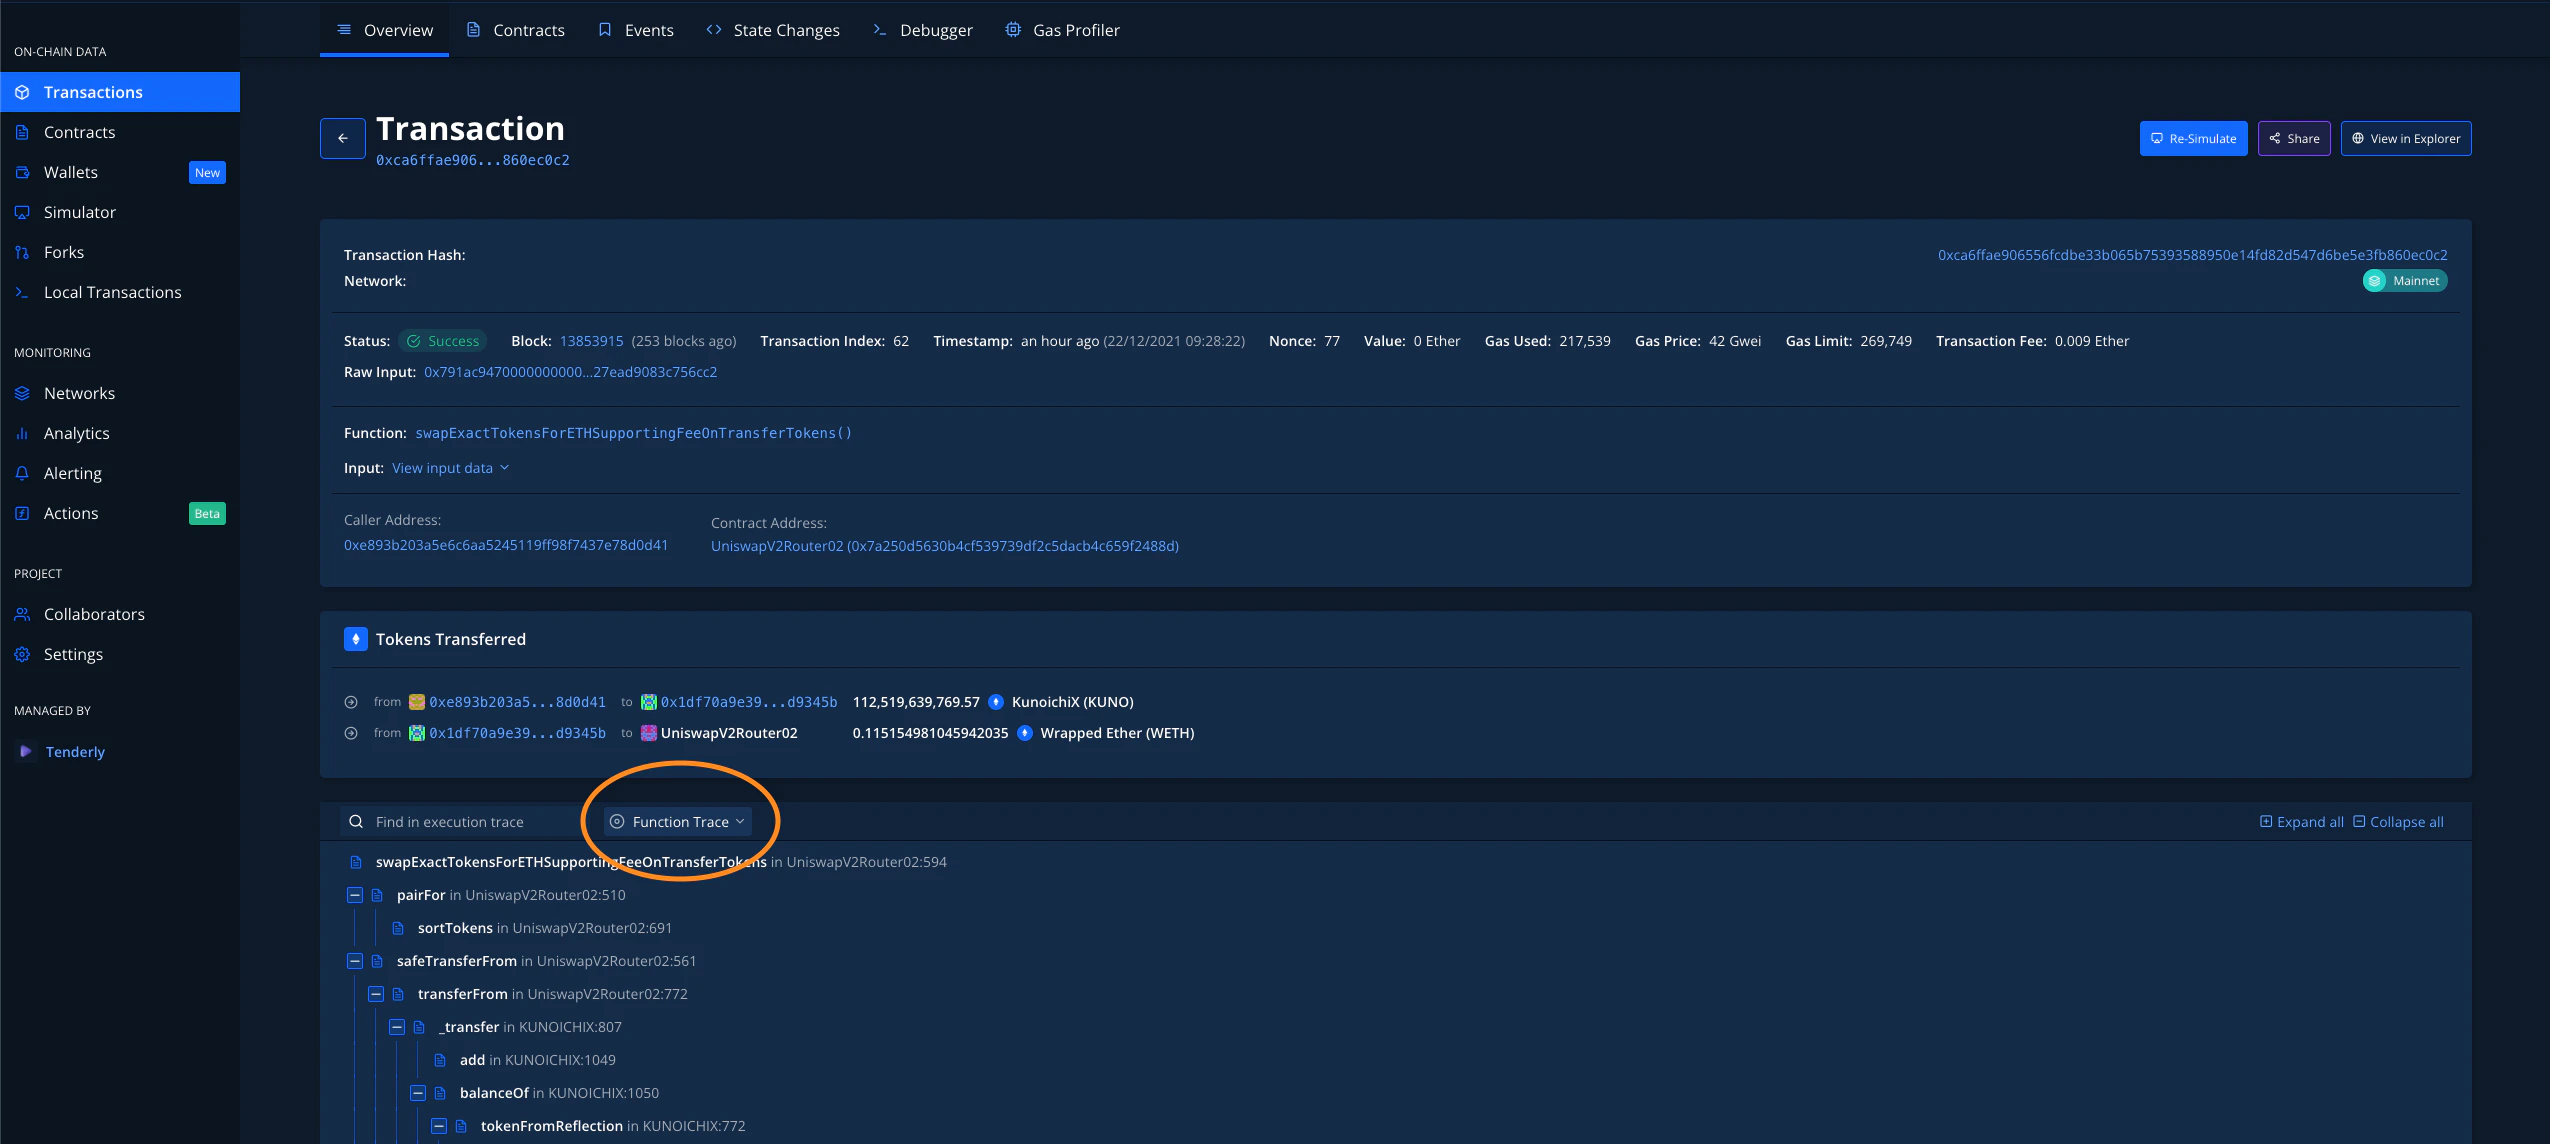 Key calls के बेहतर अवलोकन के लिए, इसे **Call Trace** पर switch करें, जो केवल transaction में हुई external calls दिखाता है।
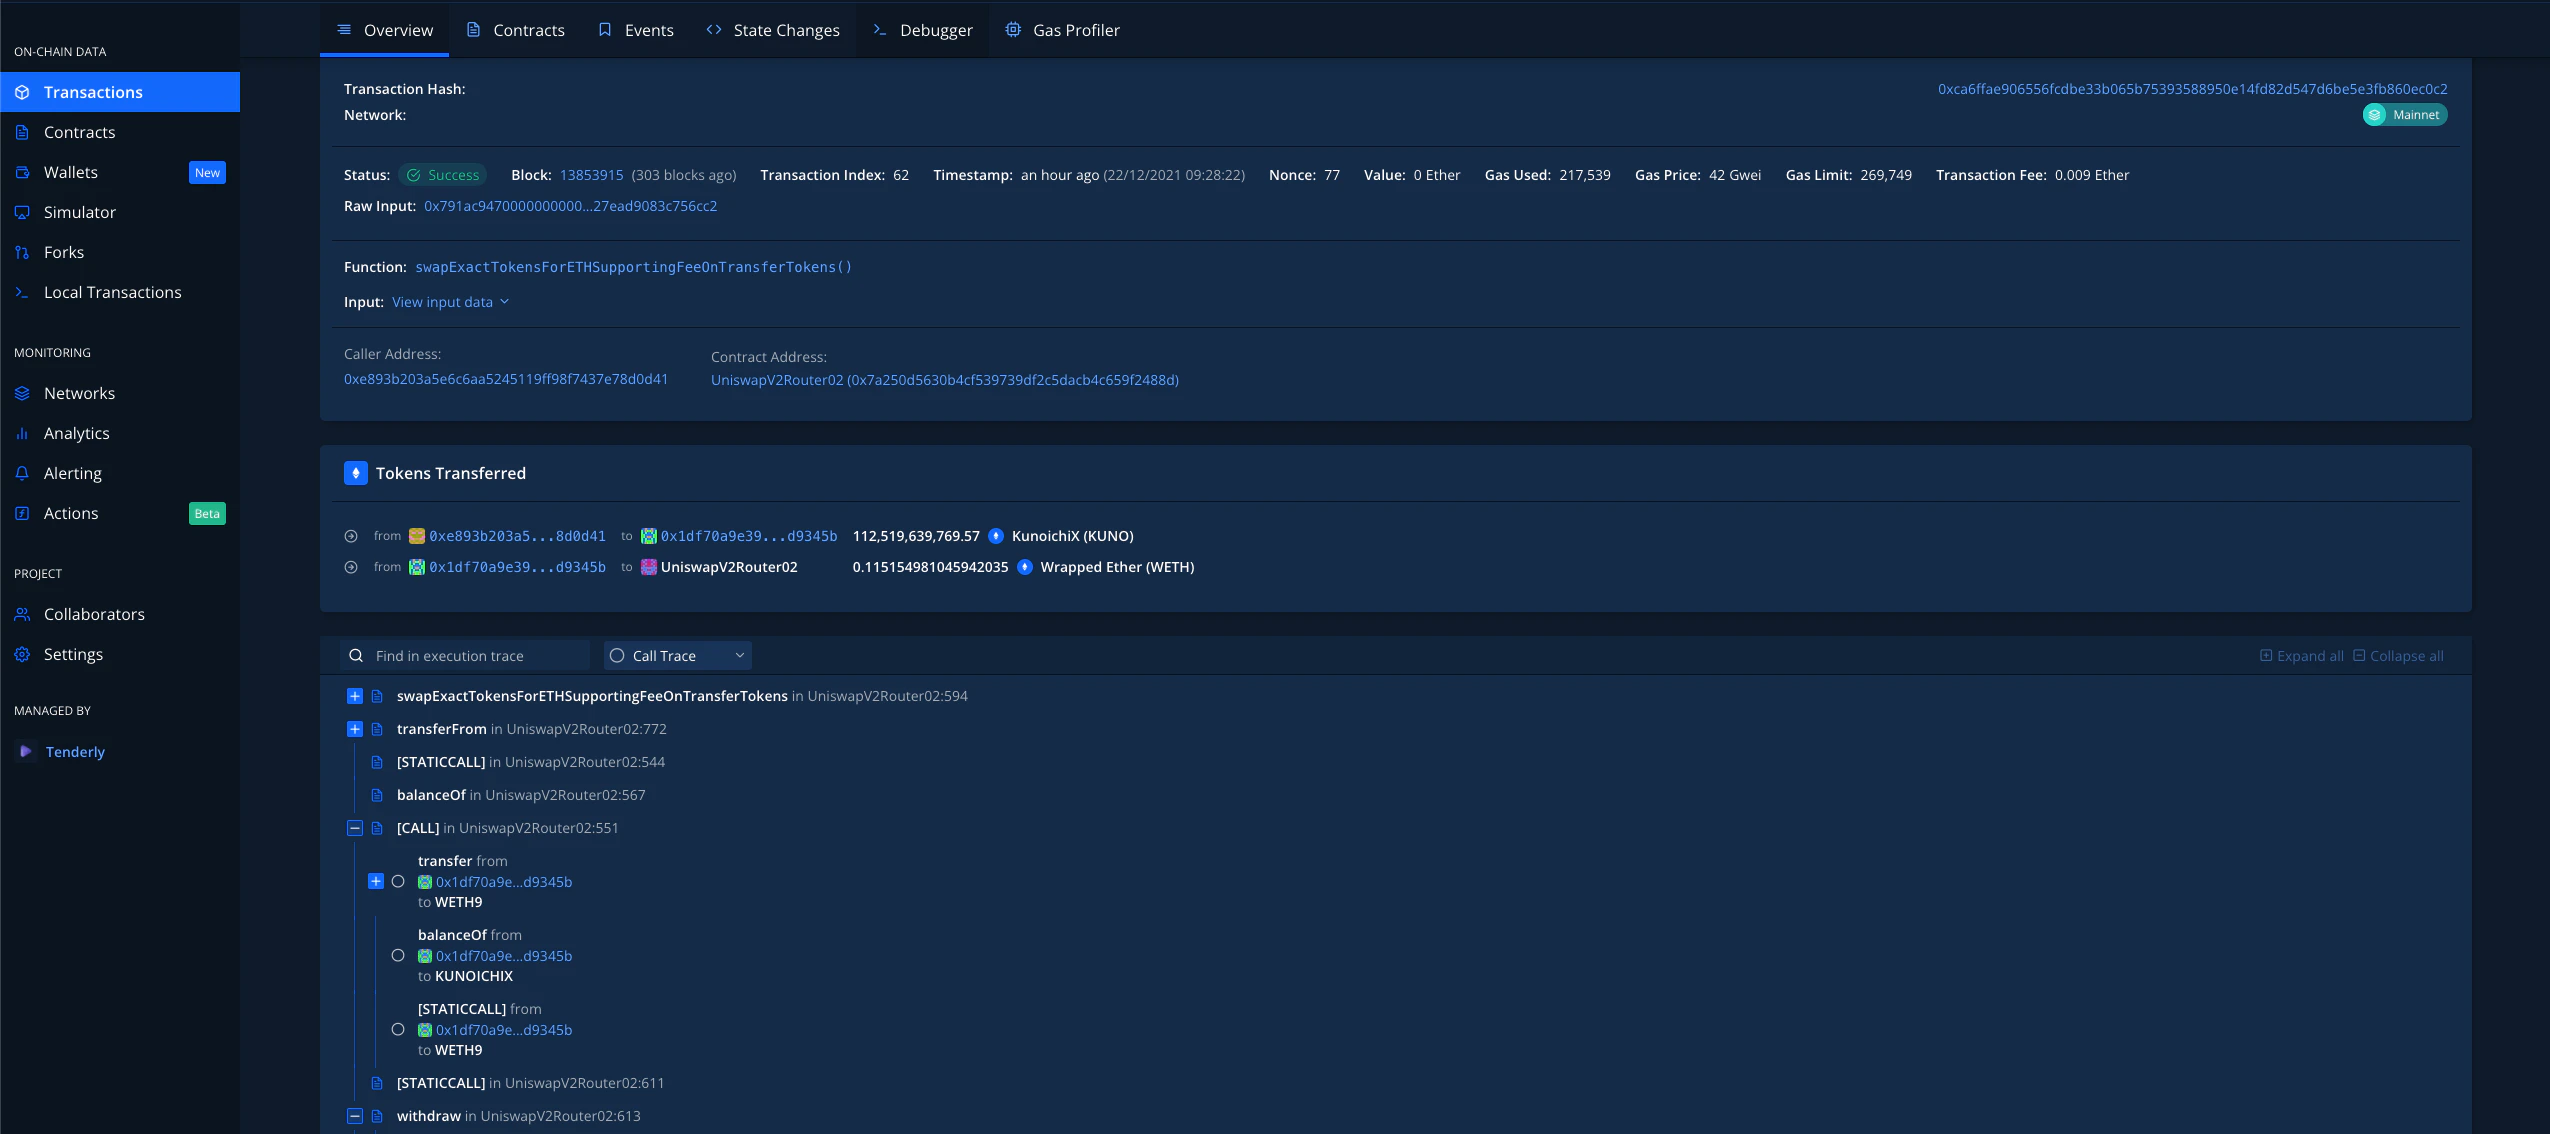 आप **किसी भी trace पर comment और priority दे सकते हैं**, या तो अपने लिए या प्रोजेक्ट में
collaboration को आसान बनाने के लिए। आप इसके बारे में [**यहाँ अधिक पढ़ सकते हैं**](/debugger/commenting)।
यह feature [**Debugger**](/debugger/overview) में भी उपलब्ध है। अब, मान लीजिए कि आप वास्तव में अपने (या किसी अन्य के) Transaction में गहराई से खुदाई करना चाहते हैं। आइए उपलब्ध प्रत्येक tabs से गुज़रें।
### Contracts
जब आप **Transaction Overview** tab में होते हैं, ऊपरी navigation में, आप **Contracts** (या **Addresses**) पर क्लिक कर सकते हैं ताकि किसी विशेष transaction में शामिल सभी contracts देख सकें:
आप **किसी भी trace पर comment और priority दे सकते हैं**, या तो अपने लिए या प्रोजेक्ट में
collaboration को आसान बनाने के लिए। आप इसके बारे में [**यहाँ अधिक पढ़ सकते हैं**](/debugger/commenting)।
यह feature [**Debugger**](/debugger/overview) में भी उपलब्ध है। अब, मान लीजिए कि आप वास्तव में अपने (या किसी अन्य के) Transaction में गहराई से खुदाई करना चाहते हैं। आइए उपलब्ध प्रत्येक tabs से गुज़रें।
### Contracts
जब आप **Transaction Overview** tab में होते हैं, ऊपरी navigation में, आप **Contracts** (या **Addresses**) पर क्लिक कर सकते हैं ताकि किसी विशेष transaction में शामिल सभी contracts देख सकें:
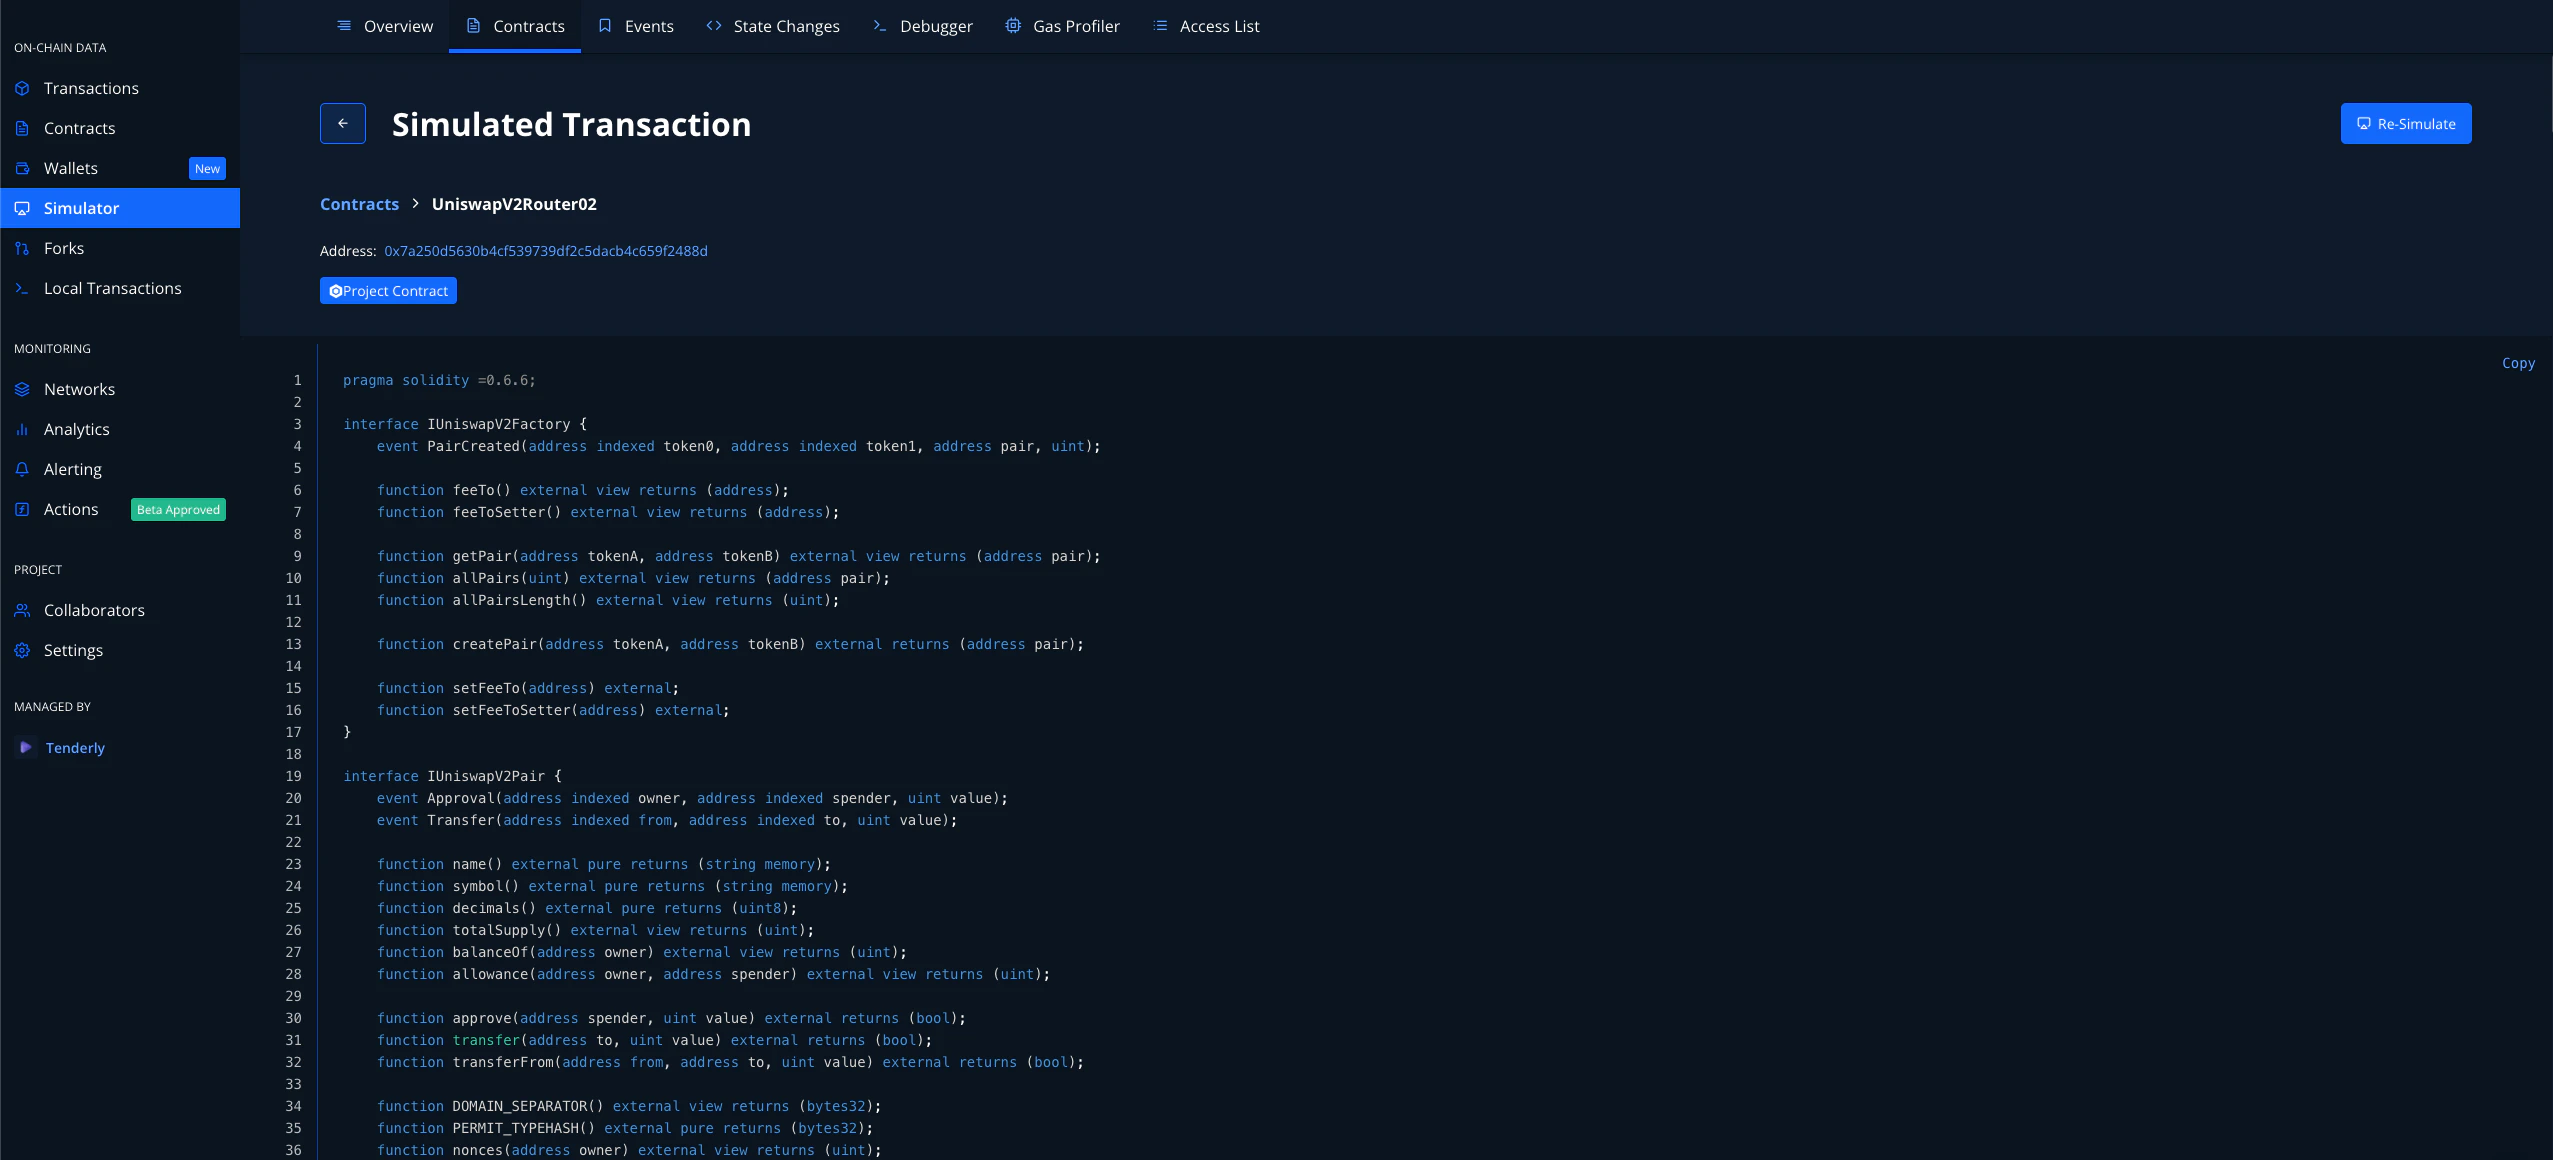
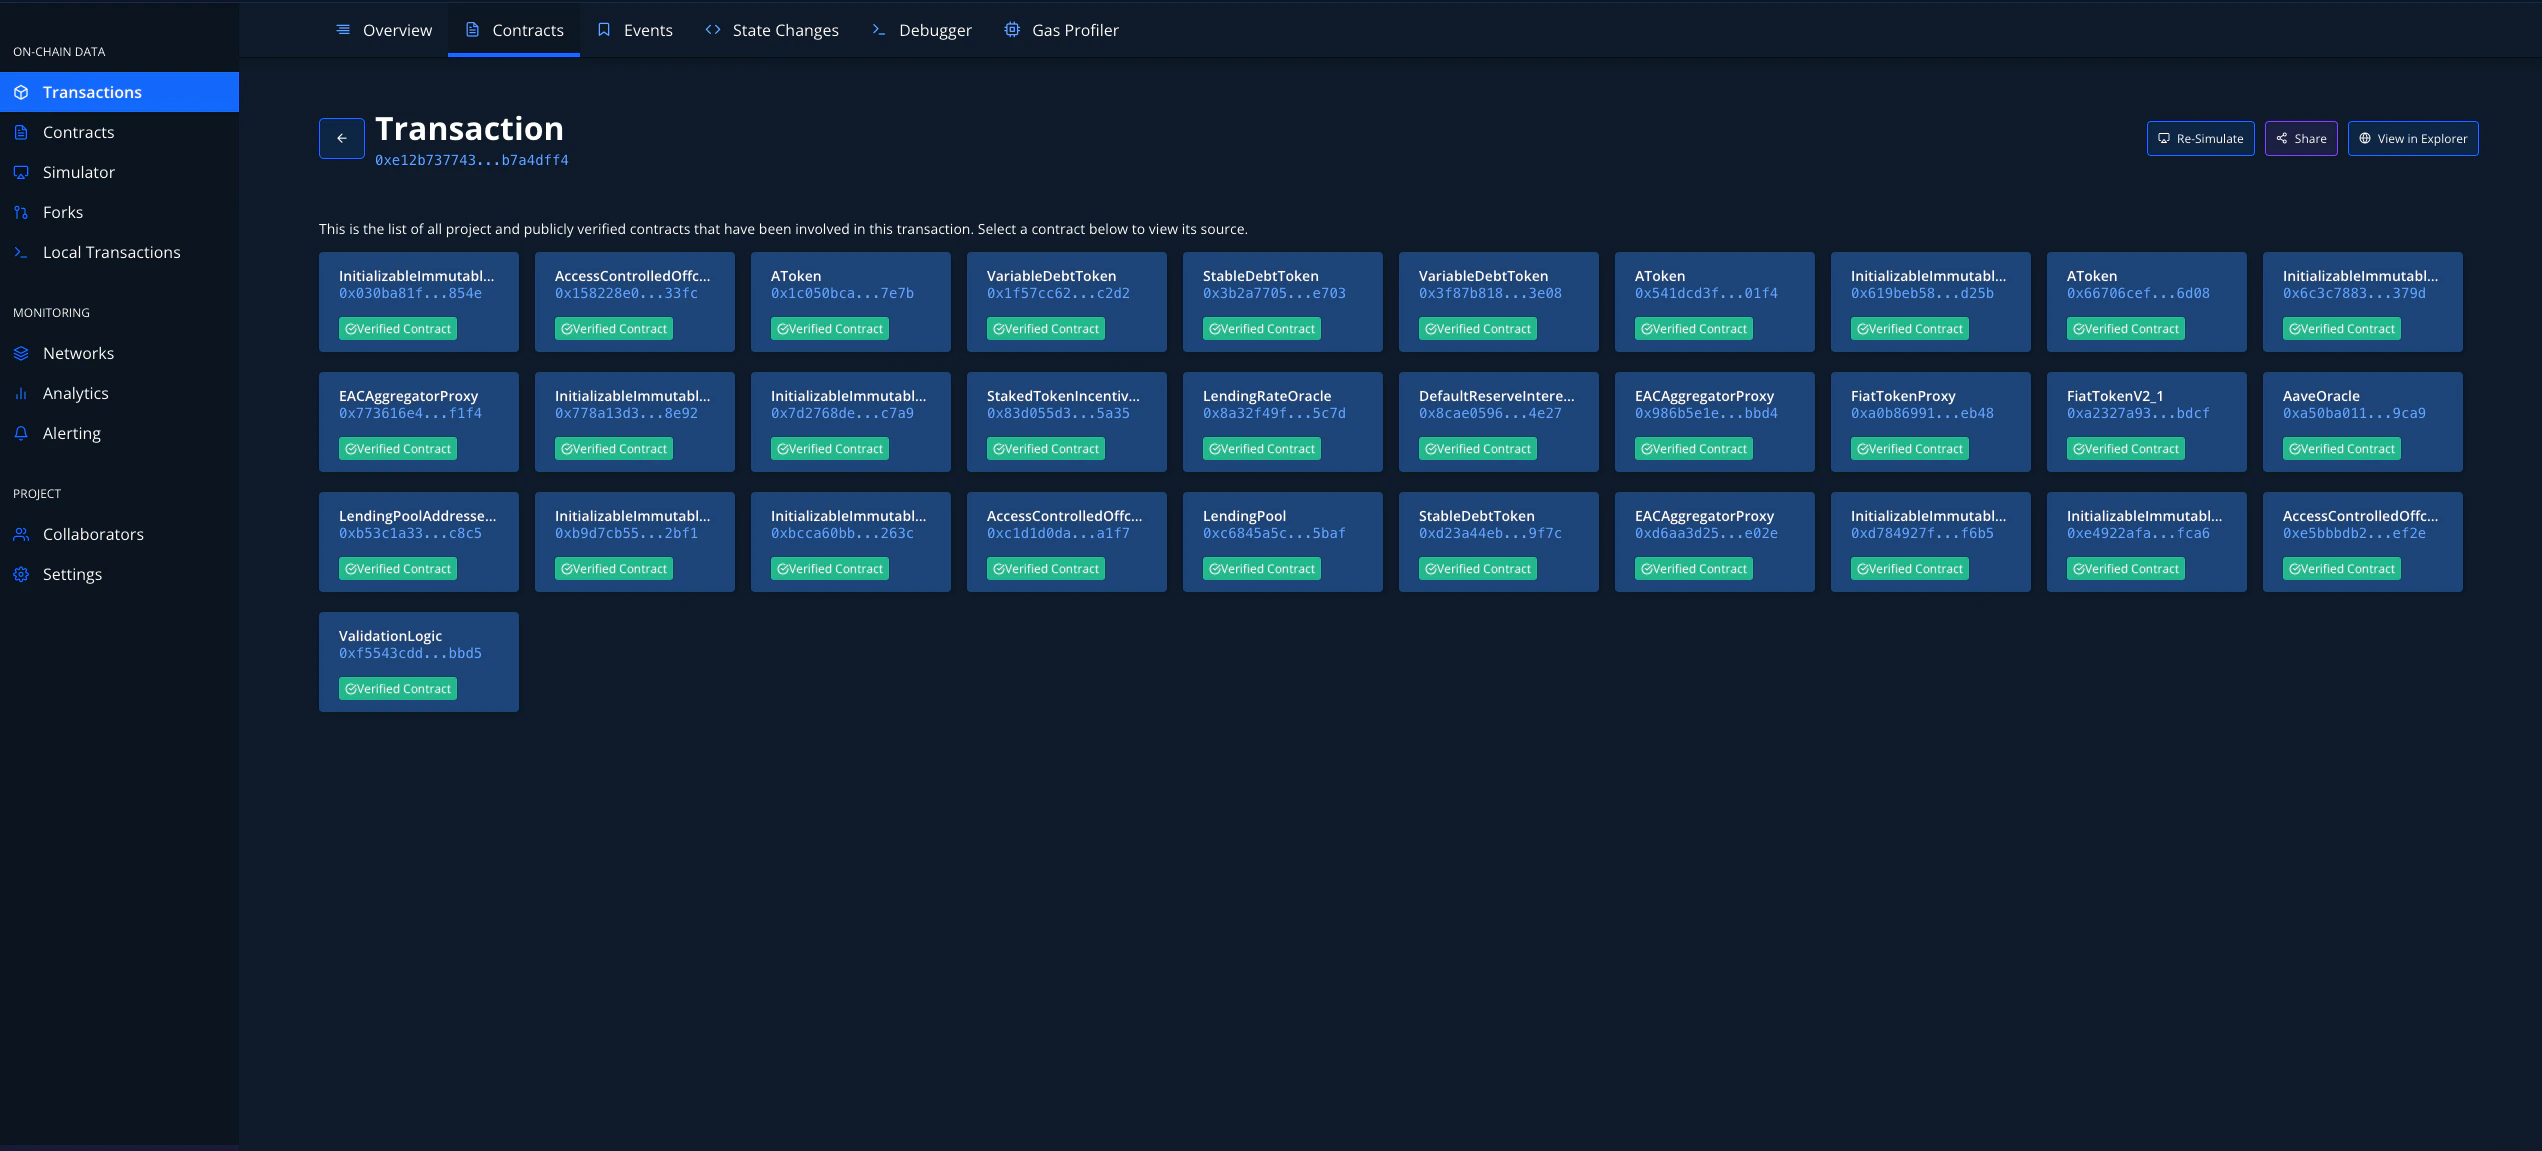 किसी contract पर क्लिक करके, आप इसका सोर्स कोड देख सकते हैं:
 ### Events
Smart Contract Events रुचि रखने वाले पक्षों को यह सूचित करने का de-facto तरीका है कि कुछ event हुई है। Logs में स्वयं उस जानकारी के अलावा मूल्यवान जानकारी भी होती है कि एक विशेष event हुई है।
### Events
Smart Contract Events रुचि रखने वाले पक्षों को यह सूचित करने का de-facto तरीका है कि कुछ event हुई है। Logs में स्वयं उस जानकारी के अलावा मूल्यवान जानकारी भी होती है कि एक विशेष event हुई है।
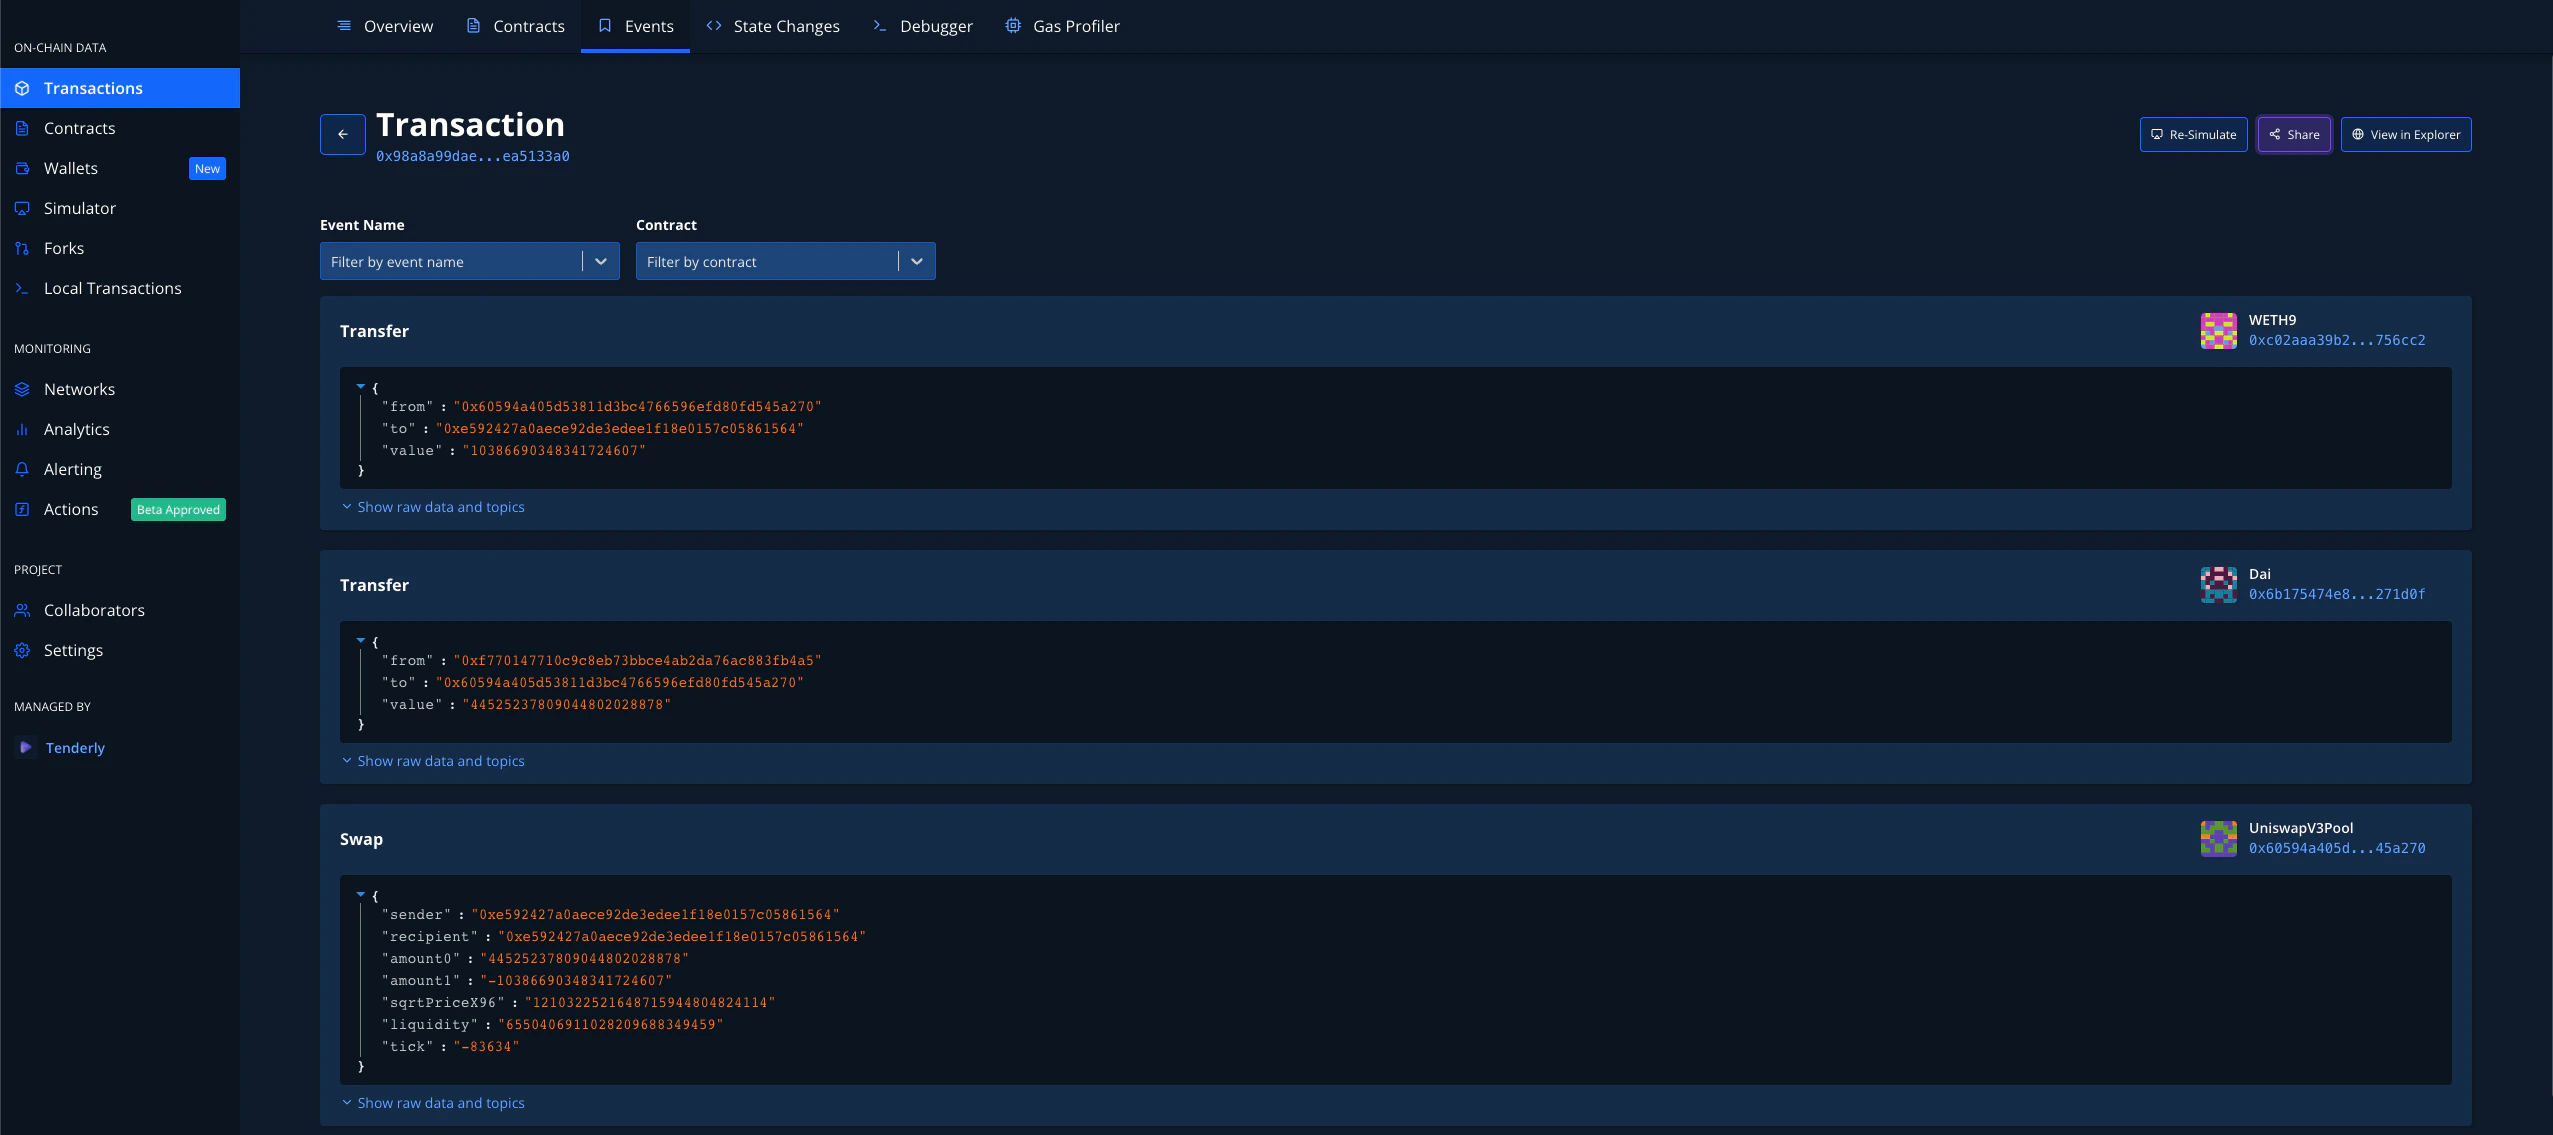 जब हम **Events** tab पर क्लिक करते हैं, तो हम उन सभी Events को देख सकते हैं जो [transaction के दौरान emit हुई थीं](https://dashboard.tenderly.co/tx/mainnet/0x98a8a99daec2823836ac155003ec7c798ded926a86e1c165716dd0d0ea5133a0)। और भी बेहतर बात यह है कि **event parameters पहले से ही decoded हैं और मानव-पठनीय format में दिखाए गए हैं**। hex strings को decode करने में समय बर्बाद करने की आवश्यकता नहीं है यह देखने के लिए कि क्या हुआ। आप Events को Name और Smart Contract के आधार पर filter भी कर सकते हैं।
### State Changes
जैसे-जैसे Smart Contracts अधिक जटिल होते जा रहे हैं, वैसे-वैसे उन smart contracts के states भी अधिक जटिल होते जा रहे हैं।
जब हम **Events** tab पर क्लिक करते हैं, तो हम उन सभी Events को देख सकते हैं जो [transaction के दौरान emit हुई थीं](https://dashboard.tenderly.co/tx/mainnet/0x98a8a99daec2823836ac155003ec7c798ded926a86e1c165716dd0d0ea5133a0)। और भी बेहतर बात यह है कि **event parameters पहले से ही decoded हैं और मानव-पठनीय format में दिखाए गए हैं**। hex strings को decode करने में समय बर्बाद करने की आवश्यकता नहीं है यह देखने के लिए कि क्या हुआ। आप Events को Name और Smart Contract के आधार पर filter भी कर सकते हैं।
### State Changes
जैसे-जैसे Smart Contracts अधिक जटिल होते जा रहे हैं, वैसे-वैसे उन smart contracts के states भी अधिक जटिल होते जा रहे हैं।
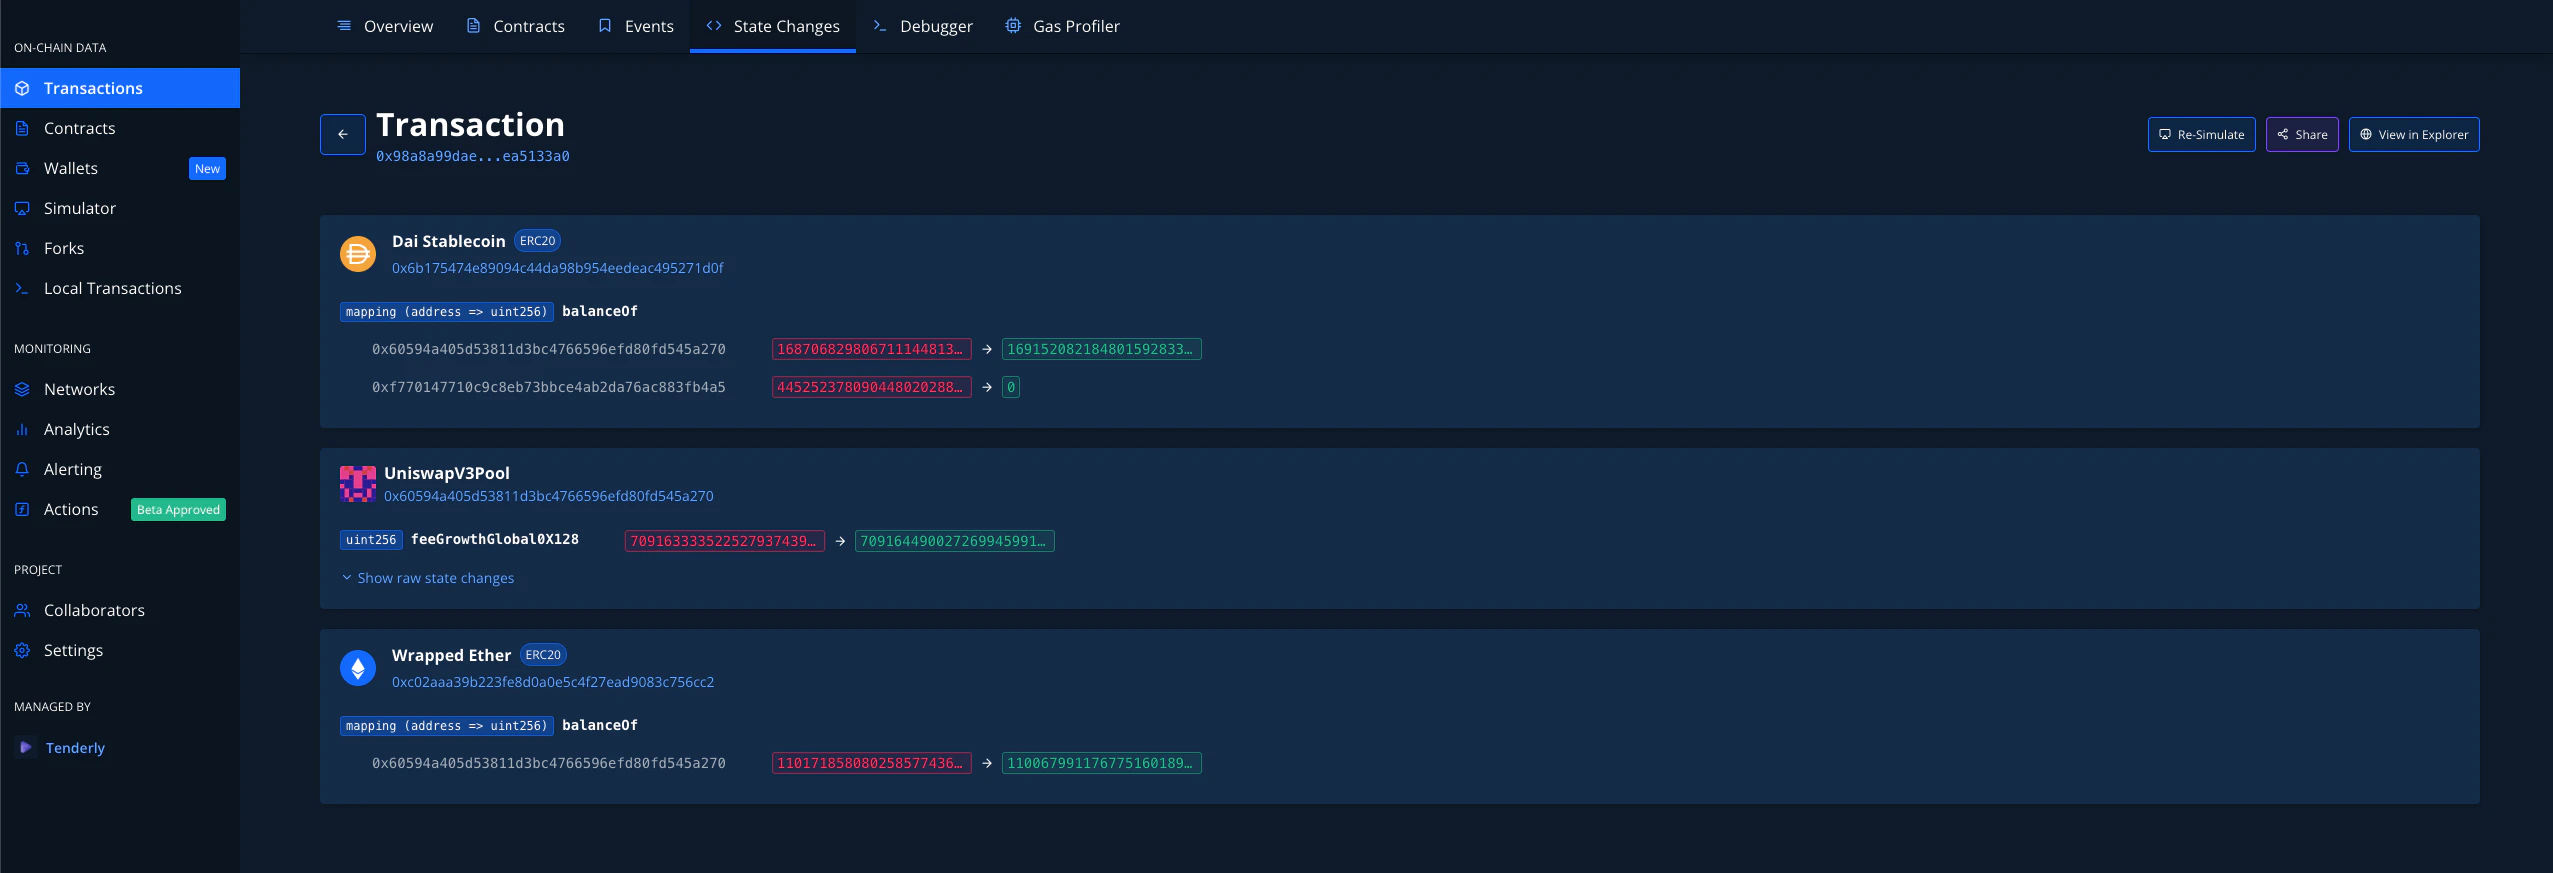 यहाँ हम देखते हैं कि Tenderly न केवल उन state variables को दिखाता है जो बदले गए थे, बल्कि **आपकी सुविधा के लिए ये सभी decoded हैं**। **और हाँ, structures भी सही तरीके से decoded होते हैं**।
आप उस transaction और उसकी जटिलताओं को [यहाँ](https://dashboard.tenderly.co/tx/mainnet/0x98a8a99daec2823836ac155003ec7c798ded926a86e1c165716dd0d0ea5133a0) देख सकते हैं।
### Debugger
Stack traces को Debug करना किसी भी developer के workflow का एक महत्वपूर्ण हिस्सा है, स्थानीय रूप से और production में। **Debugger** tab पर क्लिक करके, आप अपने (या किसी अन्य) transaction के साथ जो कुछ भी हुआ उसमें गहराई से डुबकी लगा सकेंगे।
यहाँ हम देखते हैं कि Tenderly न केवल उन state variables को दिखाता है जो बदले गए थे, बल्कि **आपकी सुविधा के लिए ये सभी decoded हैं**। **और हाँ, structures भी सही तरीके से decoded होते हैं**।
आप उस transaction और उसकी जटिलताओं को [यहाँ](https://dashboard.tenderly.co/tx/mainnet/0x98a8a99daec2823836ac155003ec7c798ded926a86e1c165716dd0d0ea5133a0) देख सकते हैं।
### Debugger
Stack traces को Debug करना किसी भी developer के workflow का एक महत्वपूर्ण हिस्सा है, स्थानीय रूप से और production में। **Debugger** tab पर क्लिक करके, आप अपने (या किसी अन्य) transaction के साथ जो कुछ भी हुआ उसमें गहराई से डुबकी लगा सकेंगे।
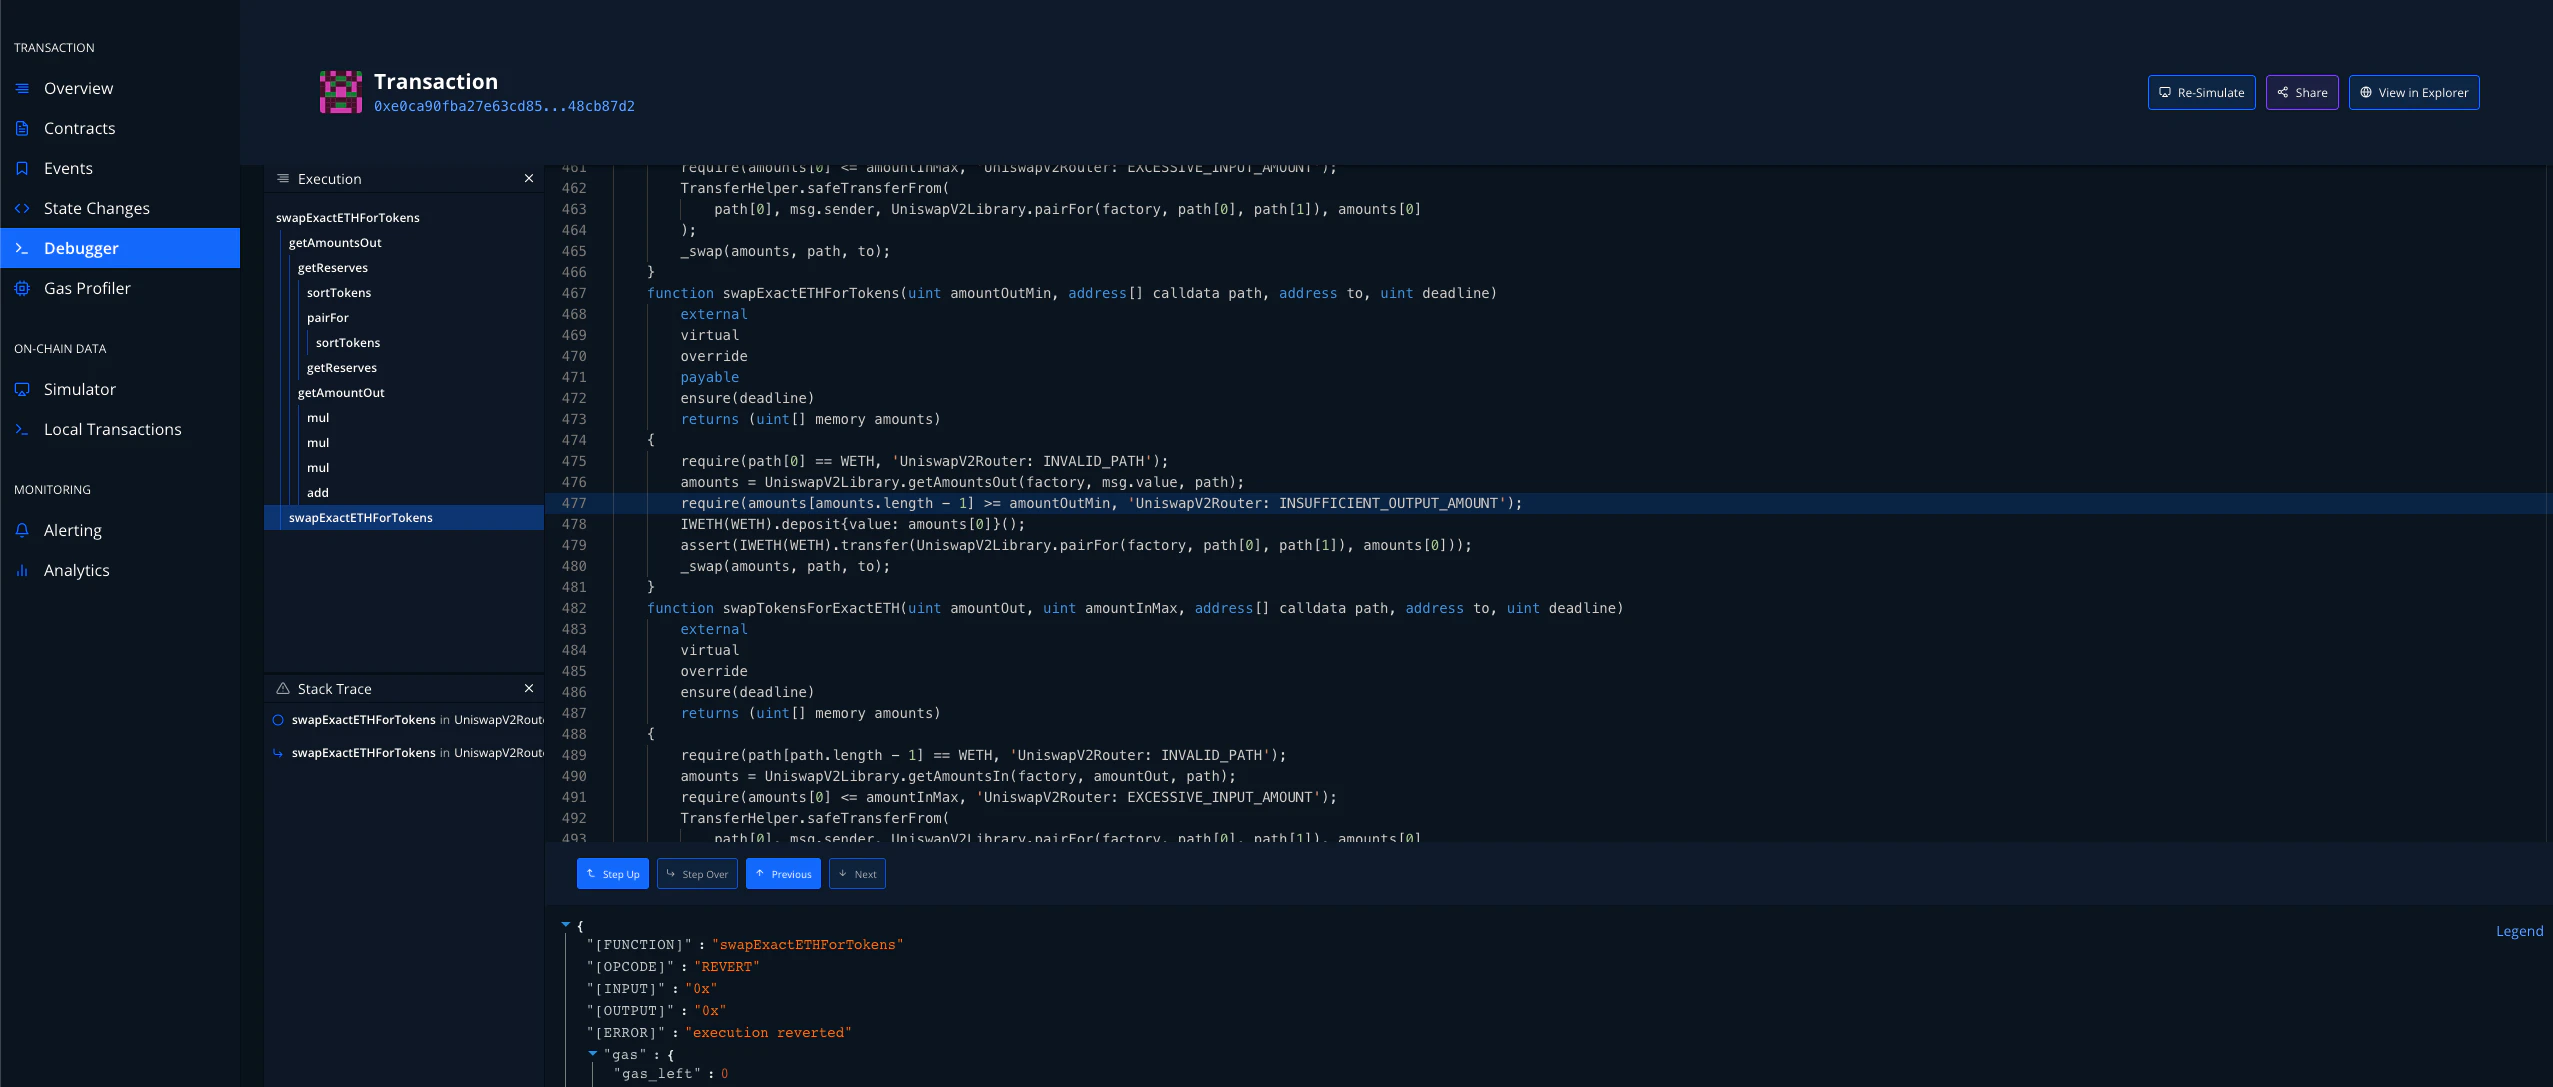 **ऊपर दिखाया गया stack trace code की सटीक line दिखाता है जहाँ transaction विफल हुई**। वहाँ से, आप **Debug Error** पर क्लिक कर सकते हैं और तुरंत issue ढूँढ सकते हैं। देखें [**Tenderly Debugger का उपयोग कैसे करें**](/debugger/overview) और [**विफल transactions की जाँच**](/debugger/overview) करें!
### Gas Profiler
**ऊपर दिखाया गया stack trace code की सटीक line दिखाता है जहाँ transaction विफल हुई**। वहाँ से, आप **Debug Error** पर क्लिक कर सकते हैं और तुरंत issue ढूँढ सकते हैं। देखें [**Tenderly Debugger का उपयोग कैसे करें**](/debugger/overview) और [**विफल transactions की जाँच**](/debugger/overview) करें!
### Gas Profiler
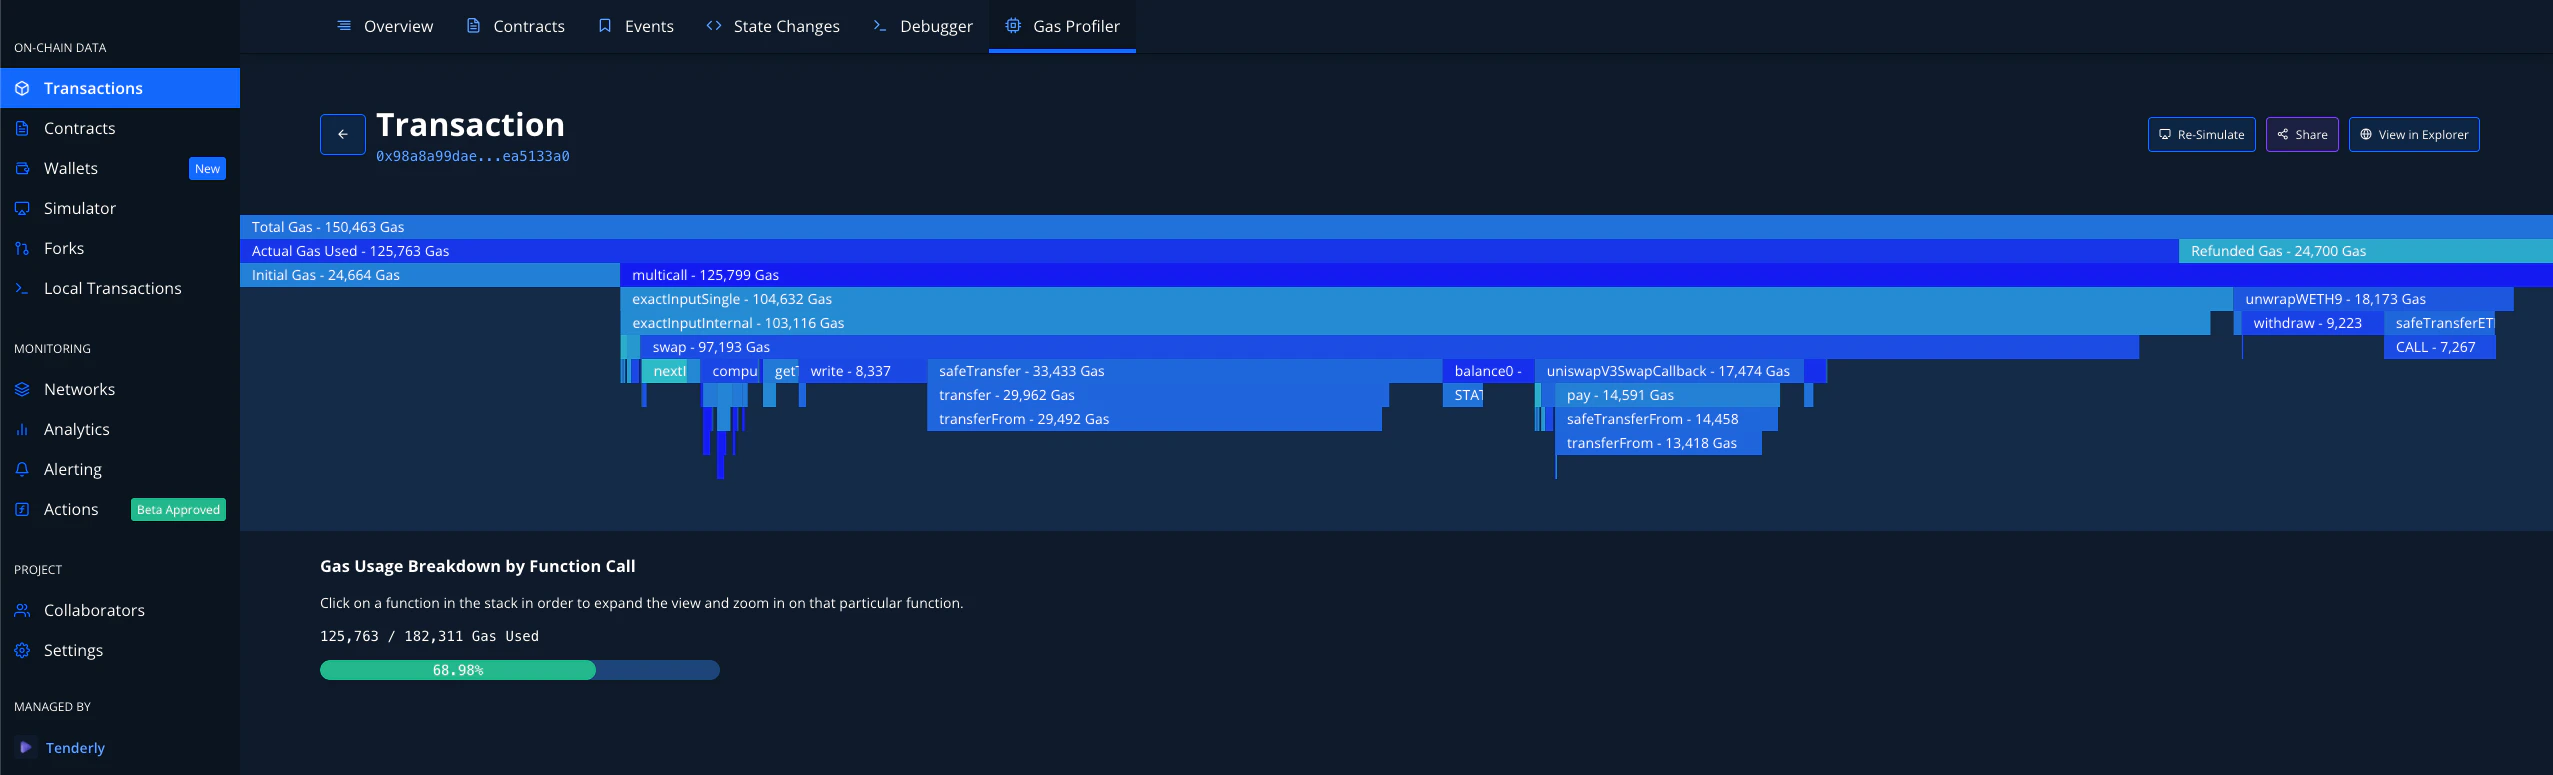 ऊपर की image में आप जो chart देख रहे हैं उसे flame graph कहा जाता है। यह CPU जैसे संसाधन के usage को दिखाने का एक सामान्य तरीका है। आप उपरोक्त उदाहरण [यहाँ](https://dashboard.tenderly.co/tx/mainnet/0x98a8a99daec2823836ac155003ec7c798ded926a86e1c165716dd0d0ea5133a0) पा सकते हैं।
प्रत्येक line उसके नीचे की lines की कुल लागत दिखाती है। यदि आप किसी भी lines (functions) पर क्लिक करते हैं, तो आप invoke किए गए functions की gas cost का विस्तृत breakdown देख सकते हैं।
ऊपर की image में आप जो chart देख रहे हैं उसे flame graph कहा जाता है। यह CPU जैसे संसाधन के usage को दिखाने का एक सामान्य तरीका है। आप उपरोक्त उदाहरण [यहाँ](https://dashboard.tenderly.co/tx/mainnet/0x98a8a99daec2823836ac155003ec7c798ded926a86e1c165716dd0d0ea5133a0) पा सकते हैं।
प्रत्येक line उसके नीचे की lines की कुल लागत दिखाती है। यदि आप किसी भी lines (functions) पर क्लिक करते हैं, तो आप invoke किए गए functions की gas cost का विस्तृत breakdown देख सकते हैं।
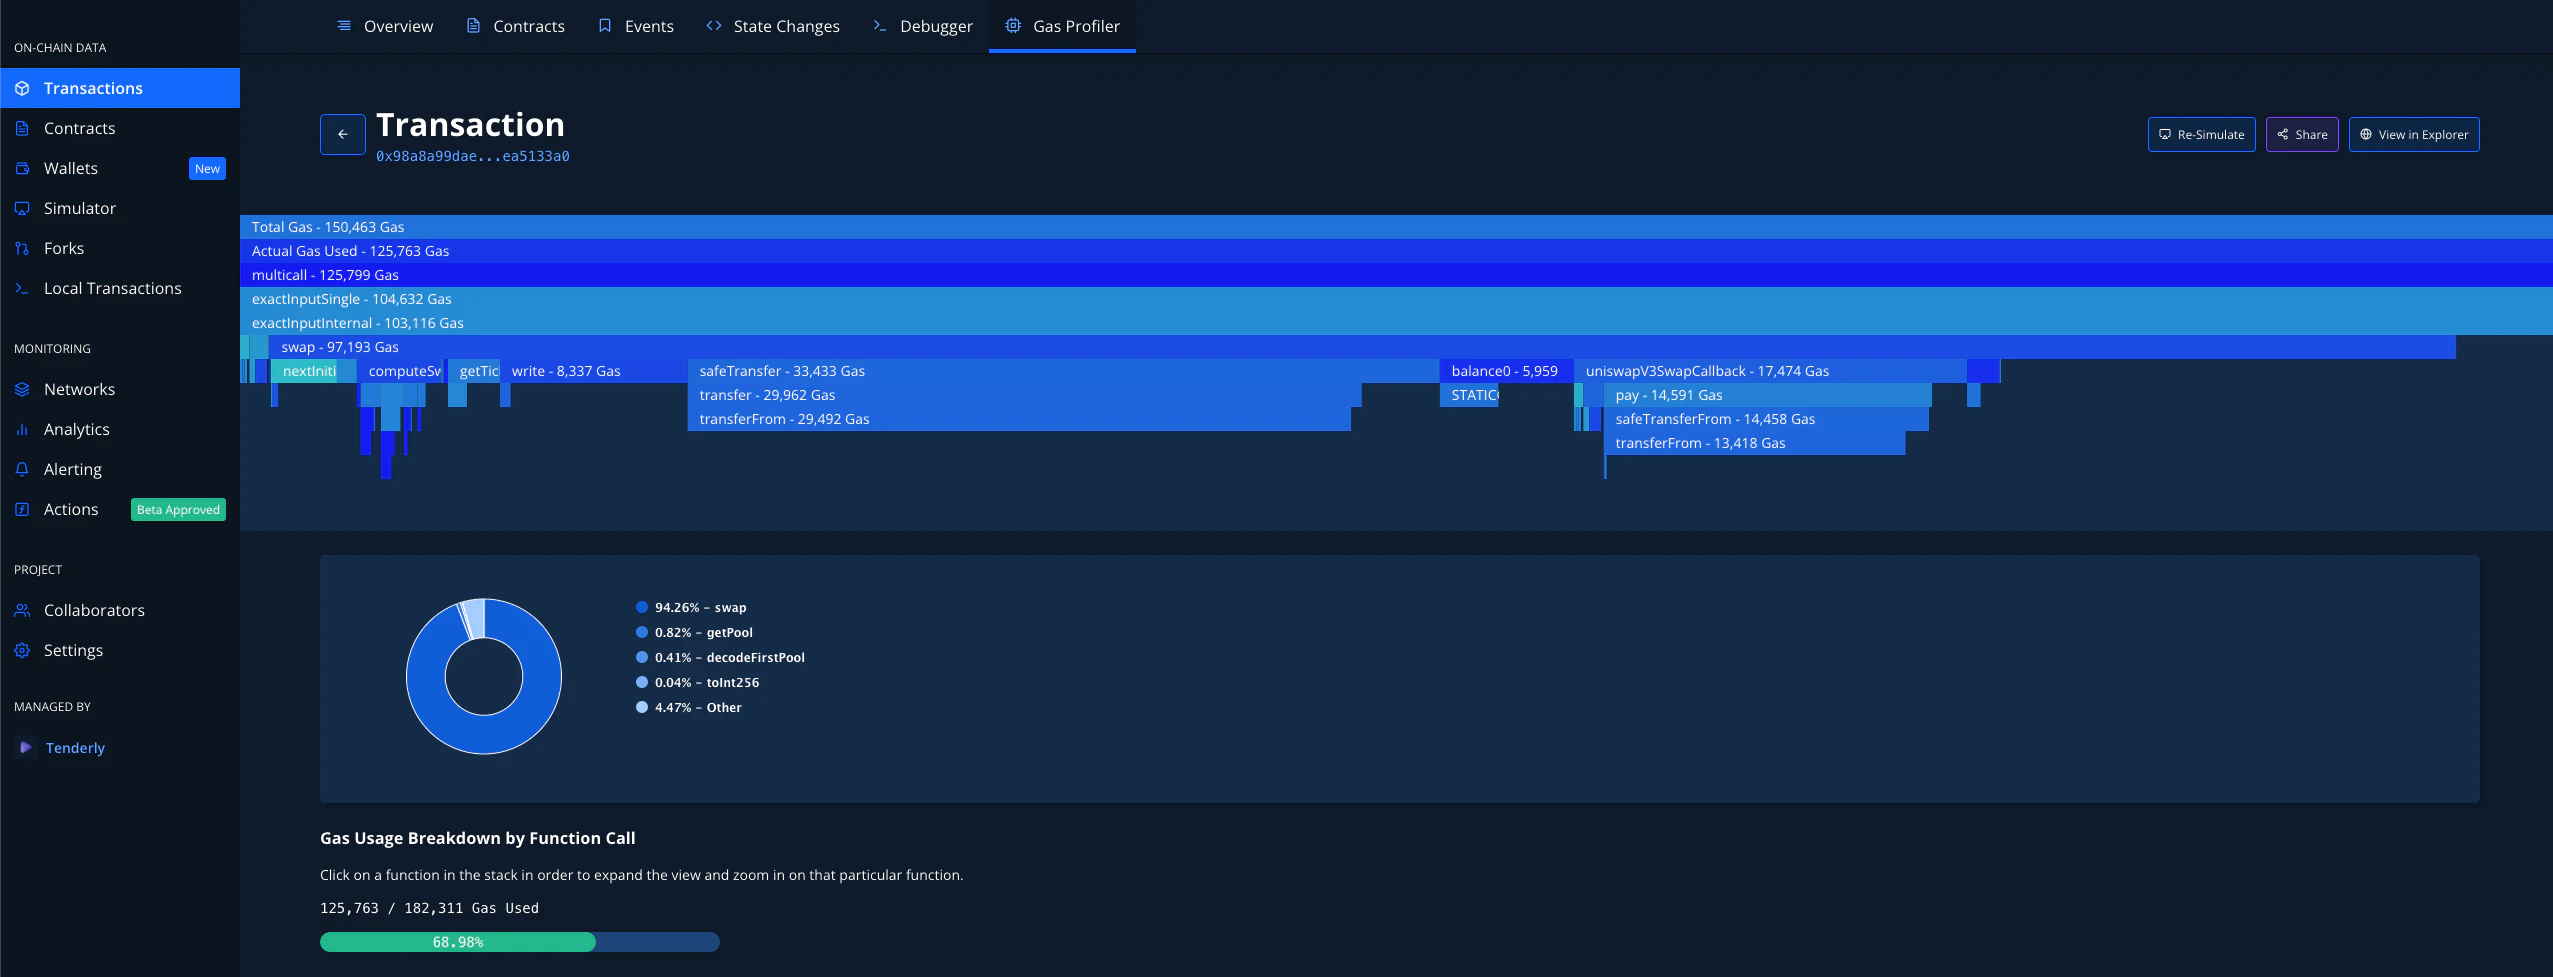 आप अंत में यह देख सकते हैं कि कौन से functions सबसे अधिक gas का उपयोग कर रहे हैं और optimize करने के लिए अपने code के सही हिस्सों को चुन सकते हैं।