> ## Documentation Index
> Fetch the complete documentation index at: https://docs.tenderly.co/llms.txt
> Use this file to discover all available pages before exploring further.
# Transactions
> विकास और निगरानी के लिए Tenderly Dashboard में transactions को प्रबंधित और विश्लेषण करने के लिए एक गाइड।
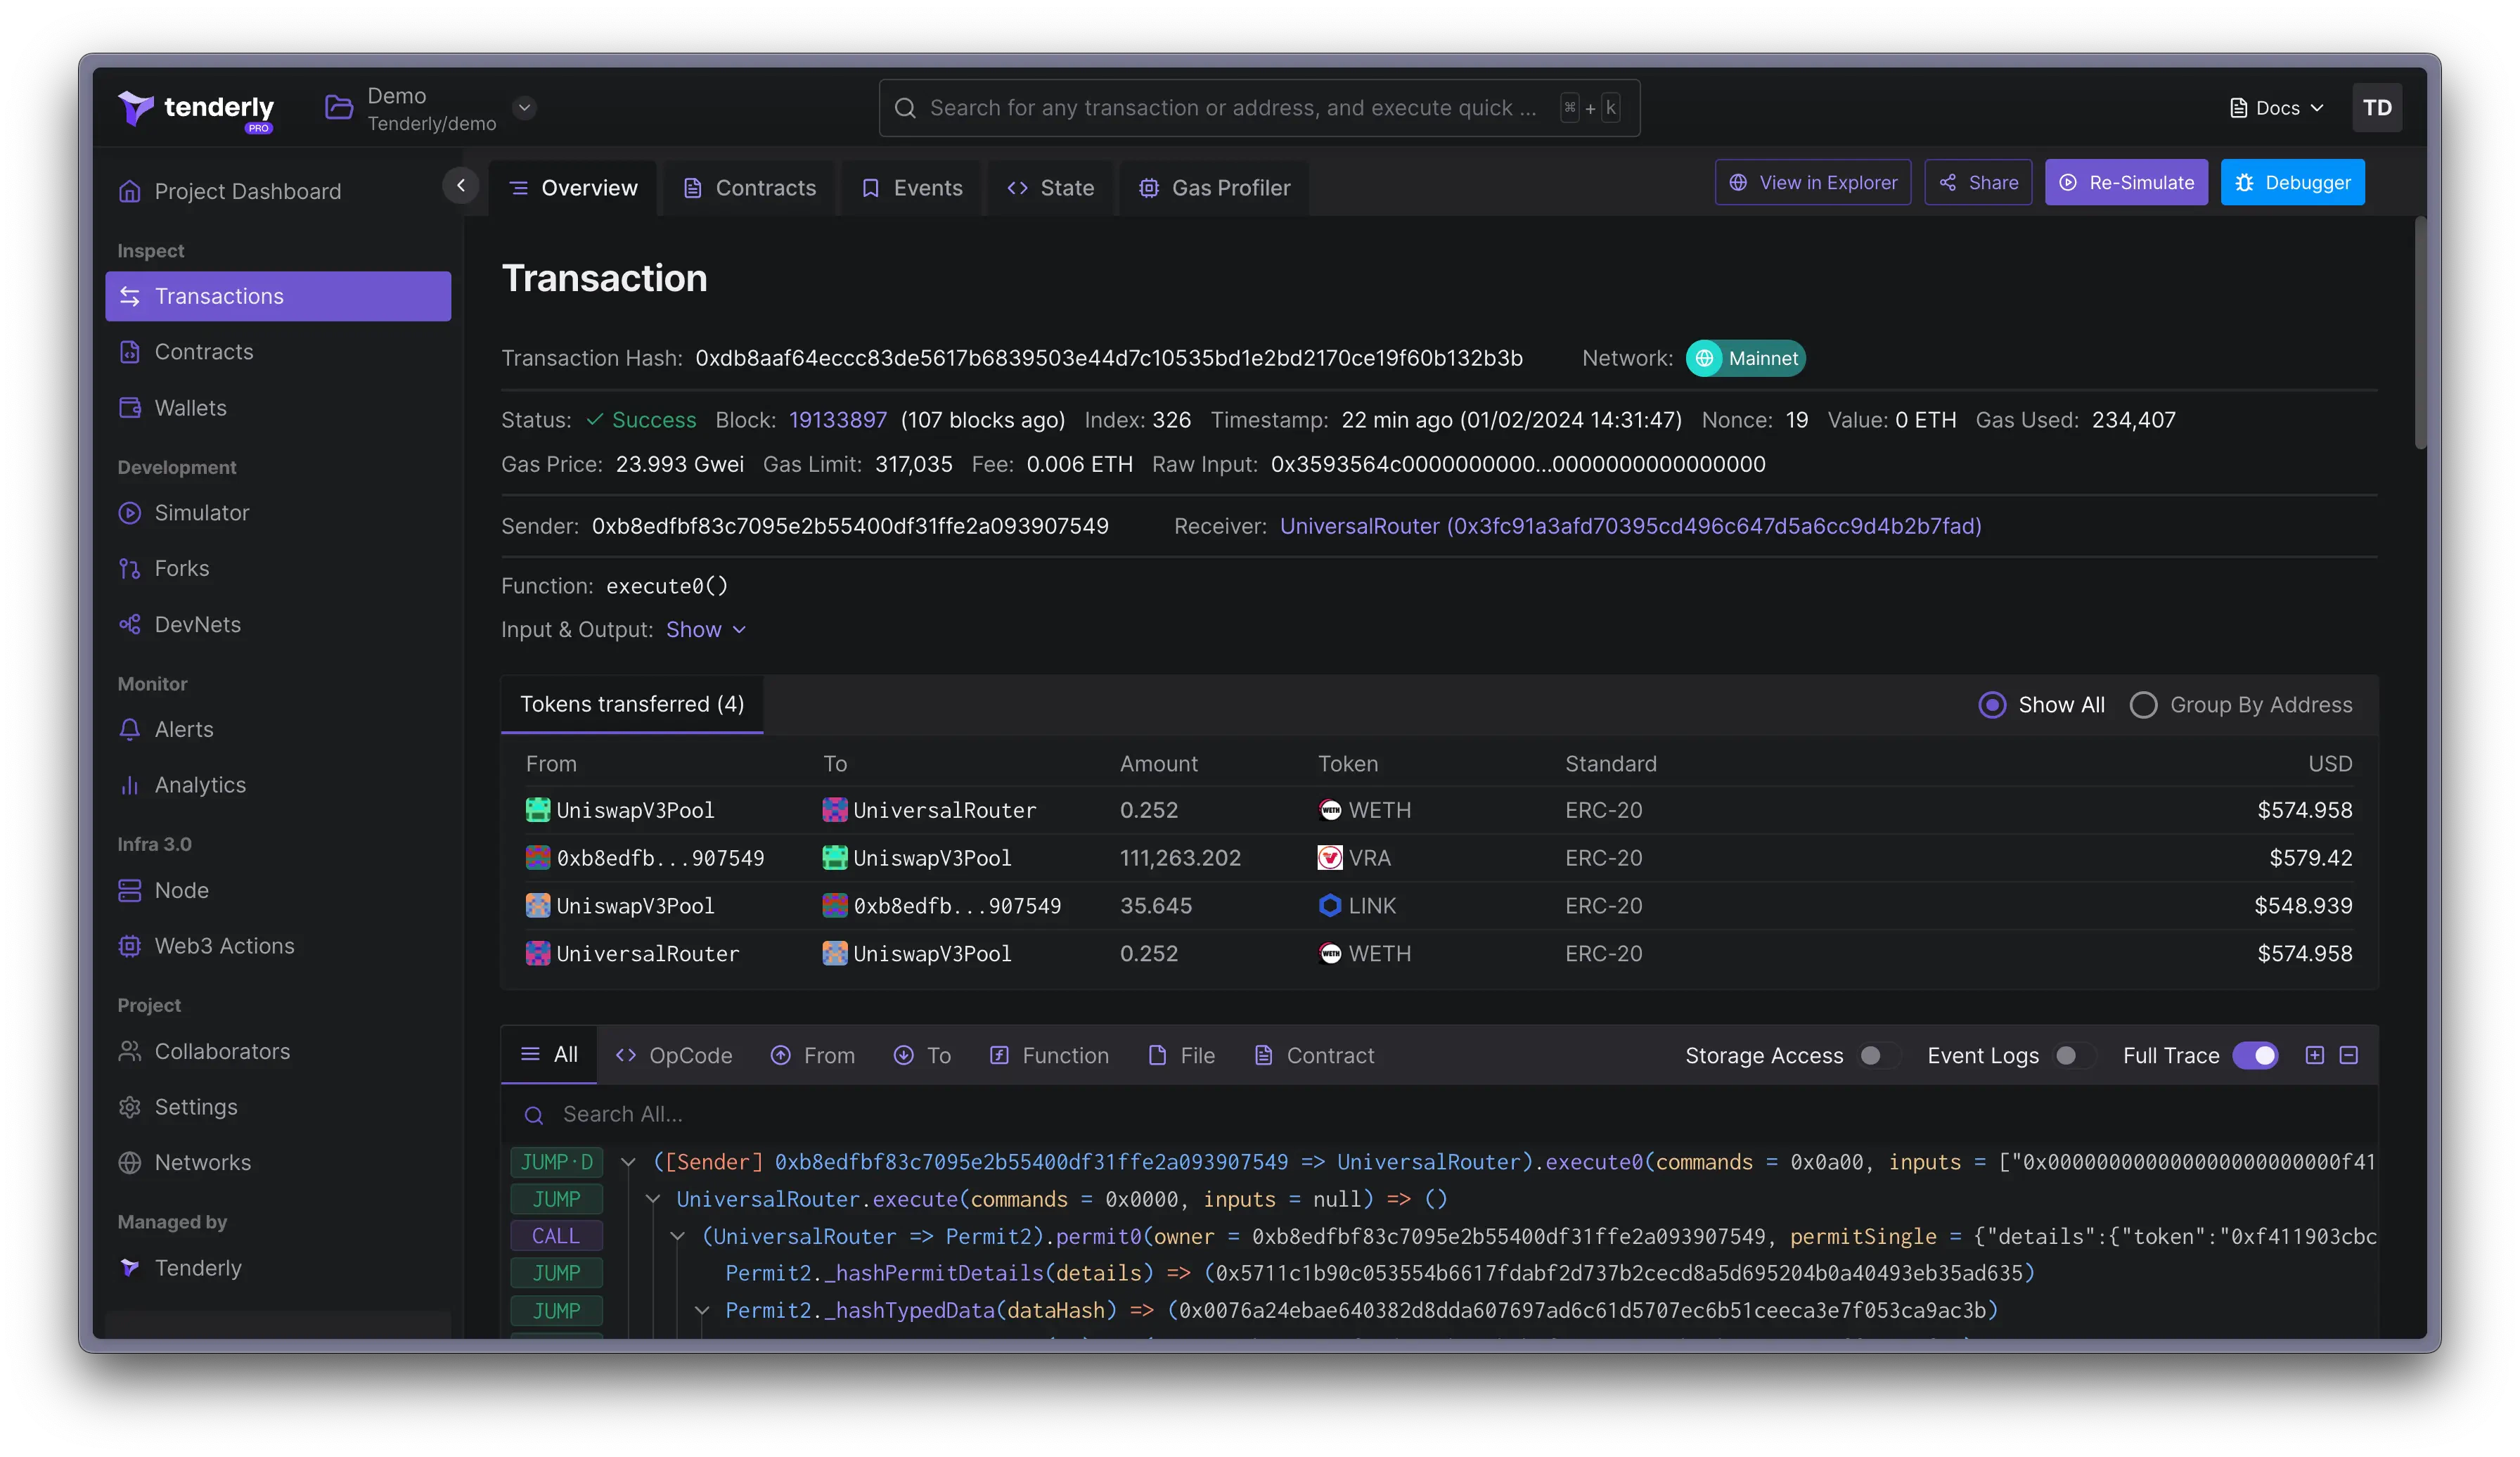
Tenderly आपको transaction execution विवरण का सबसे विस्तृत अवलोकन देता है। प्रत्येक transaction के लिए, Tenderly निम्नलिखित डेटा और अधिक निकालता है: सामान्य जानकारी, [Decoded call trace](#decoded-call-trace), [Tokens transferred](#tokens-transferred), [Fund Flow](#fund-flow), [Contracts involved](#involved-contracts), [State changes](#state-changes), [Emitted events](#emitted-events), [Gas used](#gas-used), और अधिक।
[Loom पर देखें →](https://www.loom.com/share/05325e45c232445b992214da8c6ba179?sid=e10e8812-874d-42ad-9def-ea47f8e6a13d)
transaction overview पेज से, आप stack trace और smart contract source code में गहराई से जाने के लिए [Debugger](/debugger/overview) तक भी पहुँच सकते हैं। आप कई transaction parameters को संशोधित करने और network की latest state के विरुद्ध परिणामों का simulation करने के लिए [Simulator](/simulator-ui/overview) का भी उपयोग कर सकते हैं।
 ## Decoded call trace
decoded call trace पैनल आपको विभिन्न opcodes का निरीक्षण करने की अनुमति देता है, जिसमें inputs और outputs शामिल हैं: `JUMP`, `CALL`, `DELEGATECALL`, `STATICCALL`, `CREATE2`, `CREATE`, `REVERT`, `JUMPDEST`, `SLOAD`, और `SSTORE`। EVM [opcodes के बारे में यहाँ](https://ethervm.io/) अधिक जानें।
## Decoded call trace
decoded call trace पैनल आपको विभिन्न opcodes का निरीक्षण करने की अनुमति देता है, जिसमें inputs और outputs शामिल हैं: `JUMP`, `CALL`, `DELEGATECALL`, `STATICCALL`, `CREATE2`, `CREATE`, `REVERT`, `JUMPDEST`, `SLOAD`, और `SSTORE`। EVM [opcodes के बारे में यहाँ](https://ethervm.io/) अधिक जानें।
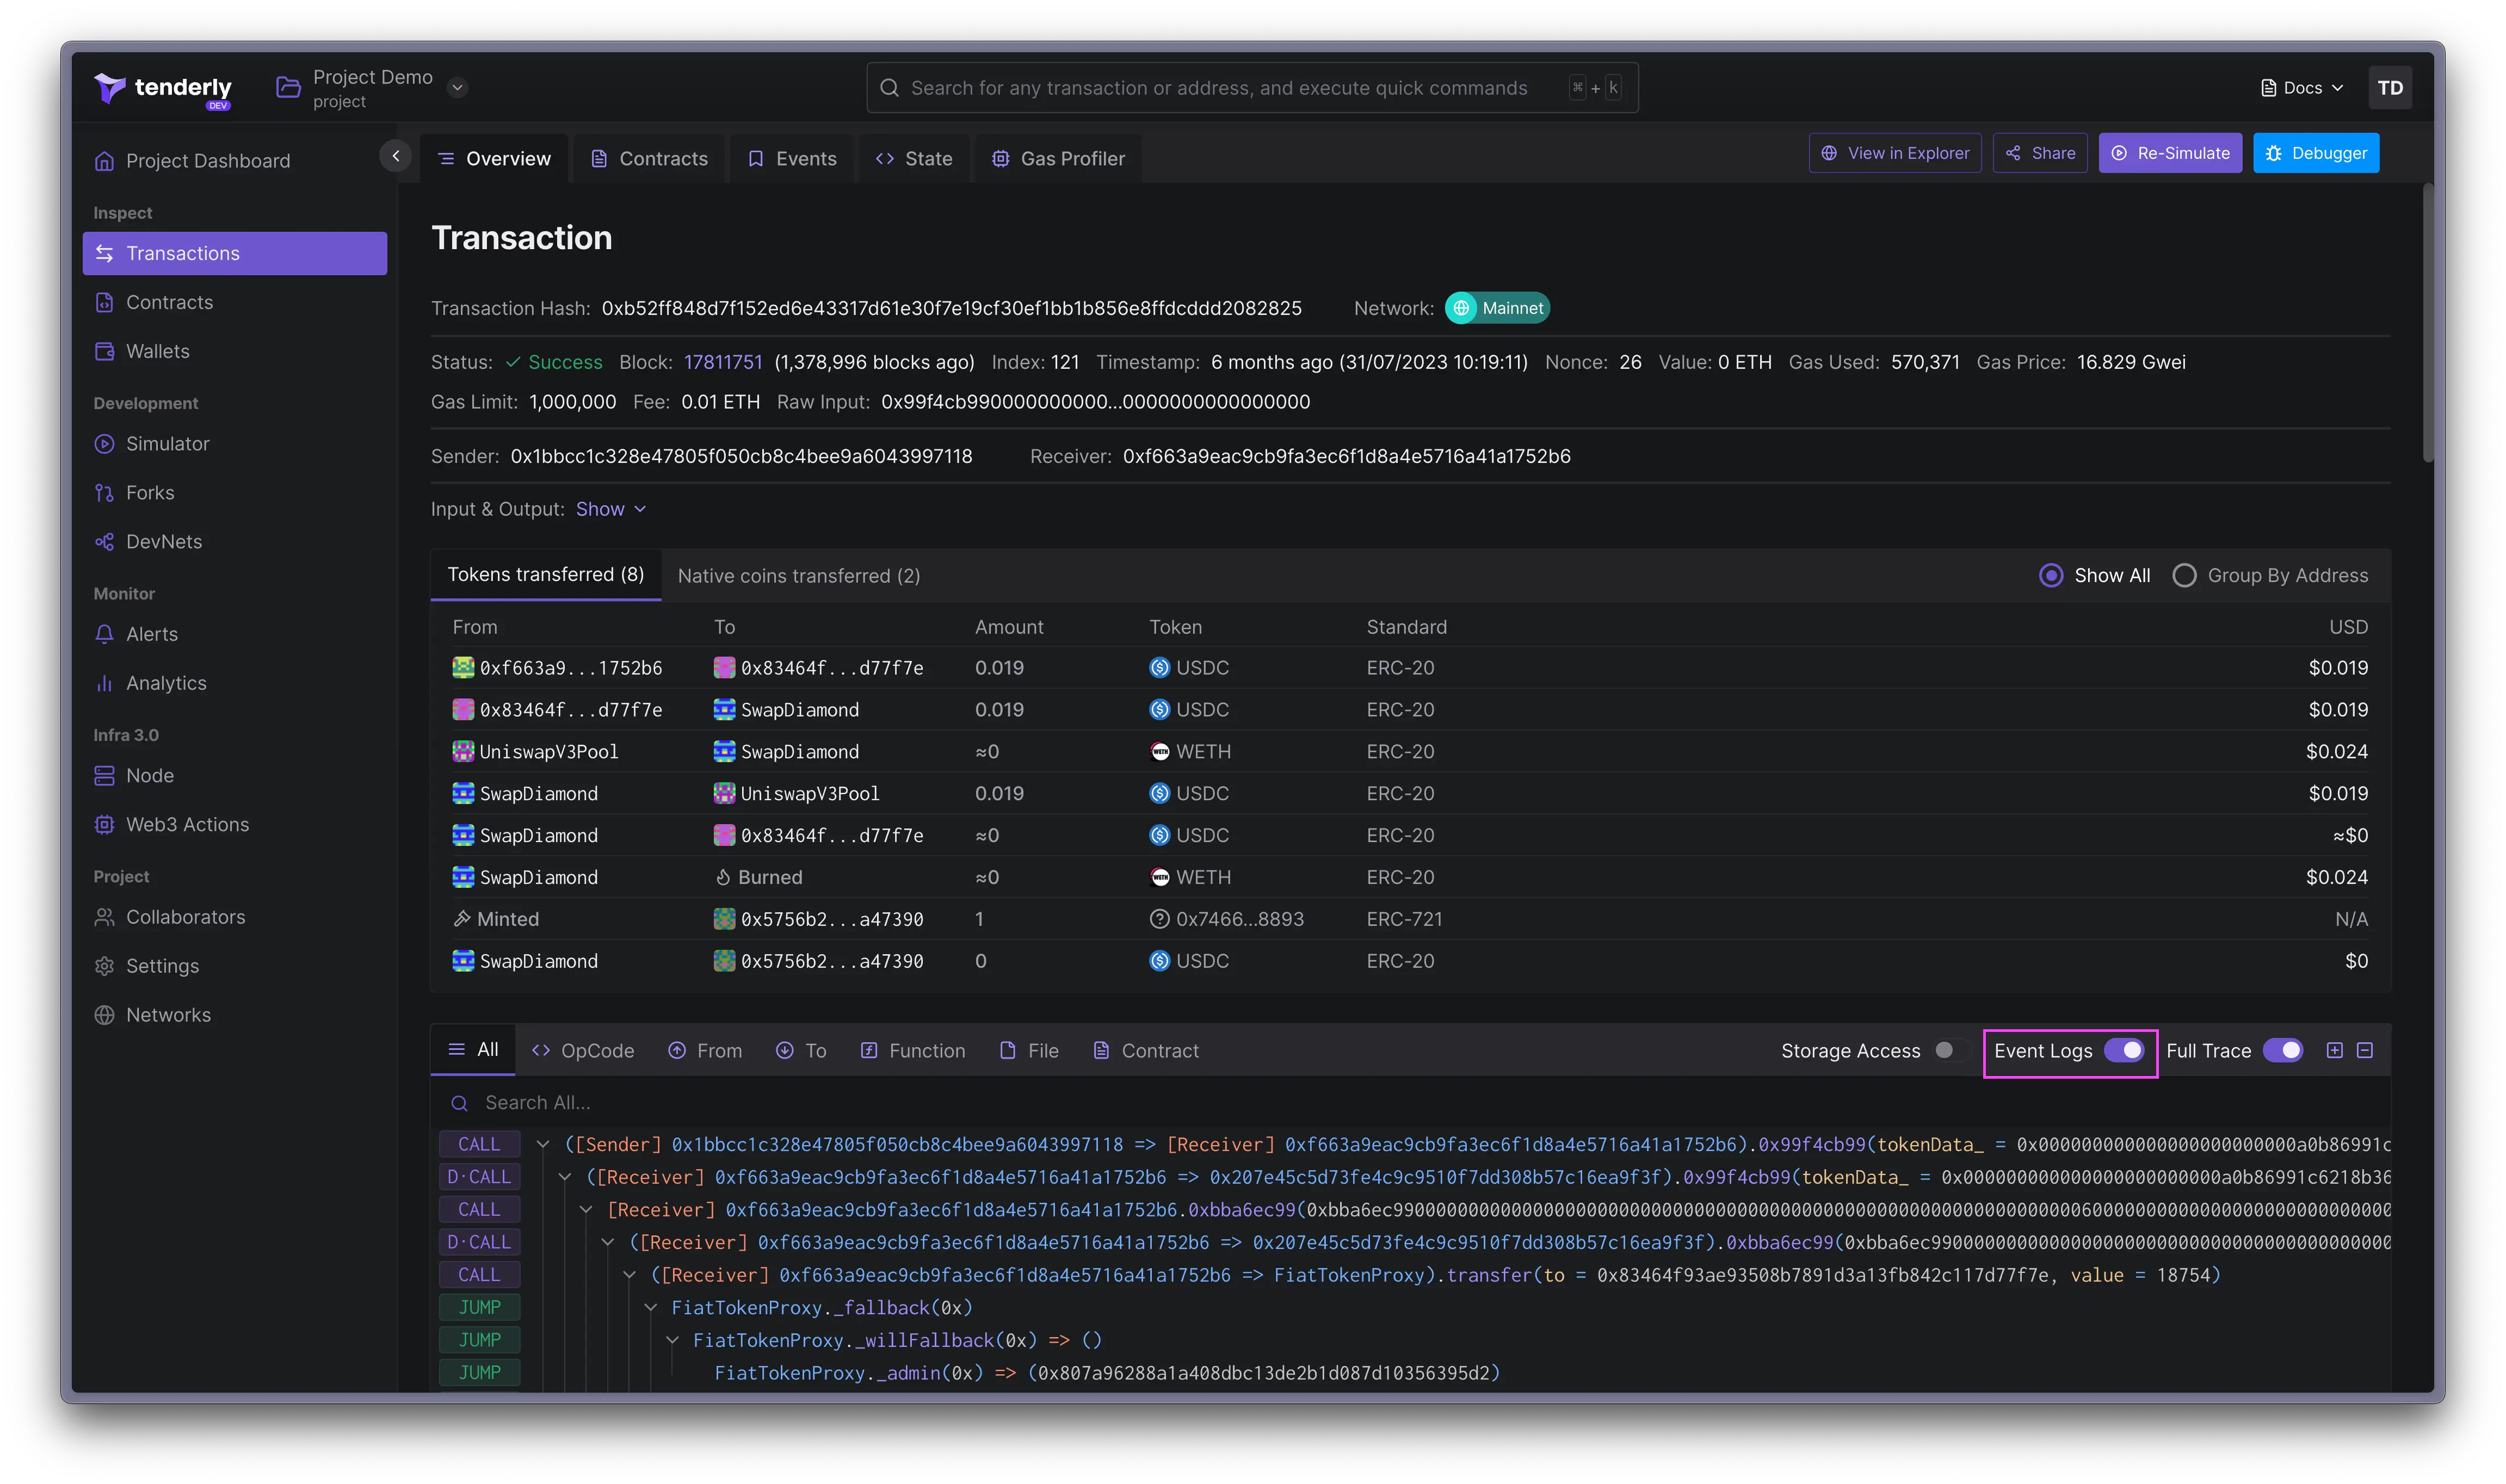
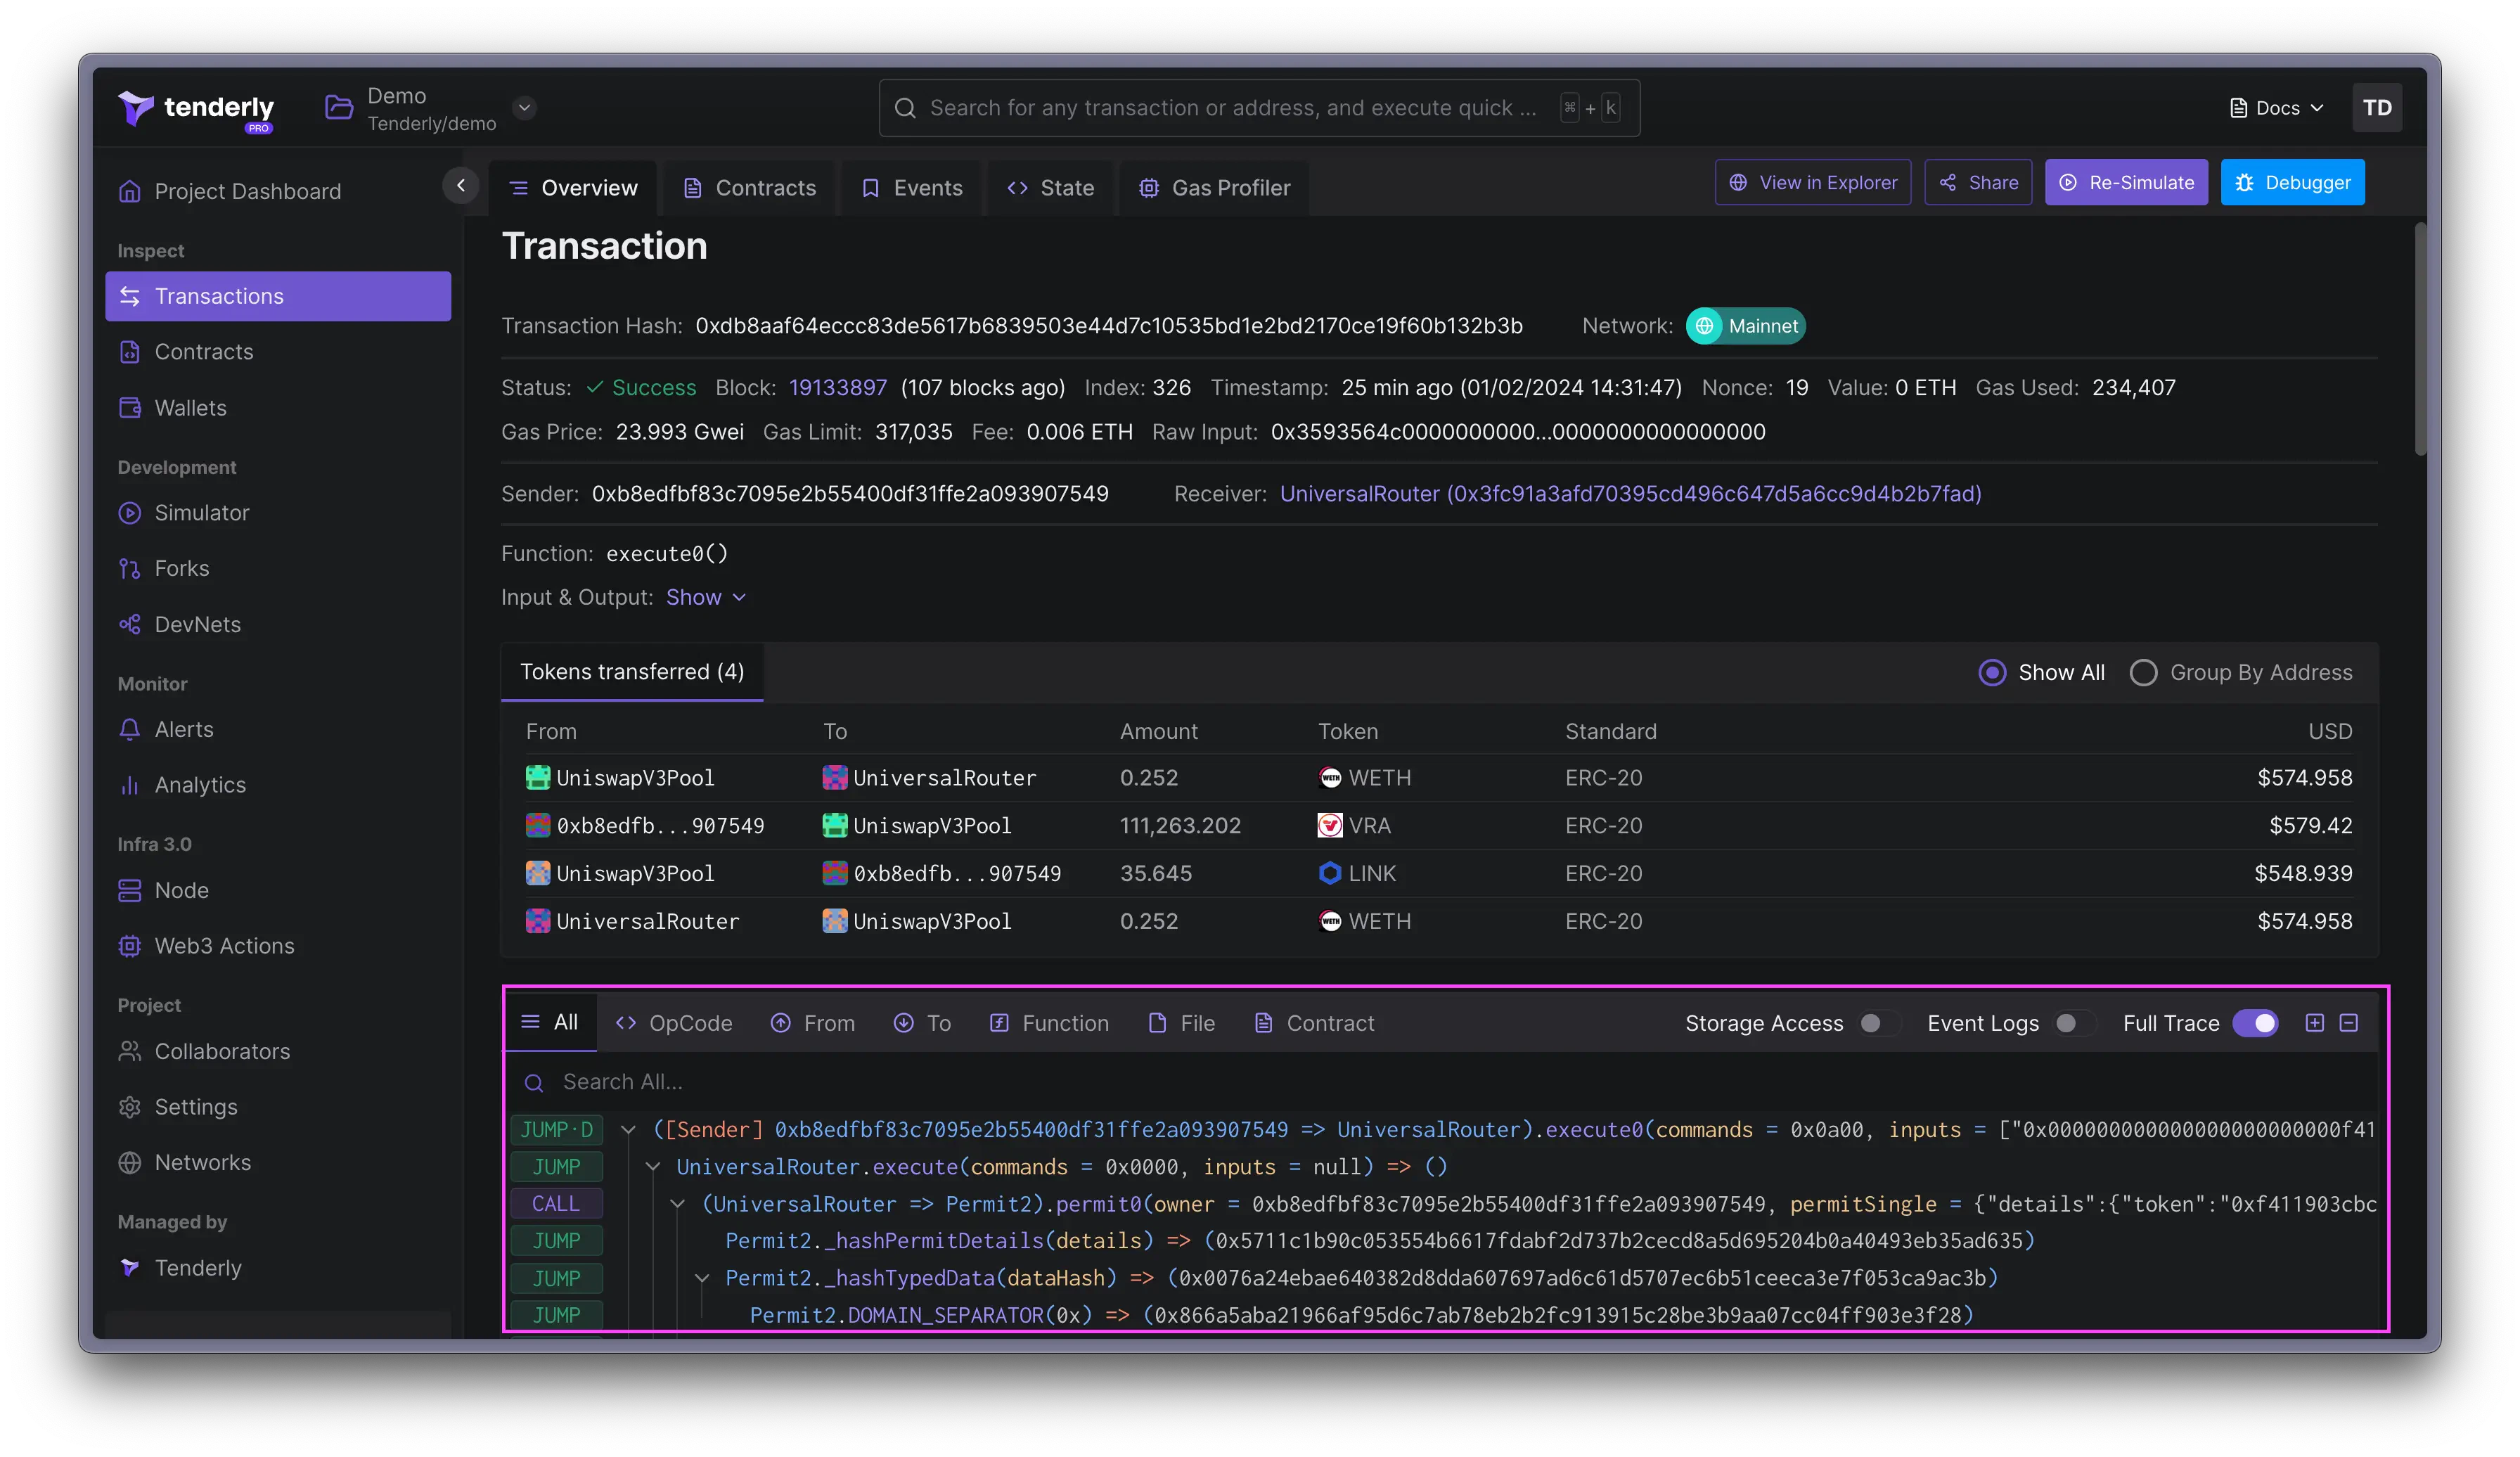 आपके पास इस पर भी नियंत्रण है कि Dashboard में call trace के बारे में कितना डेटा प्रदर्शित किया जाए। call trace से जानकारी शामिल और बाहर करने के लिए **Full Trace**, **Storage Acces**s, और **Event Logs** को टॉगल करें।
### call trace खोजें
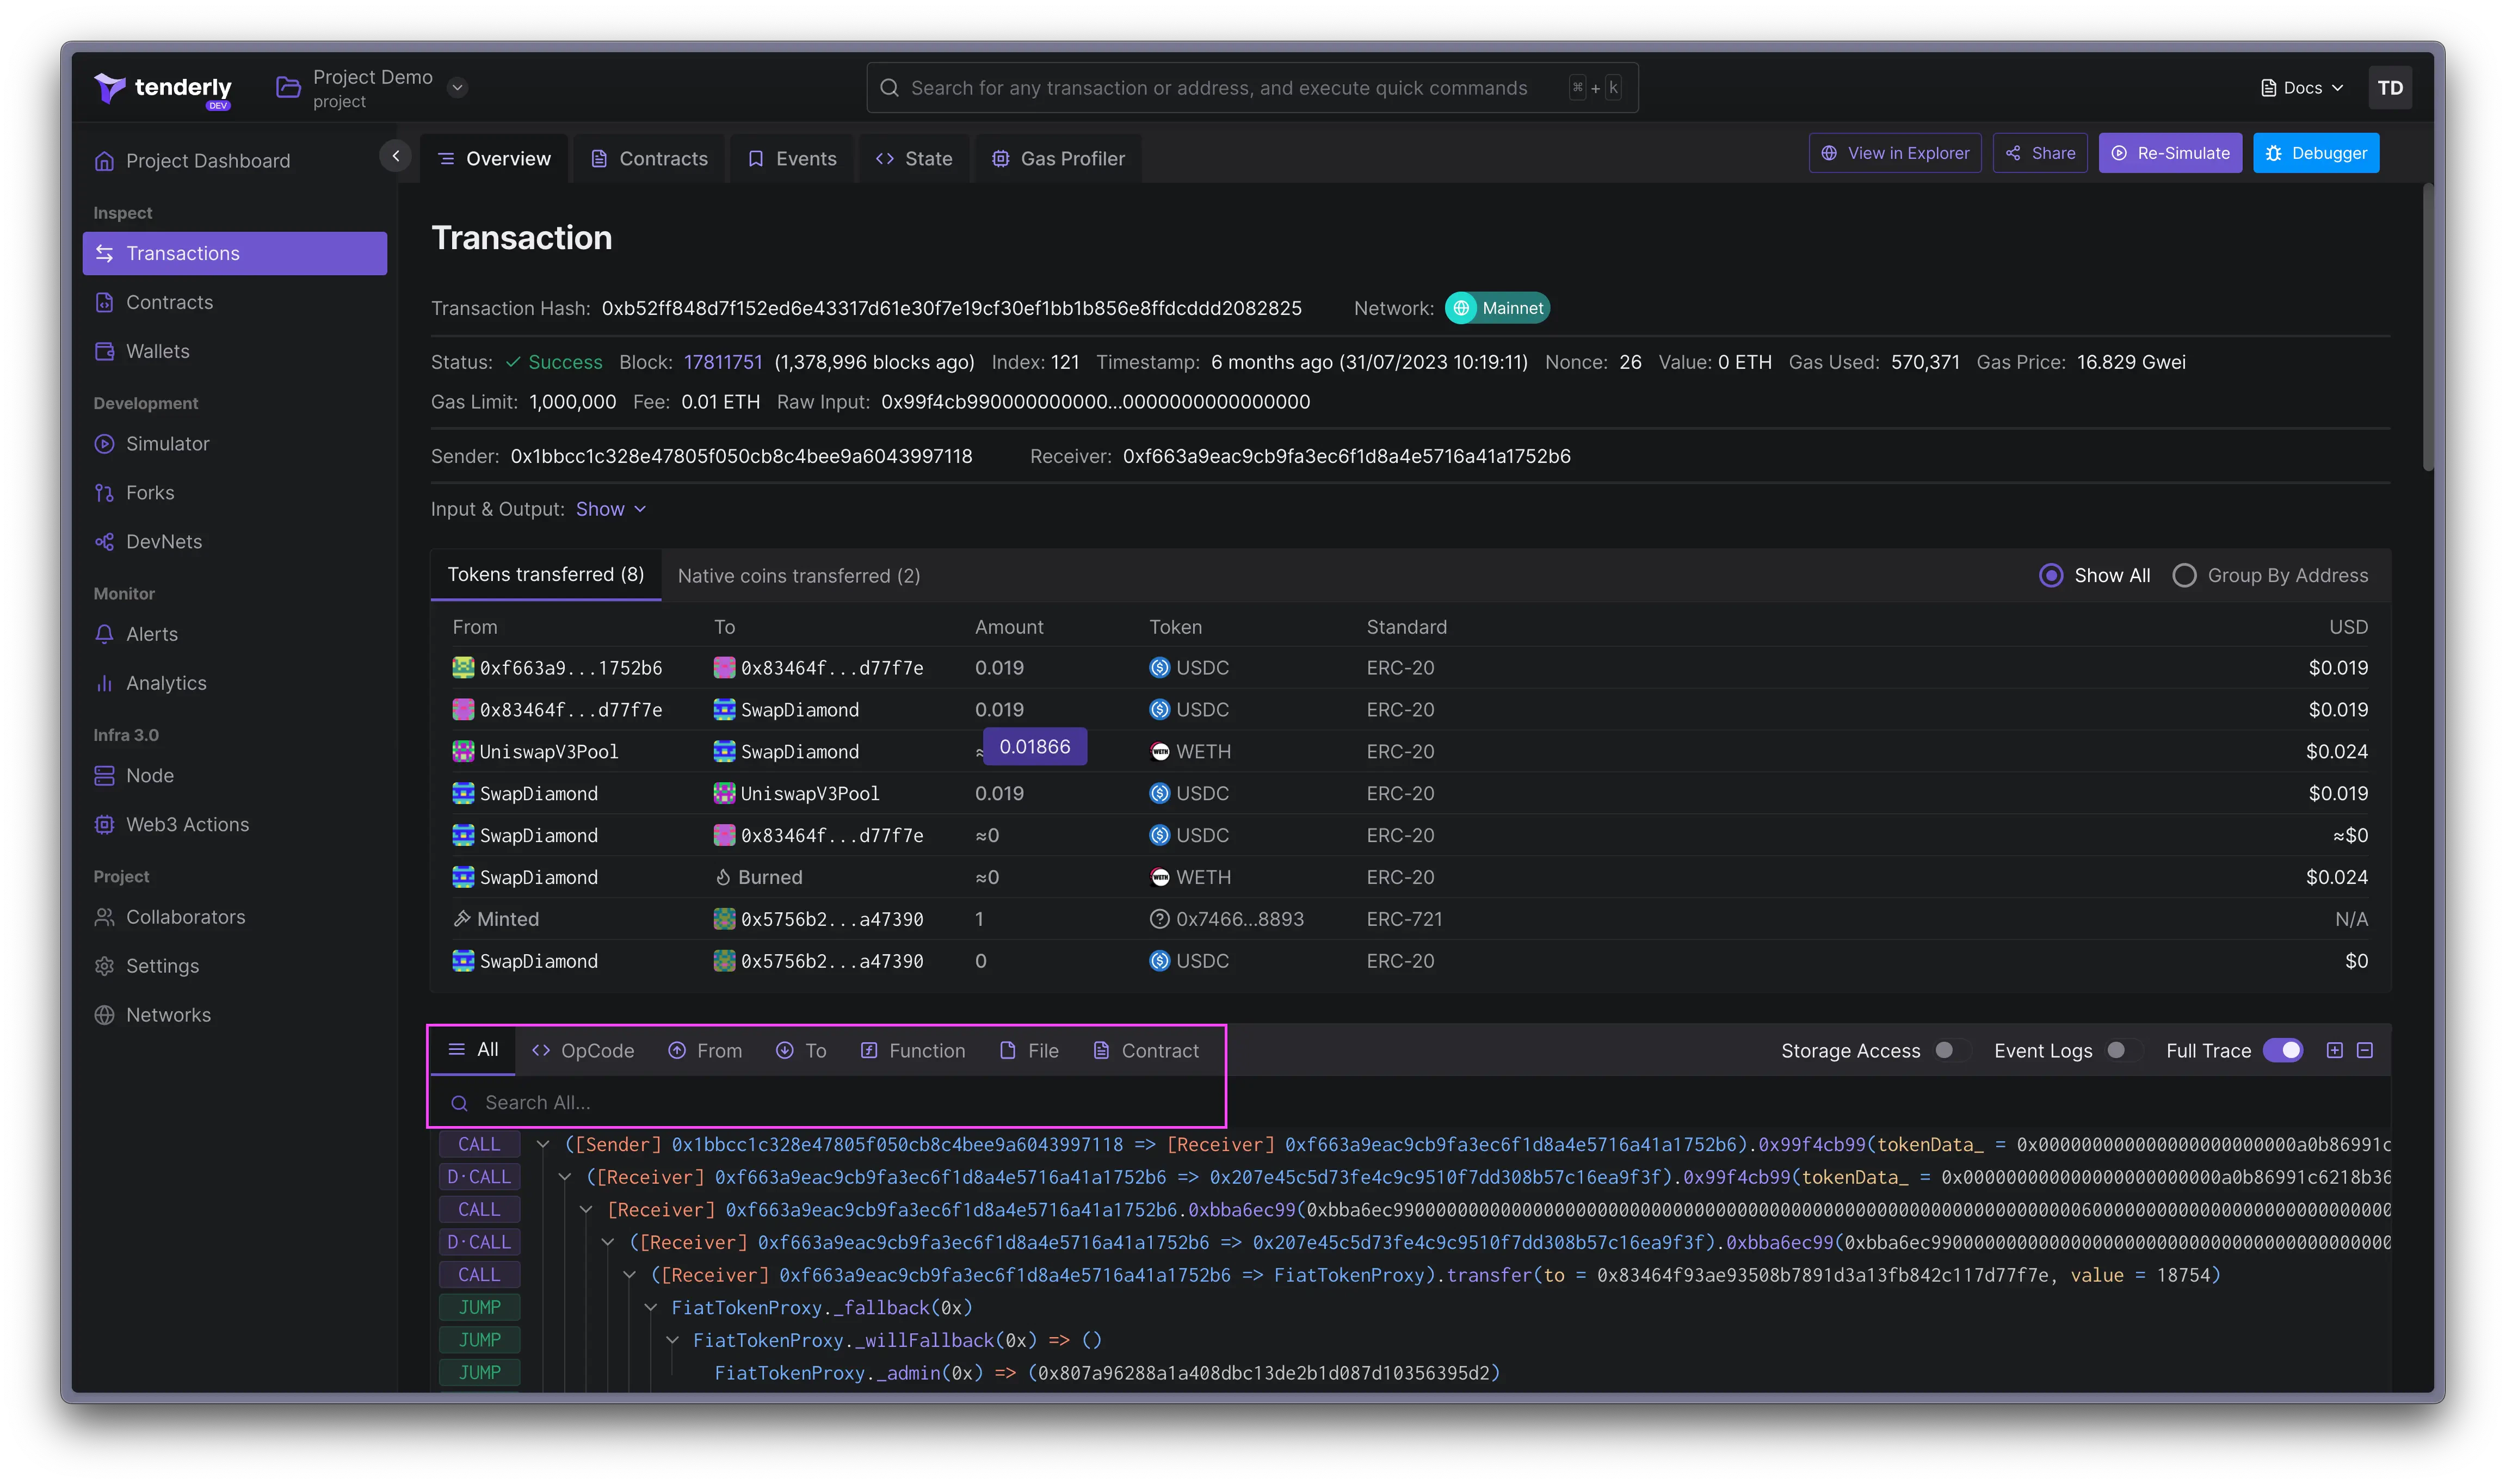
आप विशिष्ट opcodes, functions, और variables को जल्दी से खोजने के लिए पूरे call trace में खोज कर सकते हैं। यदि आपको भेजने और प्राप्तकर्ता addresses, Solidity फ़ाइलें, और contracts खोजने की आवश्यकता है तो search विकल्प भी काम करता है।
आपके पास इस पर भी नियंत्रण है कि Dashboard में call trace के बारे में कितना डेटा प्रदर्शित किया जाए। call trace से जानकारी शामिल और बाहर करने के लिए **Full Trace**, **Storage Acces**s, और **Event Logs** को टॉगल करें।
### call trace खोजें
आप विशिष्ट opcodes, functions, और variables को जल्दी से खोजने के लिए पूरे call trace में खोज कर सकते हैं। यदि आपको भेजने और प्राप्तकर्ता addresses, Solidity फ़ाइलें, और contracts खोजने की आवश्यकता है तो search विकल्प भी काम करता है।
 ### Storage access
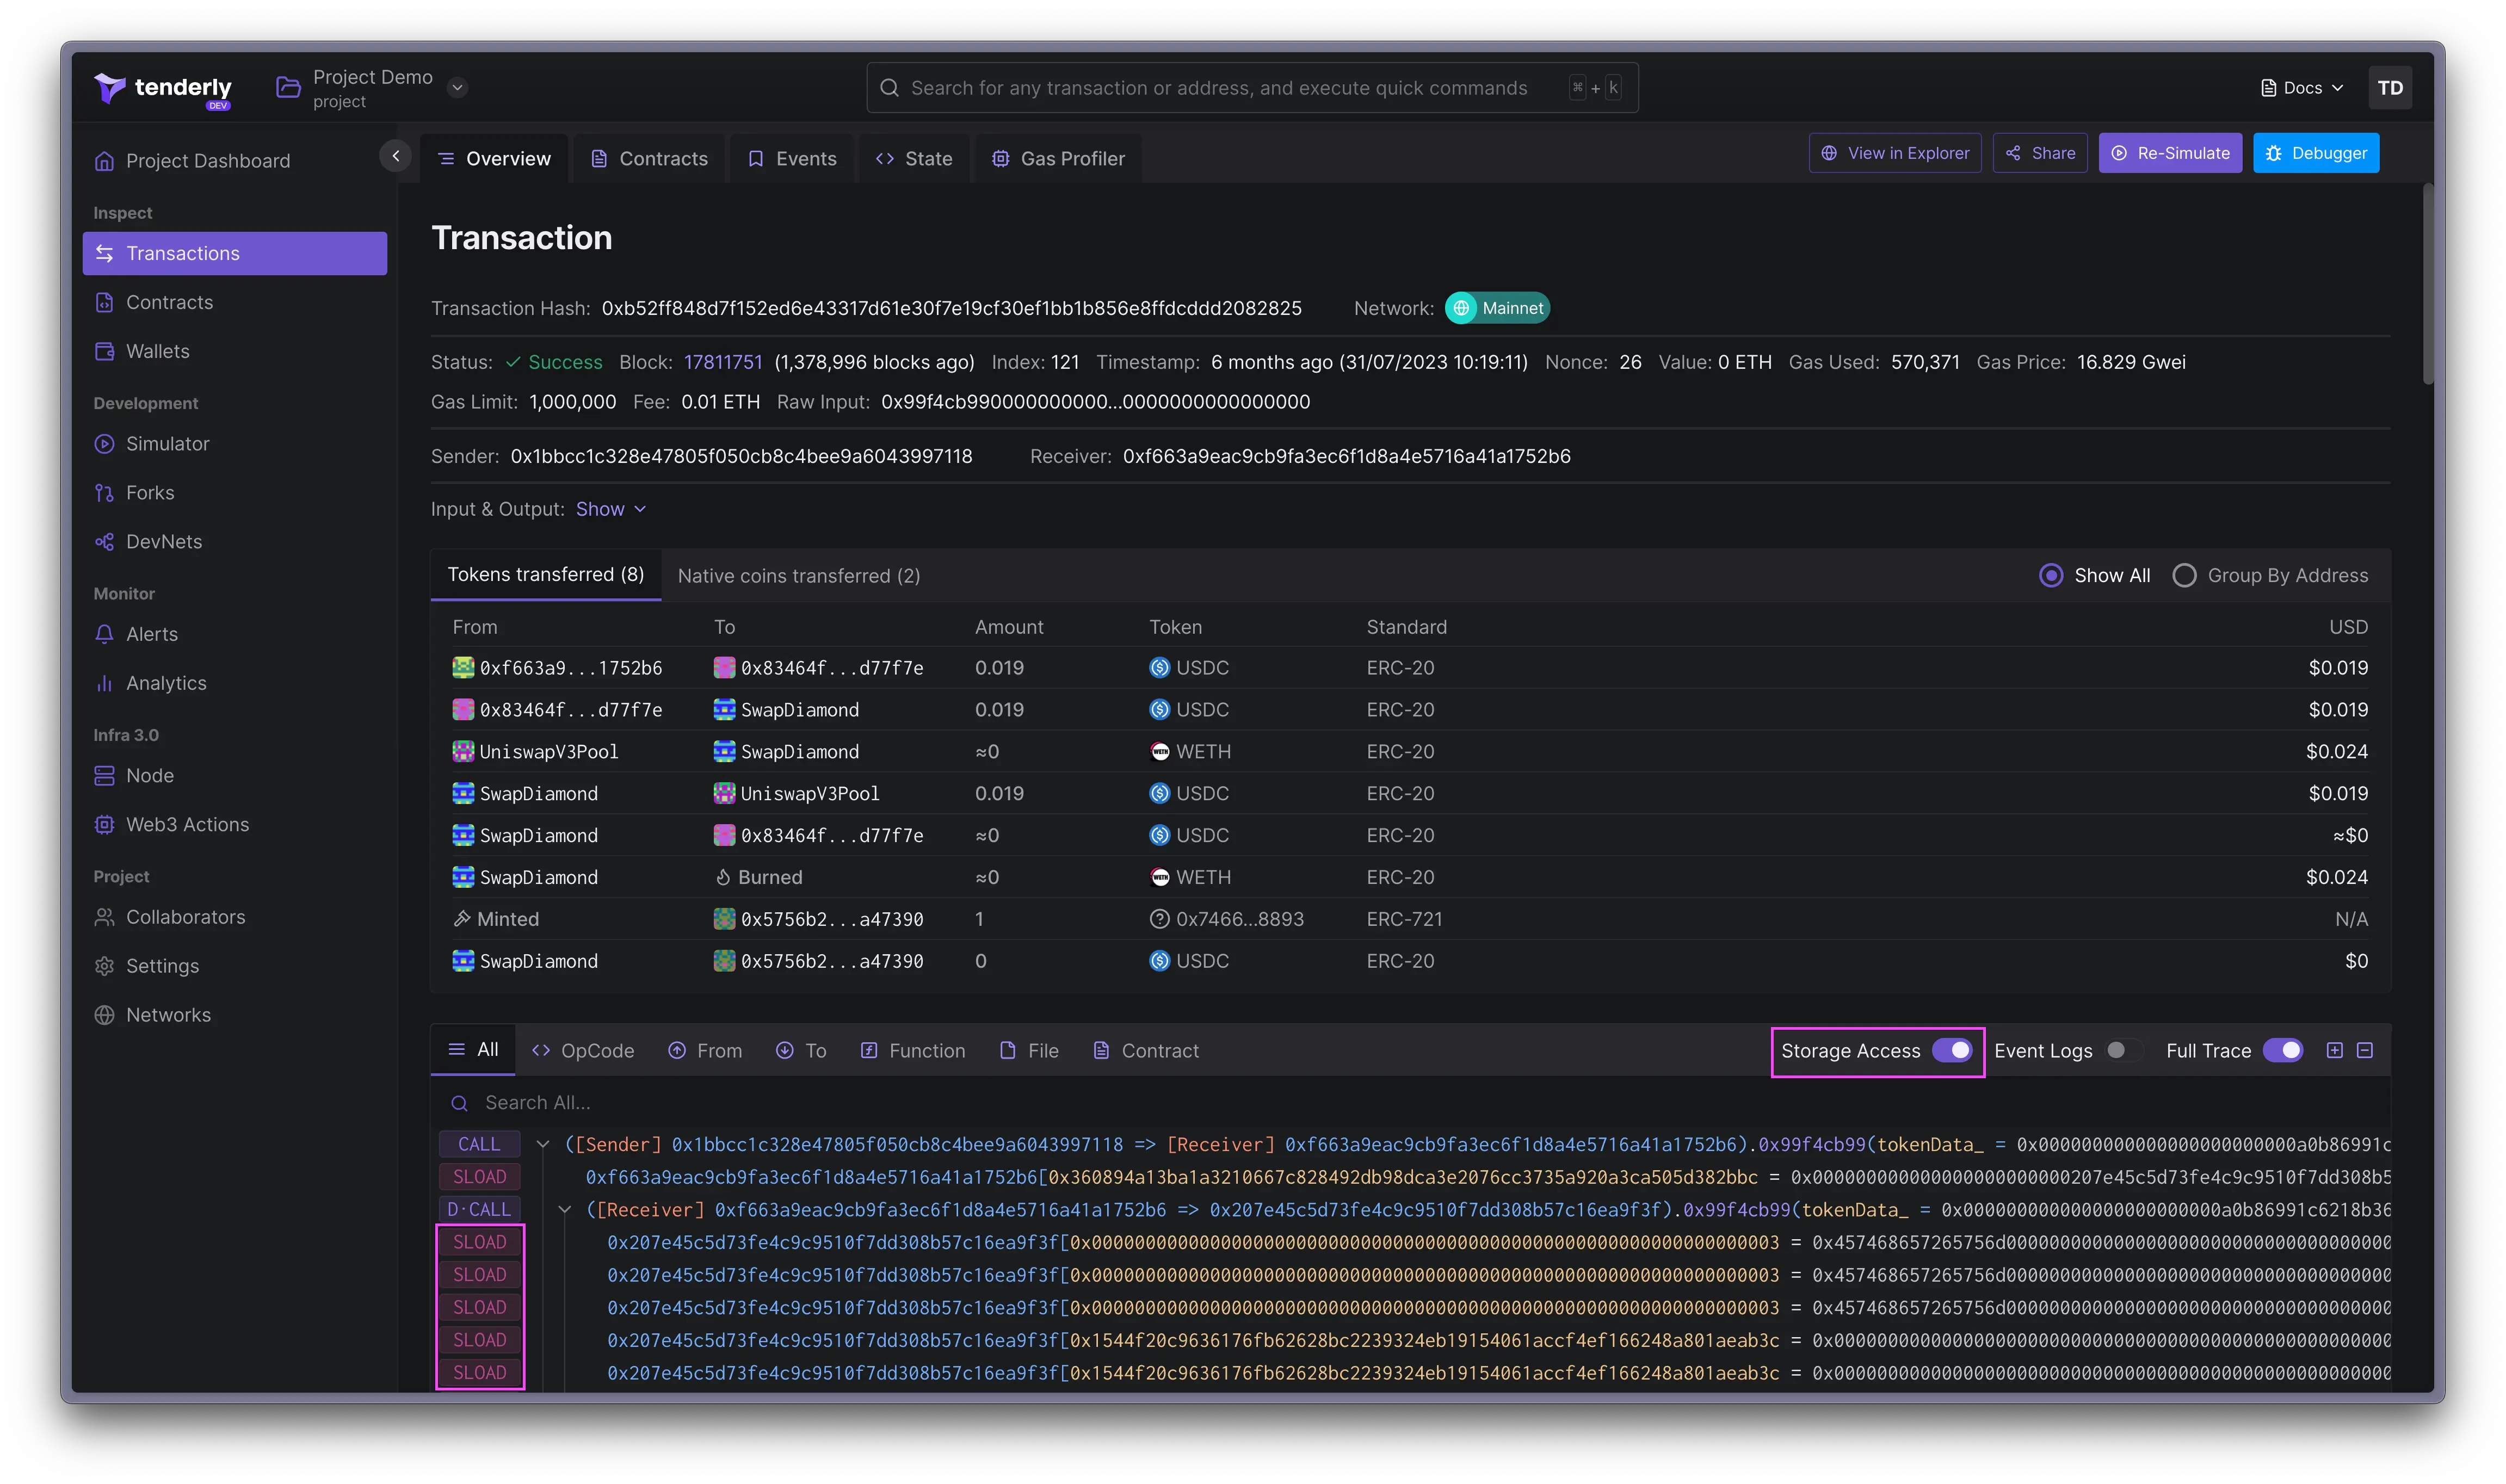
call trace में `SSLOAD` और `SSTORE` opcodes, accessed storage slot, और value में किसी भी परिवर्तन को शामिल करने के लिए **Storage Access** पर क्लिक करें। storage opcodes डिफ़ॉल्ट रूप से प्रदर्शित नहीं होते हैं; आपको उन्हें सक्षम करने की आवश्यकता है।
### Storage access
call trace में `SSLOAD` और `SSTORE` opcodes, accessed storage slot, और value में किसी भी परिवर्तन को शामिल करने के लिए **Storage Access** पर क्लिक करें। storage opcodes डिफ़ॉल्ट रूप से प्रदर्शित नहीं होते हैं; आपको उन्हें सक्षम करने की आवश्यकता है।
 ### Event logs
call trace में log opcodes `log0` से `log4` को शामिल करने के लिए **Events Log** विकल्प को टॉगल करें। इस विकल्प को सक्षम करने से transaction में हुई events प्रदर्शित होंगी।
### Event logs
call trace में log opcodes `log0` से `log4` को शामिल करने के लिए **Events Log** विकल्प को टॉगल करें। इस विकल्प को सक्षम करने से transaction में हुई events प्रदर्शित होंगी।
 ### टिप्पणी और प्राथमिकता
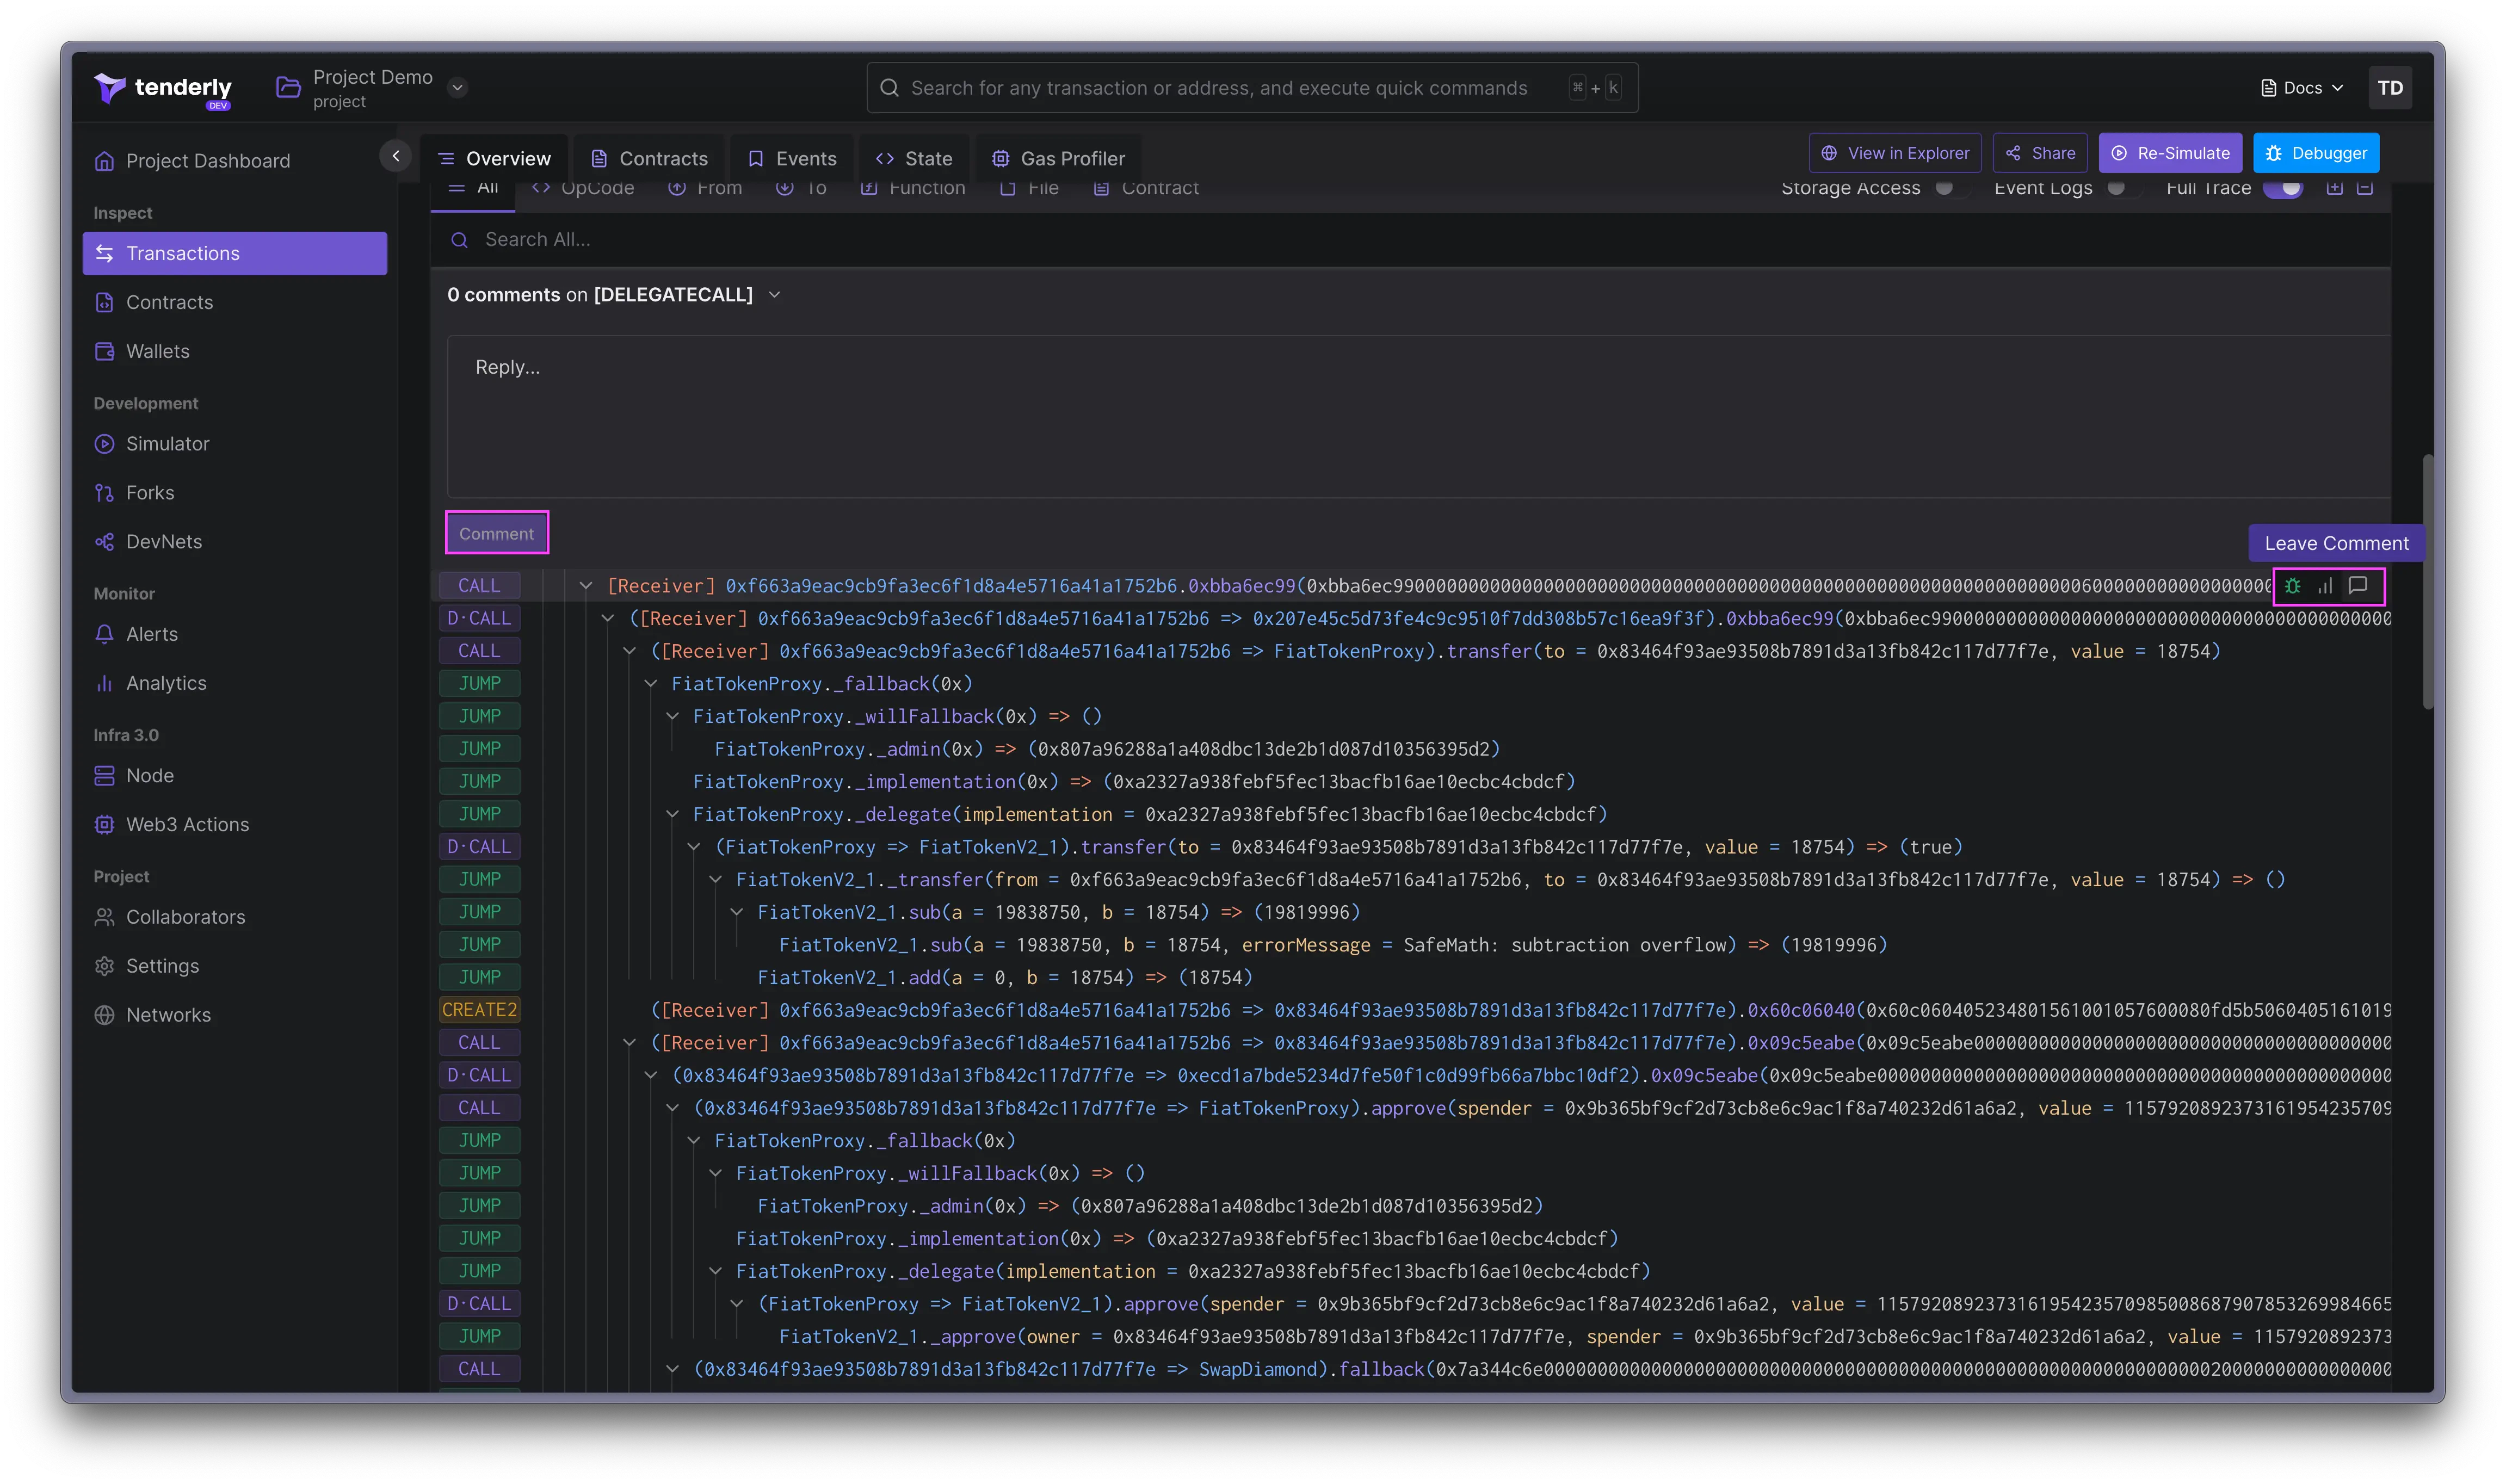
आप call trace के किसी भी हिस्से पर टिप्पणी छोड़ सकते हैं। call trace में किसी भी element पर होवर करें और टिप्पणी छोड़ने के लिए speech bubble icon पर क्लिक करें।
टिप्पणियाँ उपयोगी होती हैं यदि आप एक टीम का हिस्सा हैं और अन्य सदस्यों को देखने के लिए call trace के विशिष्ट हिस्सों पर नोट्स छोड़ना चाहते हैं। टिप्पणियाँ project के सभी सदस्यों को दिखाई देती हैं।
### टिप्पणी और प्राथमिकता
आप call trace के किसी भी हिस्से पर टिप्पणी छोड़ सकते हैं। call trace में किसी भी element पर होवर करें और टिप्पणी छोड़ने के लिए speech bubble icon पर क्लिक करें।
टिप्पणियाँ उपयोगी होती हैं यदि आप एक टीम का हिस्सा हैं और अन्य सदस्यों को देखने के लिए call trace के विशिष्ट हिस्सों पर नोट्स छोड़ना चाहते हैं। टिप्पणियाँ project के सभी सदस्यों को दिखाई देती हैं।
 call trace का निरीक्षण करते समय, आप **individual elements** के लिए **priority** को **High**, **Medium**, या **Low** पर सेट करना चाह सकते हैं। call trace में किसी भी element पर होवर करें और priority सेट करने या हटाने के लिए line graph icon पर क्लिक करें।
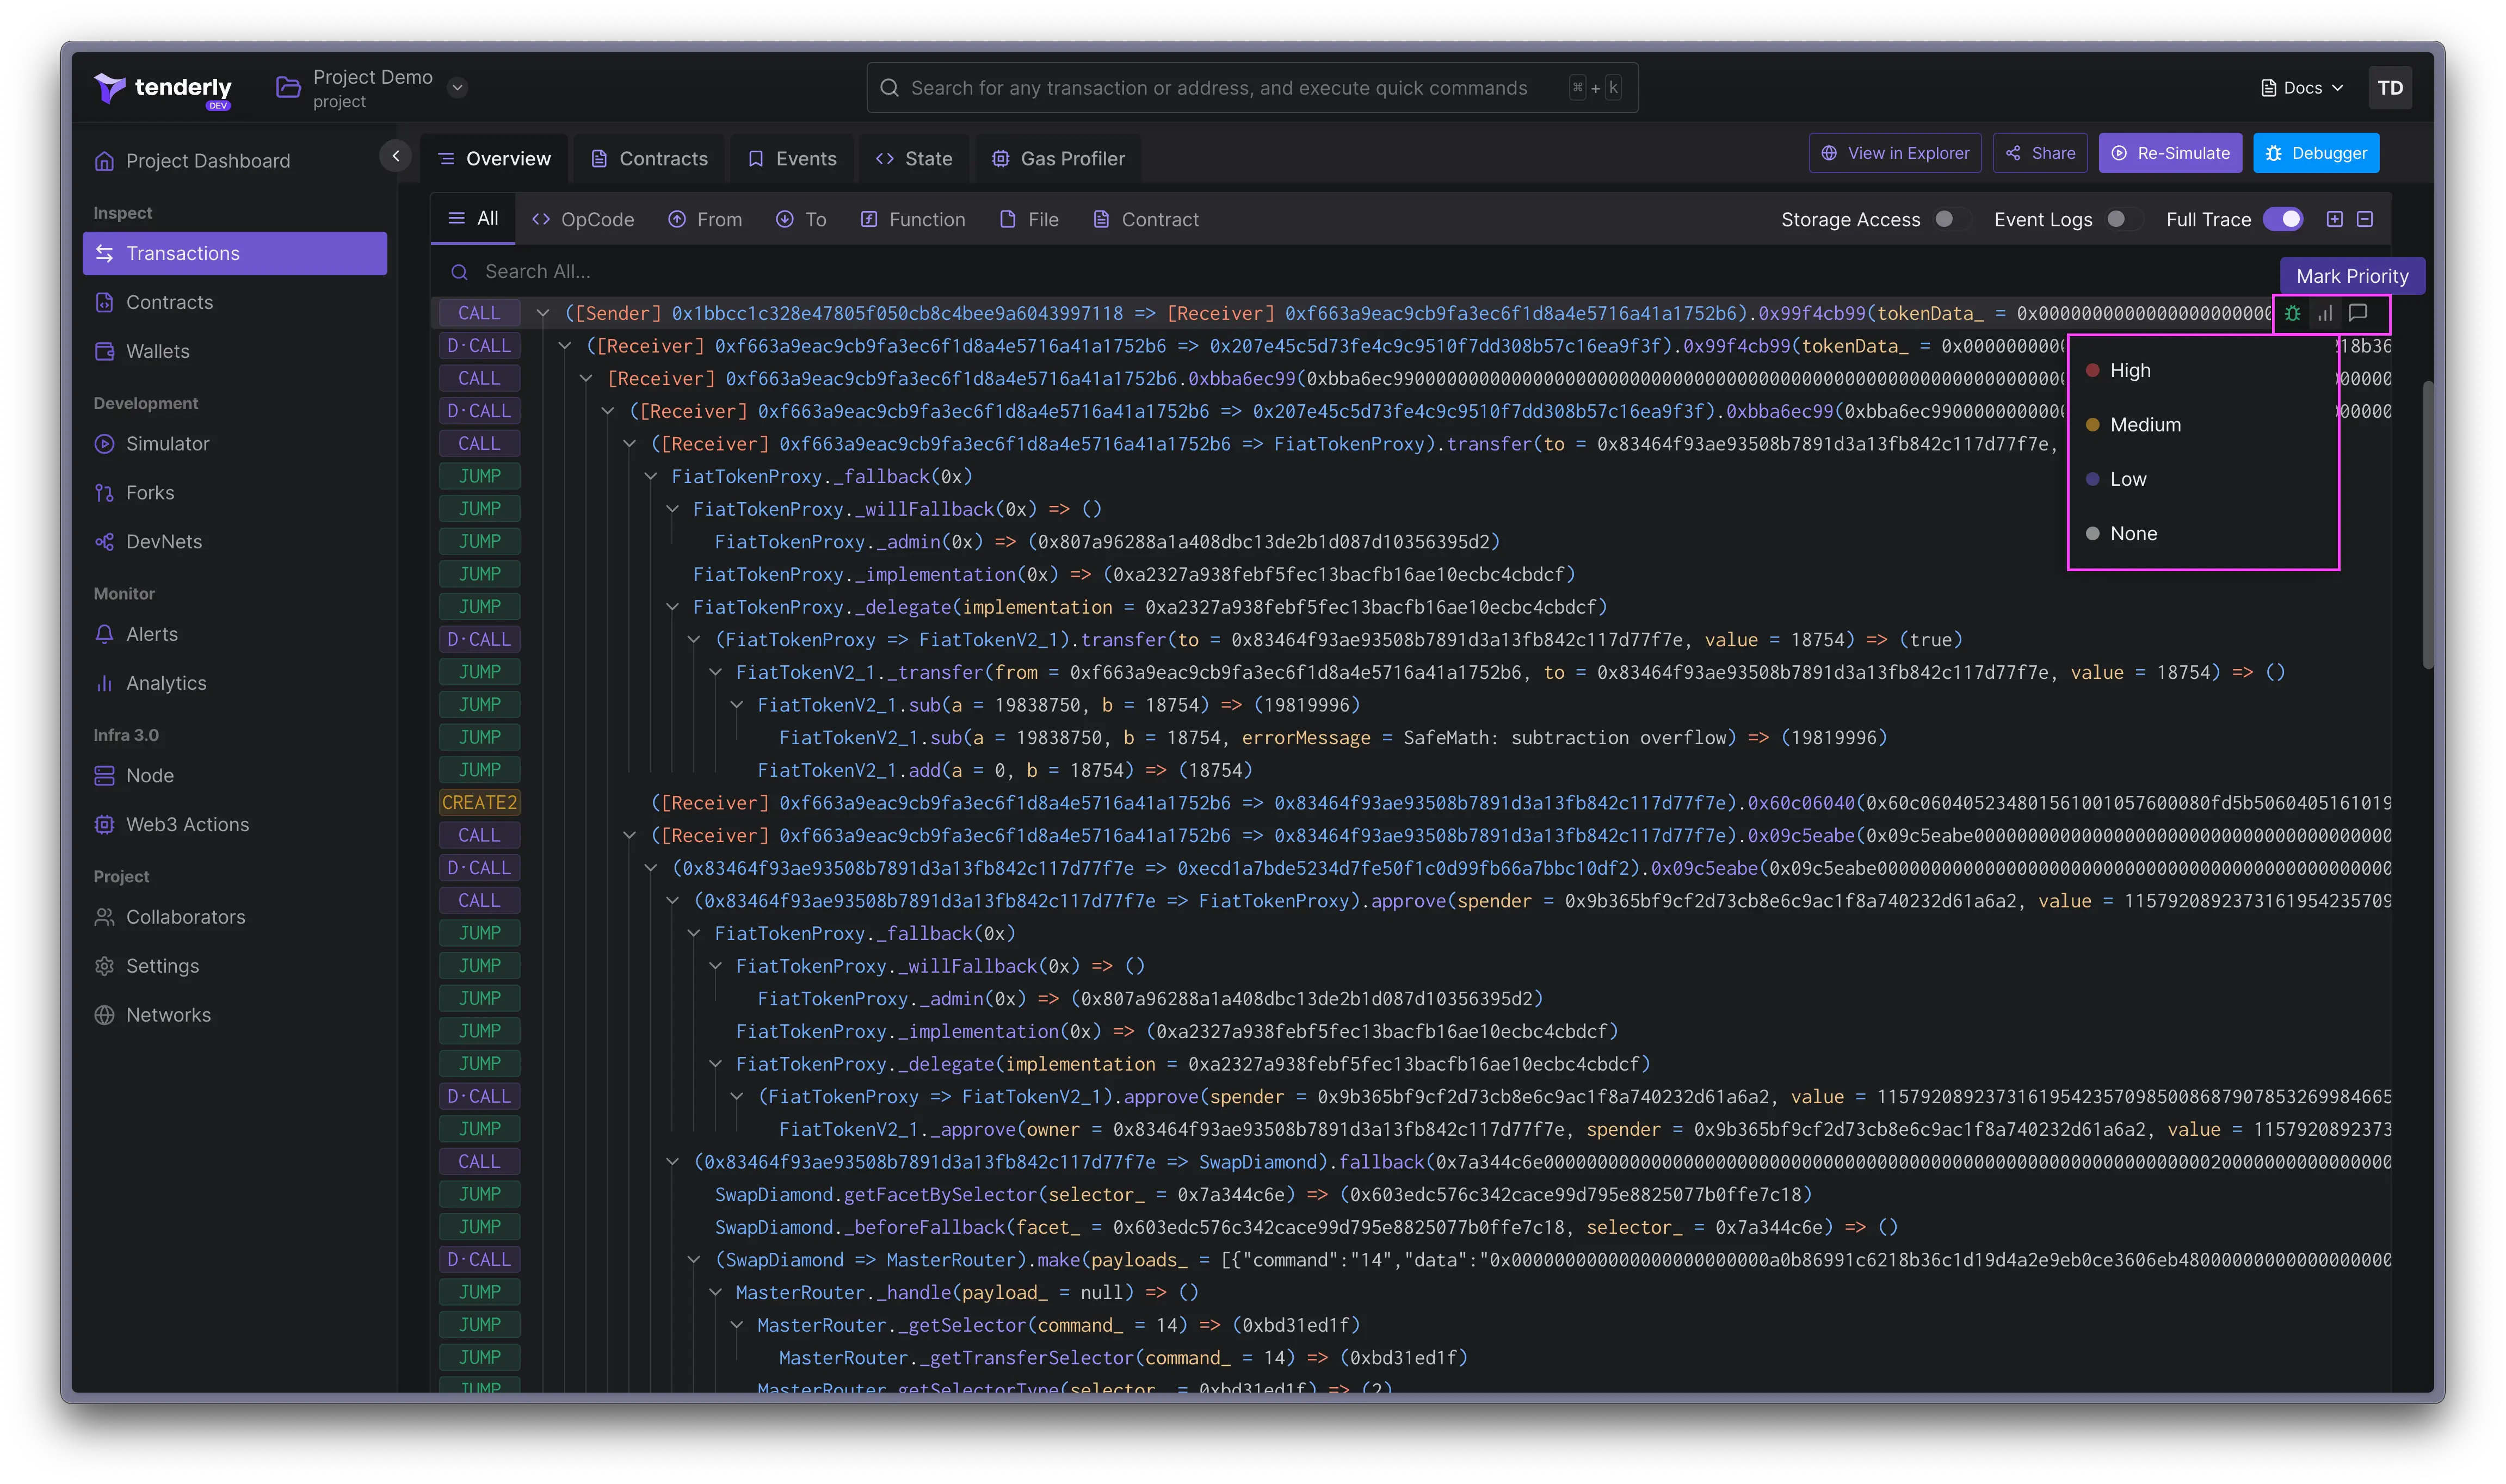 prioritization सुविधा तब सहायक होती है जब आप trace में एक समस्याग्रस्त call देखते हैं और अपनी टीम को जाँच करने के लिए सचेत करना चाहते हैं।
## Tokens transferred
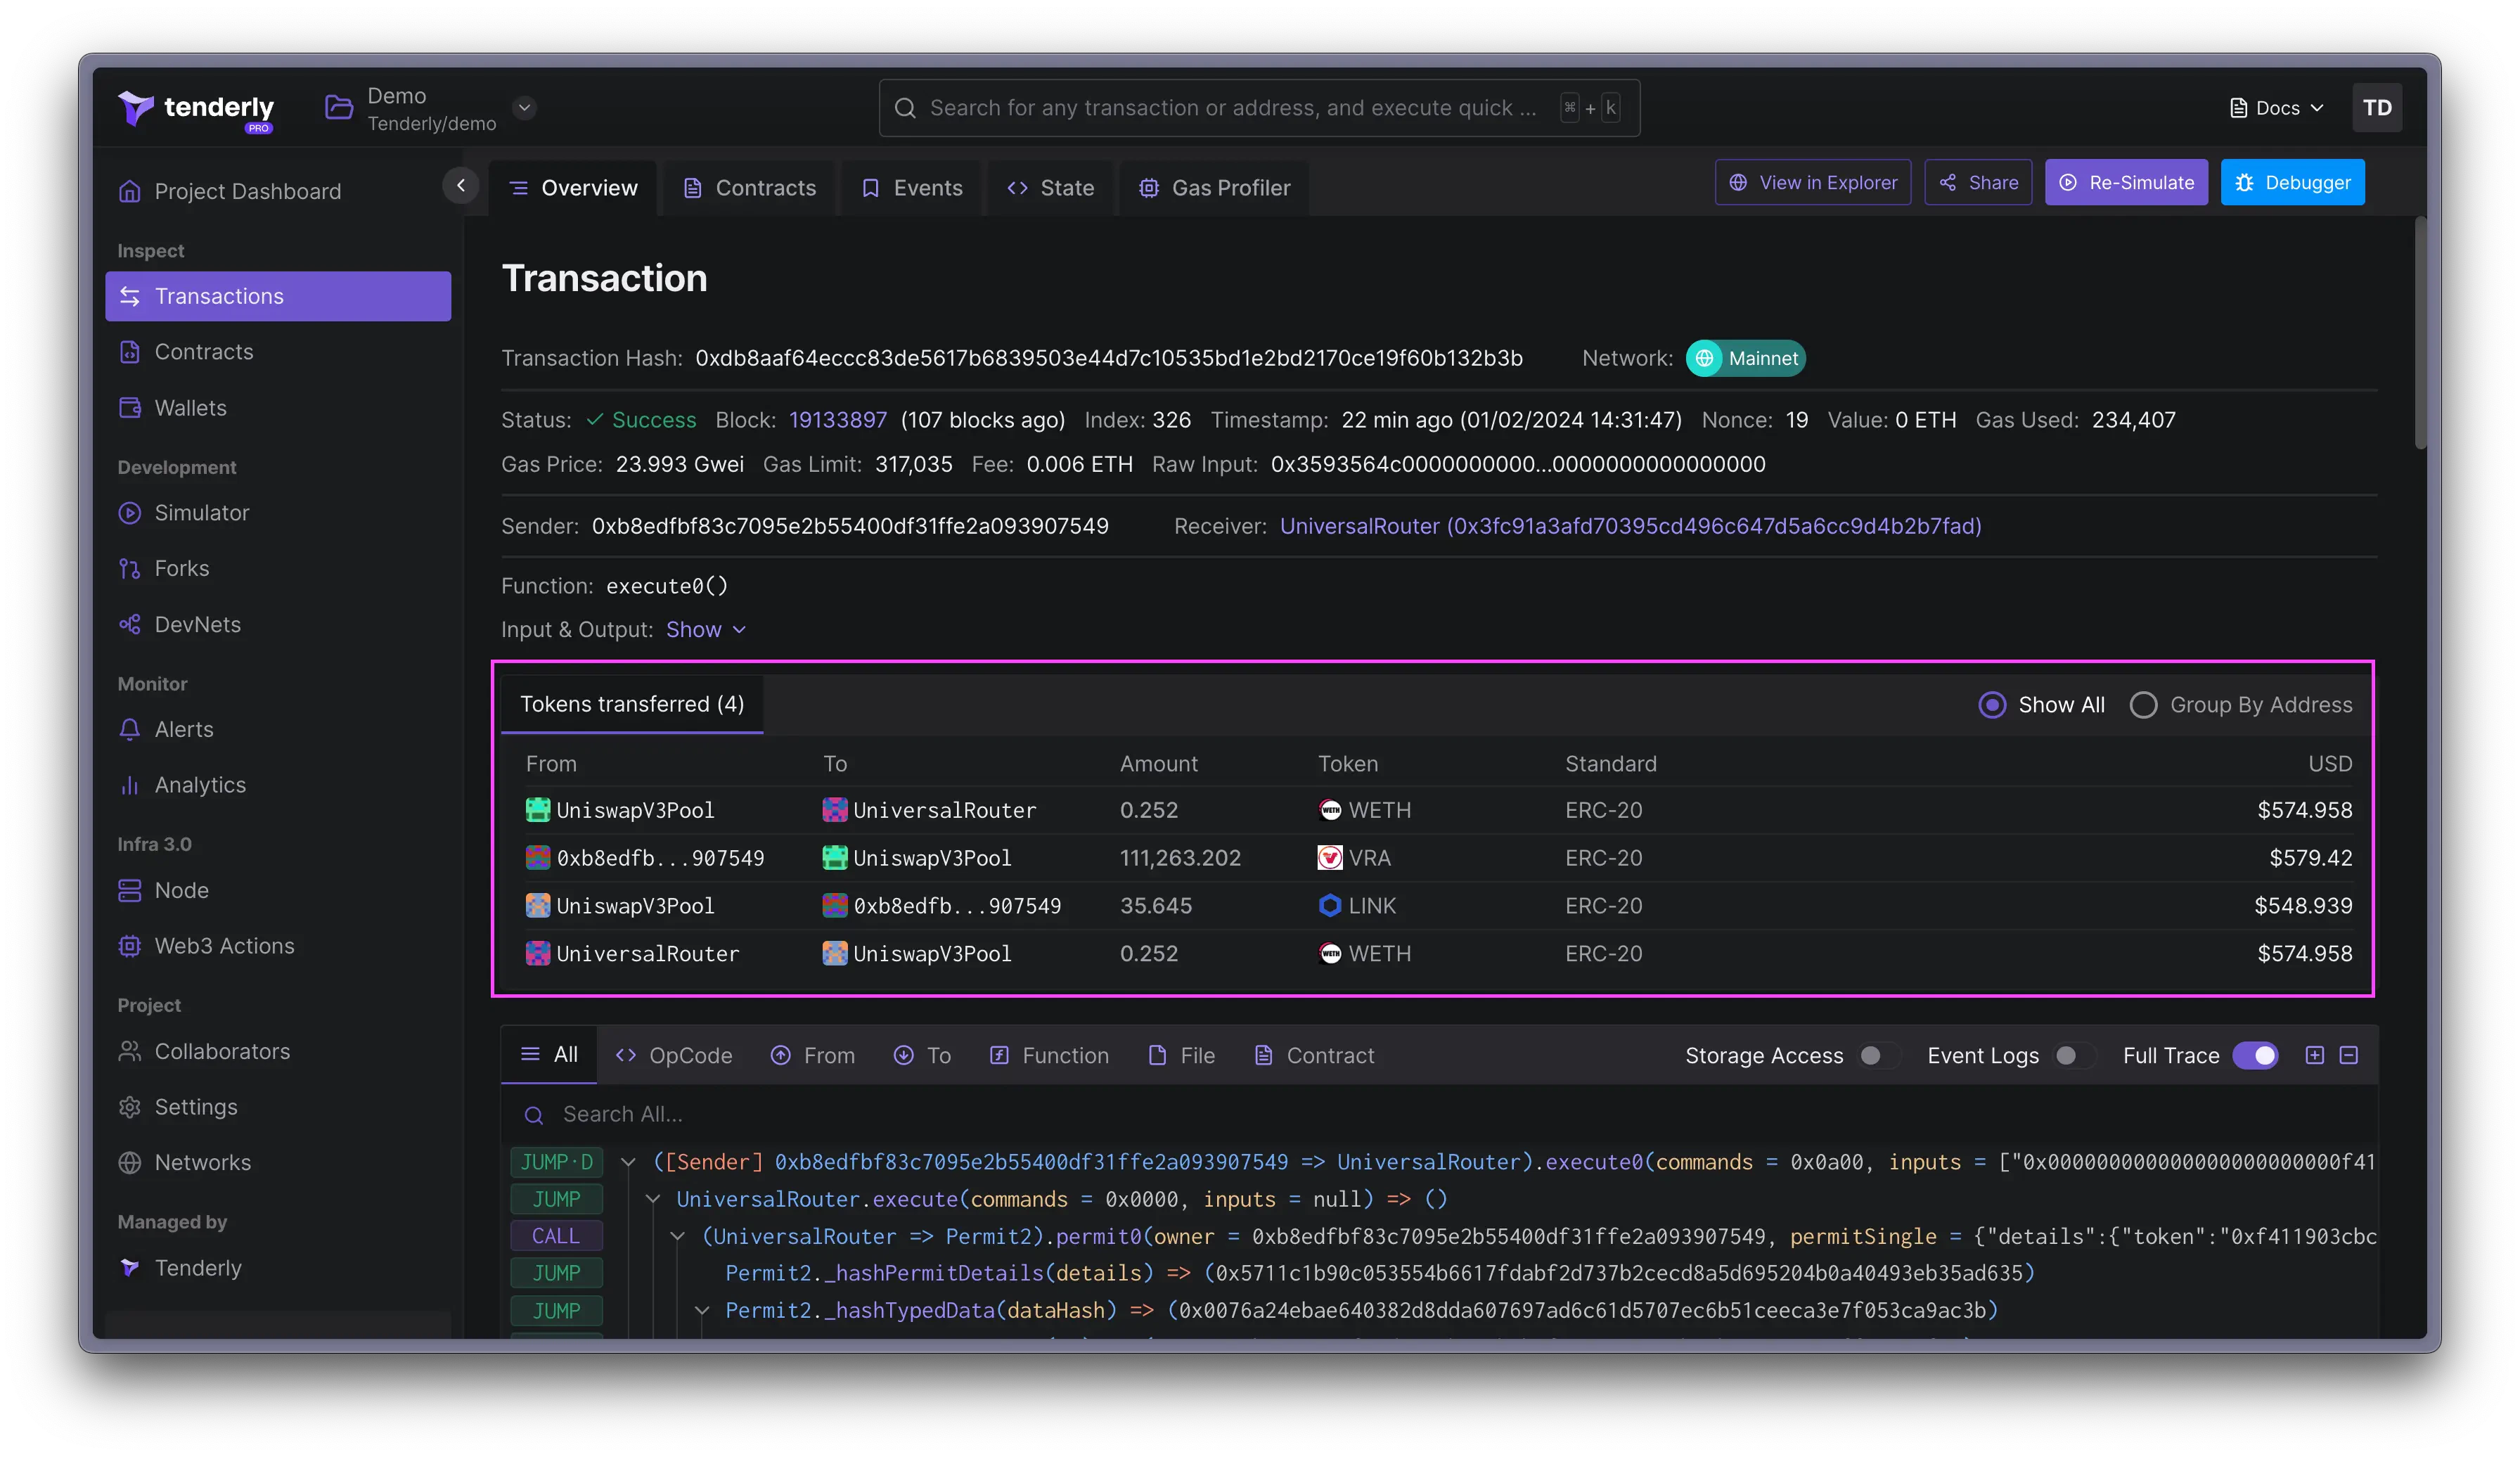
**Tokens Transfers** पैनल transaction के साथ हुए सभी asset transfers को दिखाता है, जिसमें CoinGecko डेटा का उपयोग करके डॉलर में परिवर्तित balance और asset परिवर्तन शामिल हैं।
prioritization सुविधा तब सहायक होती है जब आप trace में एक समस्याग्रस्त call देखते हैं और अपनी टीम को जाँच करने के लिए सचेत करना चाहते हैं।
## Tokens transferred
**Tokens Transfers** पैनल transaction के साथ हुए सभी asset transfers को दिखाता है, जिसमें CoinGecko डेटा का उपयोग करके डॉलर में परिवर्तित balance और asset परिवर्तन शामिल हैं।
 ## Fund Flow
**Fund Flow** tab सभी token transfers को एक इंटरैक्टिव directed graph के रूप में विज़ुअलाइज़ करता है। प्रत्येक address एक node है, प्रत्येक transfer एक edge है, और layout execution के दौरान assets द्वारा लिया गया पूरा path दिखाता है। इसका उपयोग multi-hop swaps, flash loans, या किसी भी transaction को ट्रेस करने के लिए करें जहाँ एक flat transfer सूची follow करना कठिन है।
## Involved contracts
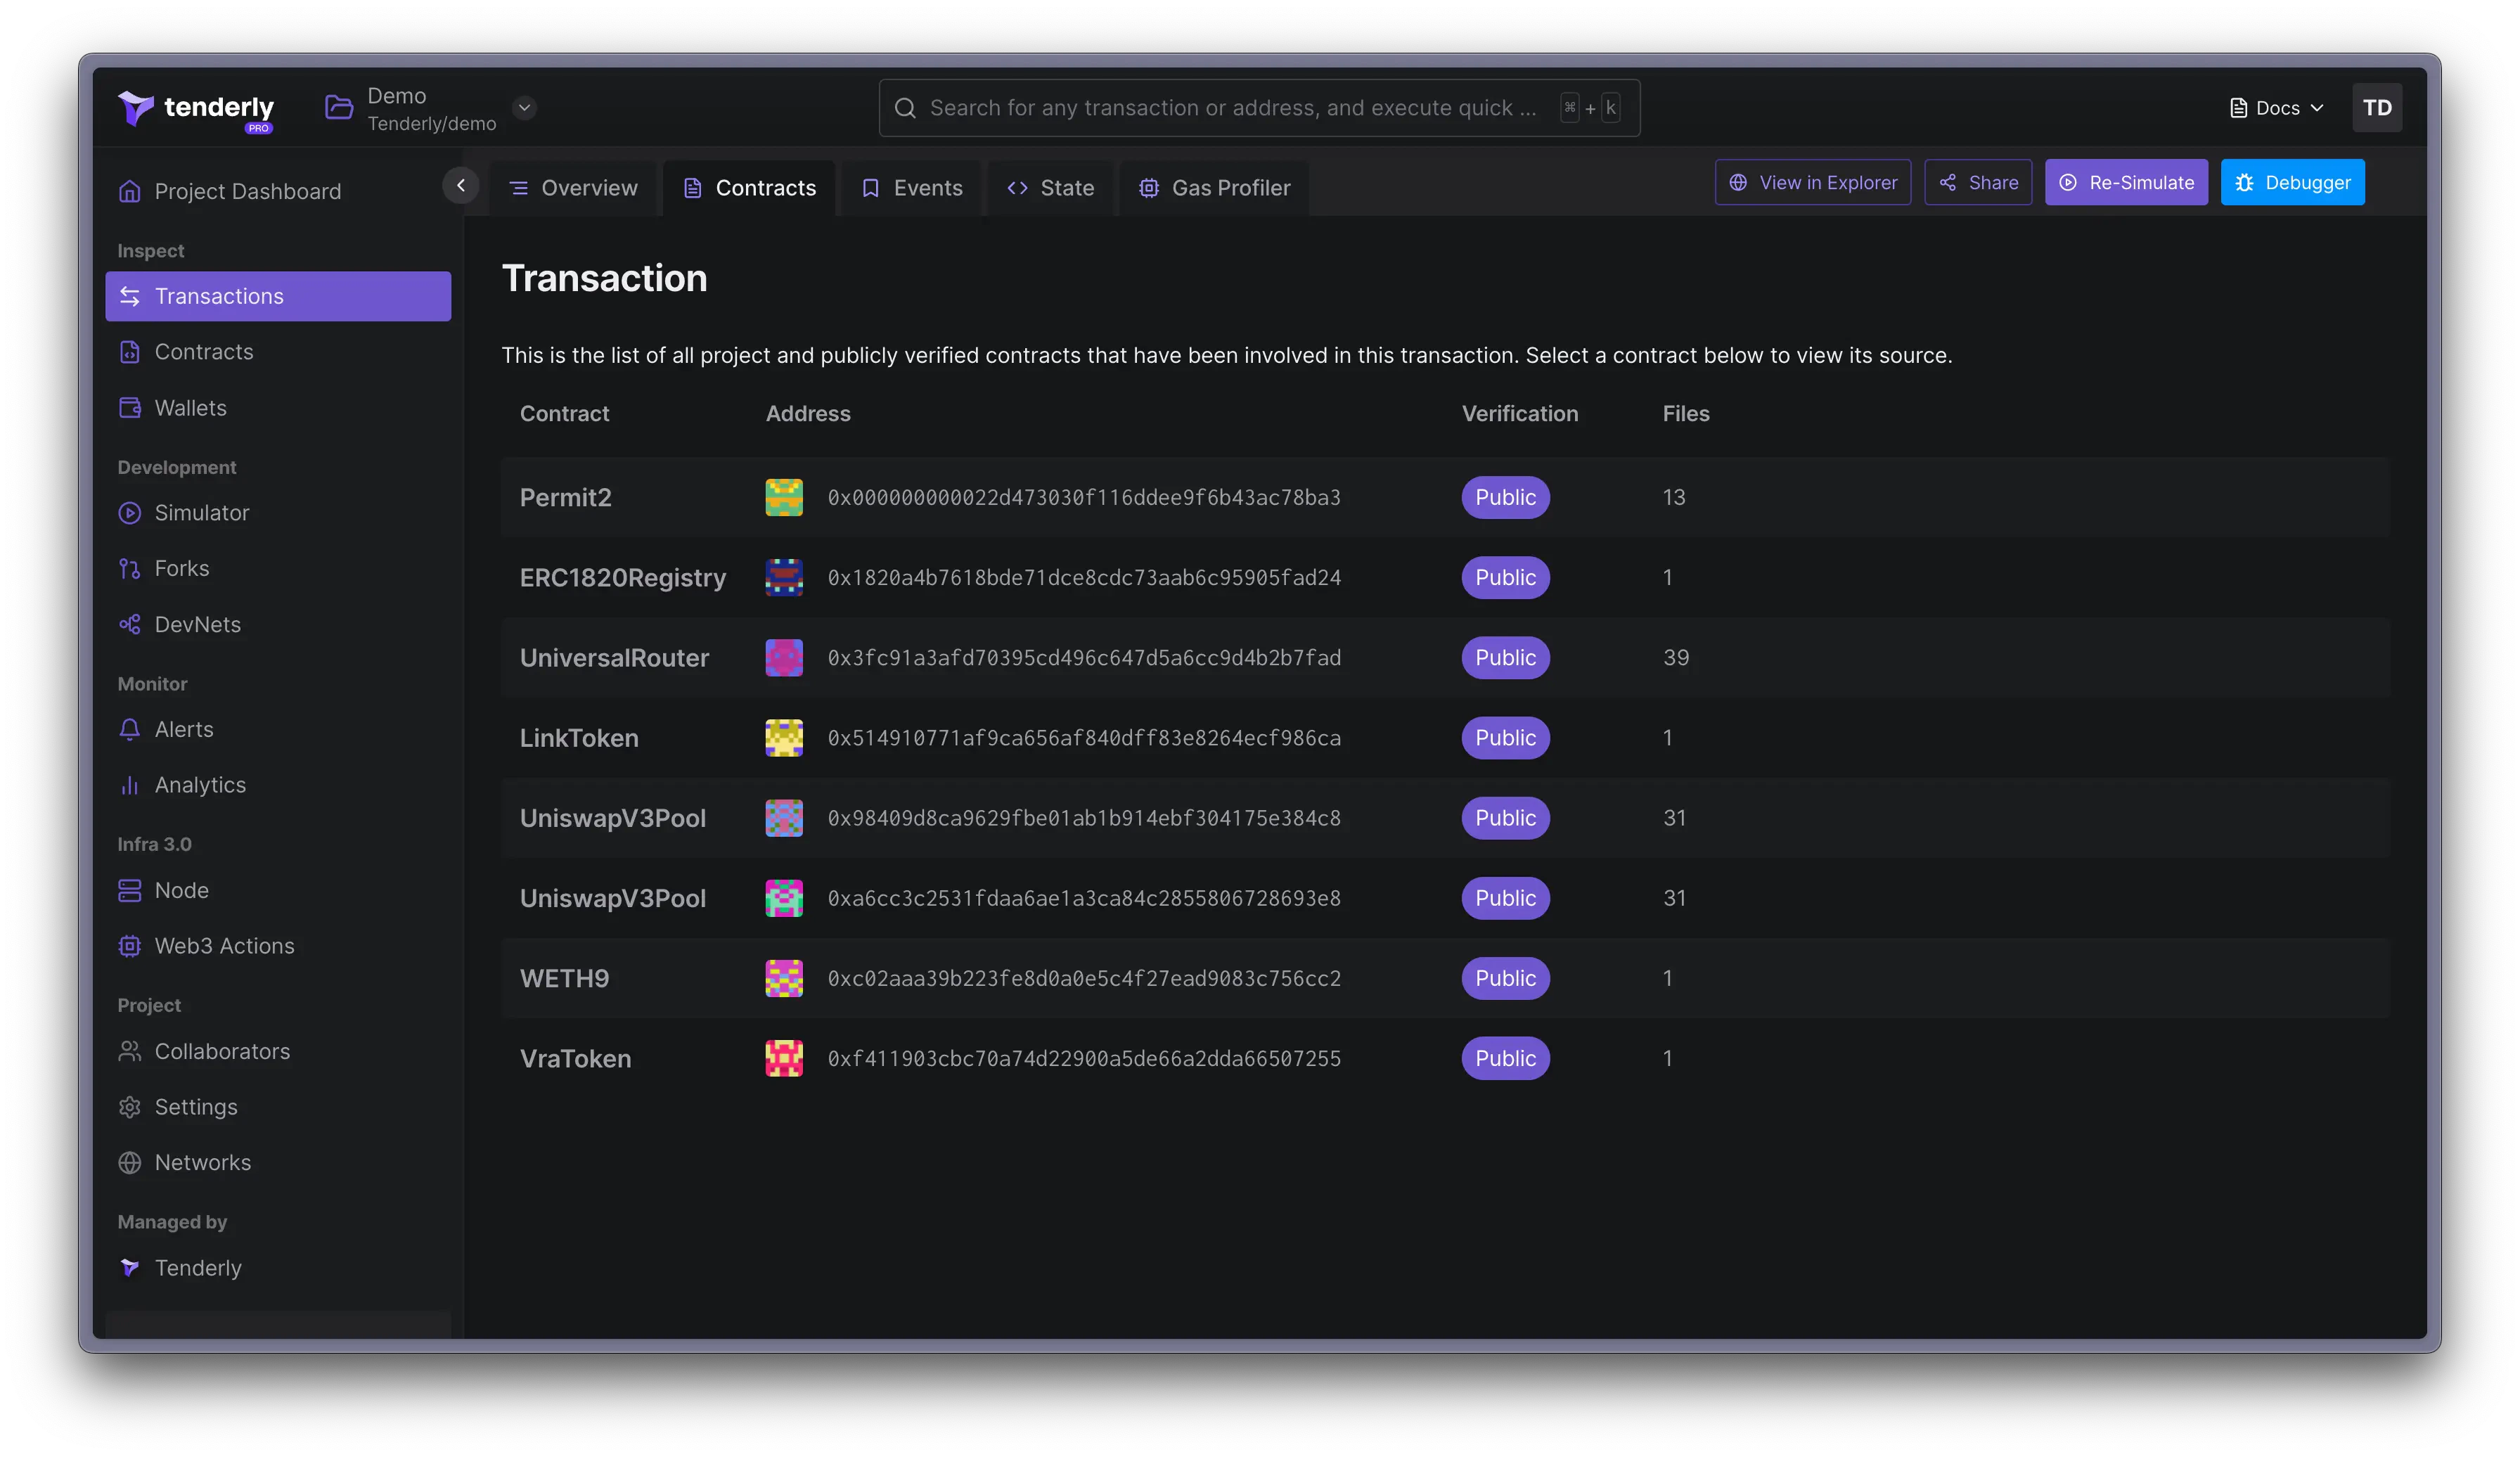
**Contracts** tab में उन सभी contracts की सूची होती है जो transaction execution में शामिल थे। इसके source code का निरीक्षण करने के लिए किसी विशिष्ट contract पर क्लिक करें।
## Fund Flow
**Fund Flow** tab सभी token transfers को एक इंटरैक्टिव directed graph के रूप में विज़ुअलाइज़ करता है। प्रत्येक address एक node है, प्रत्येक transfer एक edge है, और layout execution के दौरान assets द्वारा लिया गया पूरा path दिखाता है। इसका उपयोग multi-hop swaps, flash loans, या किसी भी transaction को ट्रेस करने के लिए करें जहाँ एक flat transfer सूची follow करना कठिन है।
## Involved contracts
**Contracts** tab में उन सभी contracts की सूची होती है जो transaction execution में शामिल थे। इसके source code का निरीक्षण करने के लिए किसी विशिष्ट contract पर क्लिक करें।
 ## Emitted events
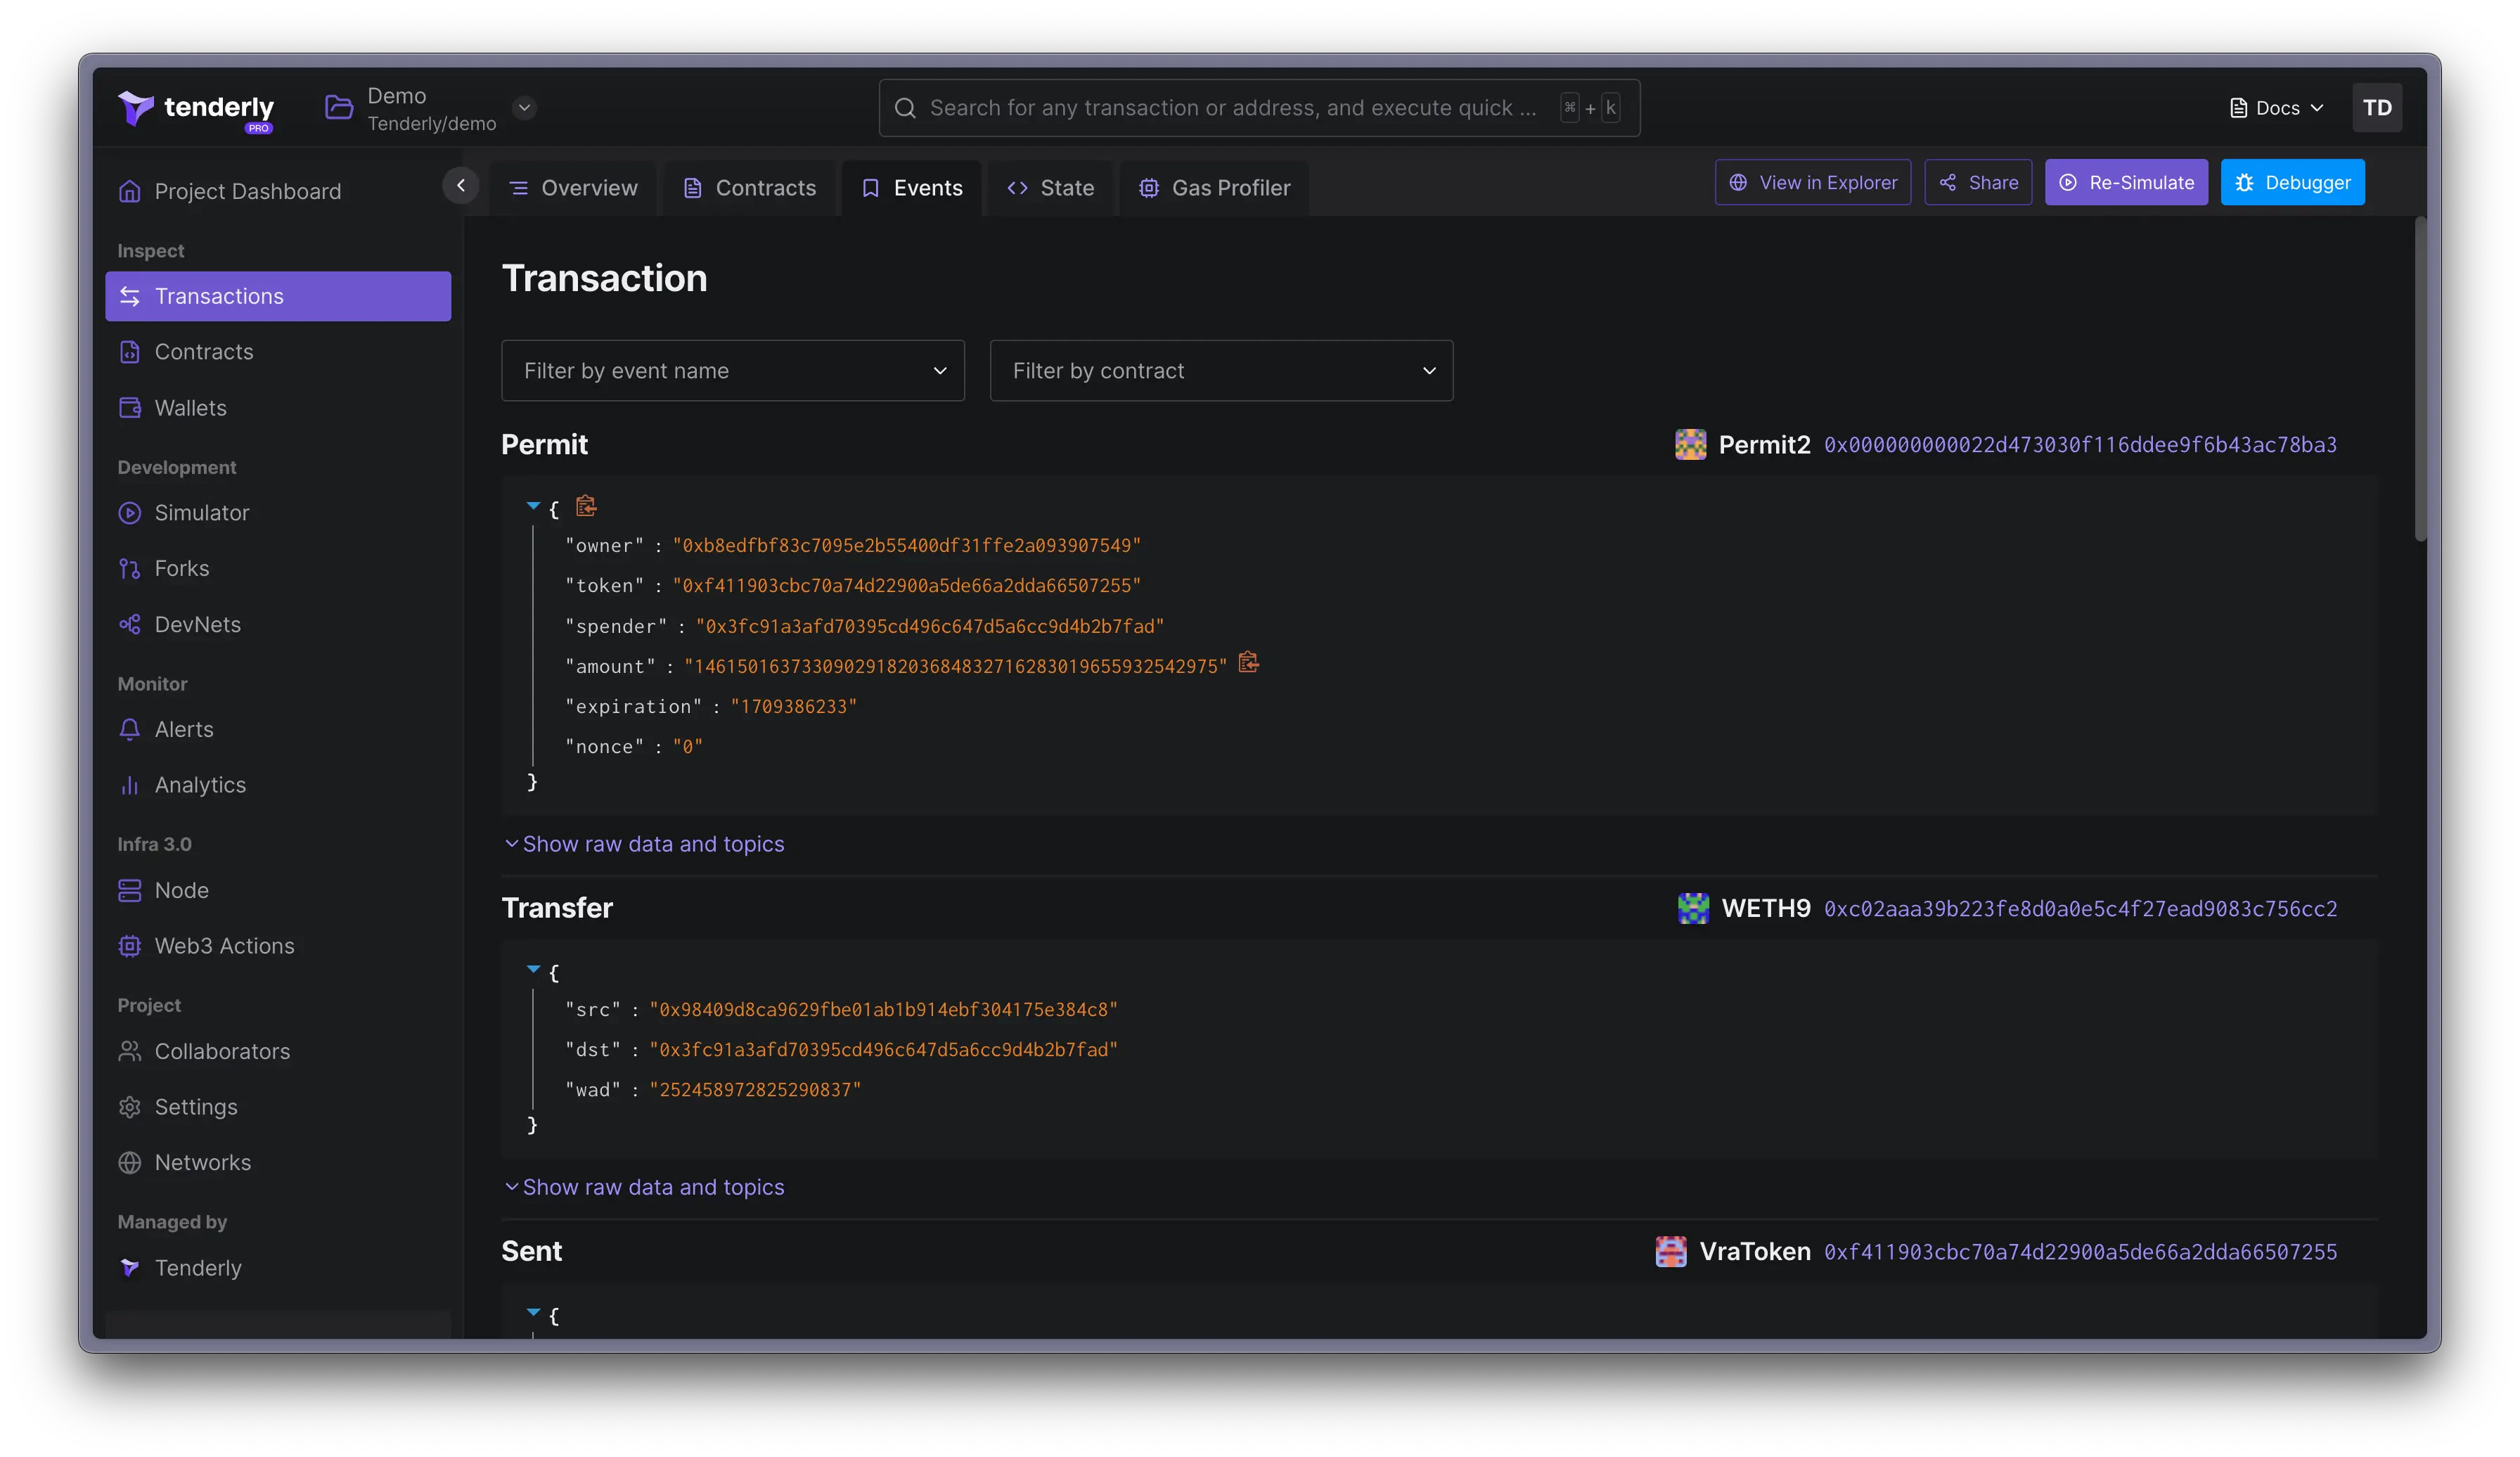
**Events** tab उन सभी events को सूचीबद्ध करता है जो transaction के परिणामस्वरूप हुईं। यह वही डेटा है जो आप call trace में Events Logs टॉगल चालू होने पर देखते हैं। प्रदर्शित डेटा का प्रारूप अलग है। यदि contract verified है, तो आपको decoded डेटा दिखाई देगा, लेकिन raw डेटा भी उपलब्ध है।
## Emitted events
**Events** tab उन सभी events को सूचीबद्ध करता है जो transaction के परिणामस्वरूप हुईं। यह वही डेटा है जो आप call trace में Events Logs टॉगल चालू होने पर देखते हैं। प्रदर्शित डेटा का प्रारूप अलग है। यदि contract verified है, तो आपको decoded डेटा दिखाई देगा, लेकिन raw डेटा भी उपलब्ध है।
 ## State changes
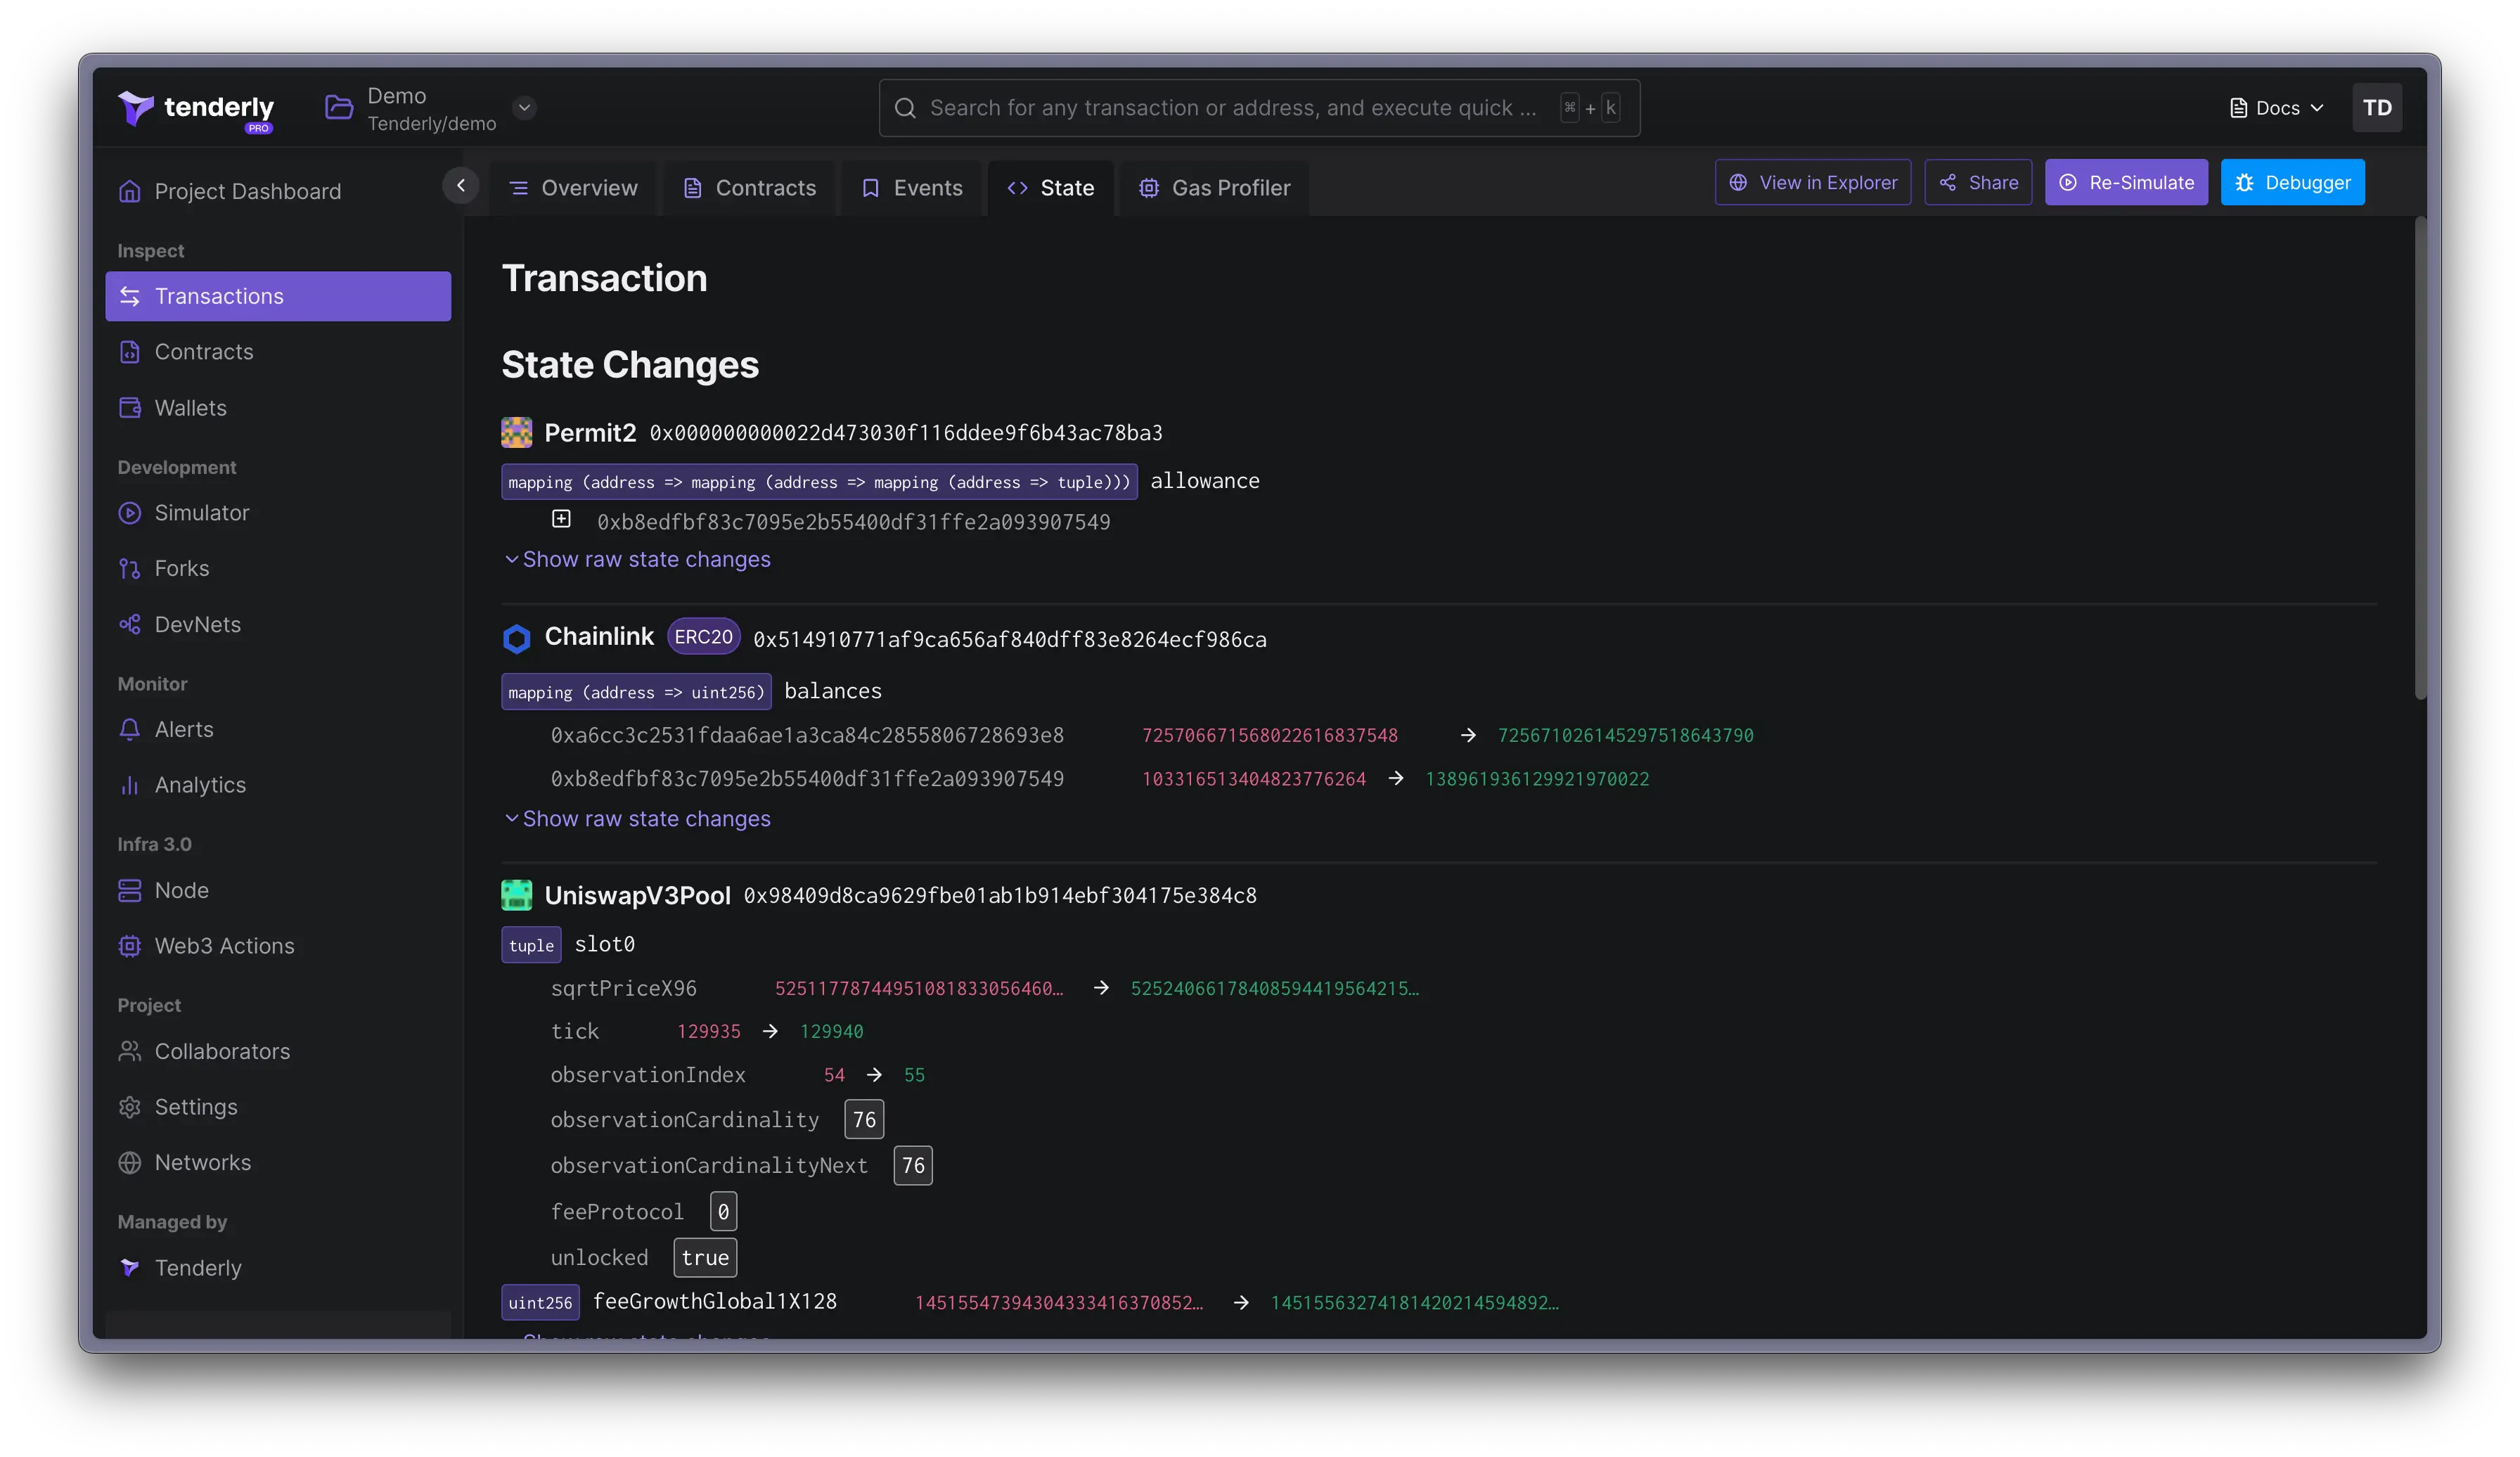
**State** tab उन सभी events या variables को दिखाता है जिन्होंने किसी न किसी तरह से blockchain की state को बदल दिया है। इसमें पुराने और नए values शामिल हैं। सारा डेटा decoded है लेकिन आप raw state परिवर्तन भी देख सकते हैं।
## State changes
**State** tab उन सभी events या variables को दिखाता है जिन्होंने किसी न किसी तरह से blockchain की state को बदल दिया है। इसमें पुराने और नए values शामिल हैं। सारा डेटा decoded है लेकिन आप raw state परिवर्तन भी देख सकते हैं।
 आप RPC के माध्यम से state परिवर्तनों के बारे में डेटा प्राप्त कर सकते हैं। [`tenderly_trace`](/node-rpc/rpc-reference?network=ethereum-mainnet\&method=tenderly_traceTransaction),
[`tenderly_simulate`](/node-rpc/rpc-reference?network=ethereum-mainnet\&method=tenderly_simulateTransaction) और
[`tenderly_simulateBundle`](/node-rpc/rpc-reference?network=ethereum-mainnet\&method=tenderly_simulateBundle) RPC methods के बारे में अधिक जानें।
## Gas Profiler
**Gas Profiler** tab एक visual तरीका प्रदान करता है यह देखने के लिए कि transaction को execute करने के लिए gas का उपयोग कैसे, कहाँ, और कितना किया गया था। यह डेटा function और opcode द्वारा gas उपयोग के विवरण के साथ एक flame chart के रूप में प्रदर्शित होता है।
आप RPC के माध्यम से state परिवर्तनों के बारे में डेटा प्राप्त कर सकते हैं। [`tenderly_trace`](/node-rpc/rpc-reference?network=ethereum-mainnet\&method=tenderly_traceTransaction),
[`tenderly_simulate`](/node-rpc/rpc-reference?network=ethereum-mainnet\&method=tenderly_simulateTransaction) और
[`tenderly_simulateBundle`](/node-rpc/rpc-reference?network=ethereum-mainnet\&method=tenderly_simulateBundle) RPC methods के बारे में अधिक जानें।
## Gas Profiler
**Gas Profiler** tab एक visual तरीका प्रदान करता है यह देखने के लिए कि transaction को execute करने के लिए gas का उपयोग कैसे, कहाँ, और कितना किया गया था। यह डेटा function और opcode द्वारा gas उपयोग के विवरण के साथ एक flame chart के रूप में प्रदर्शित होता है।
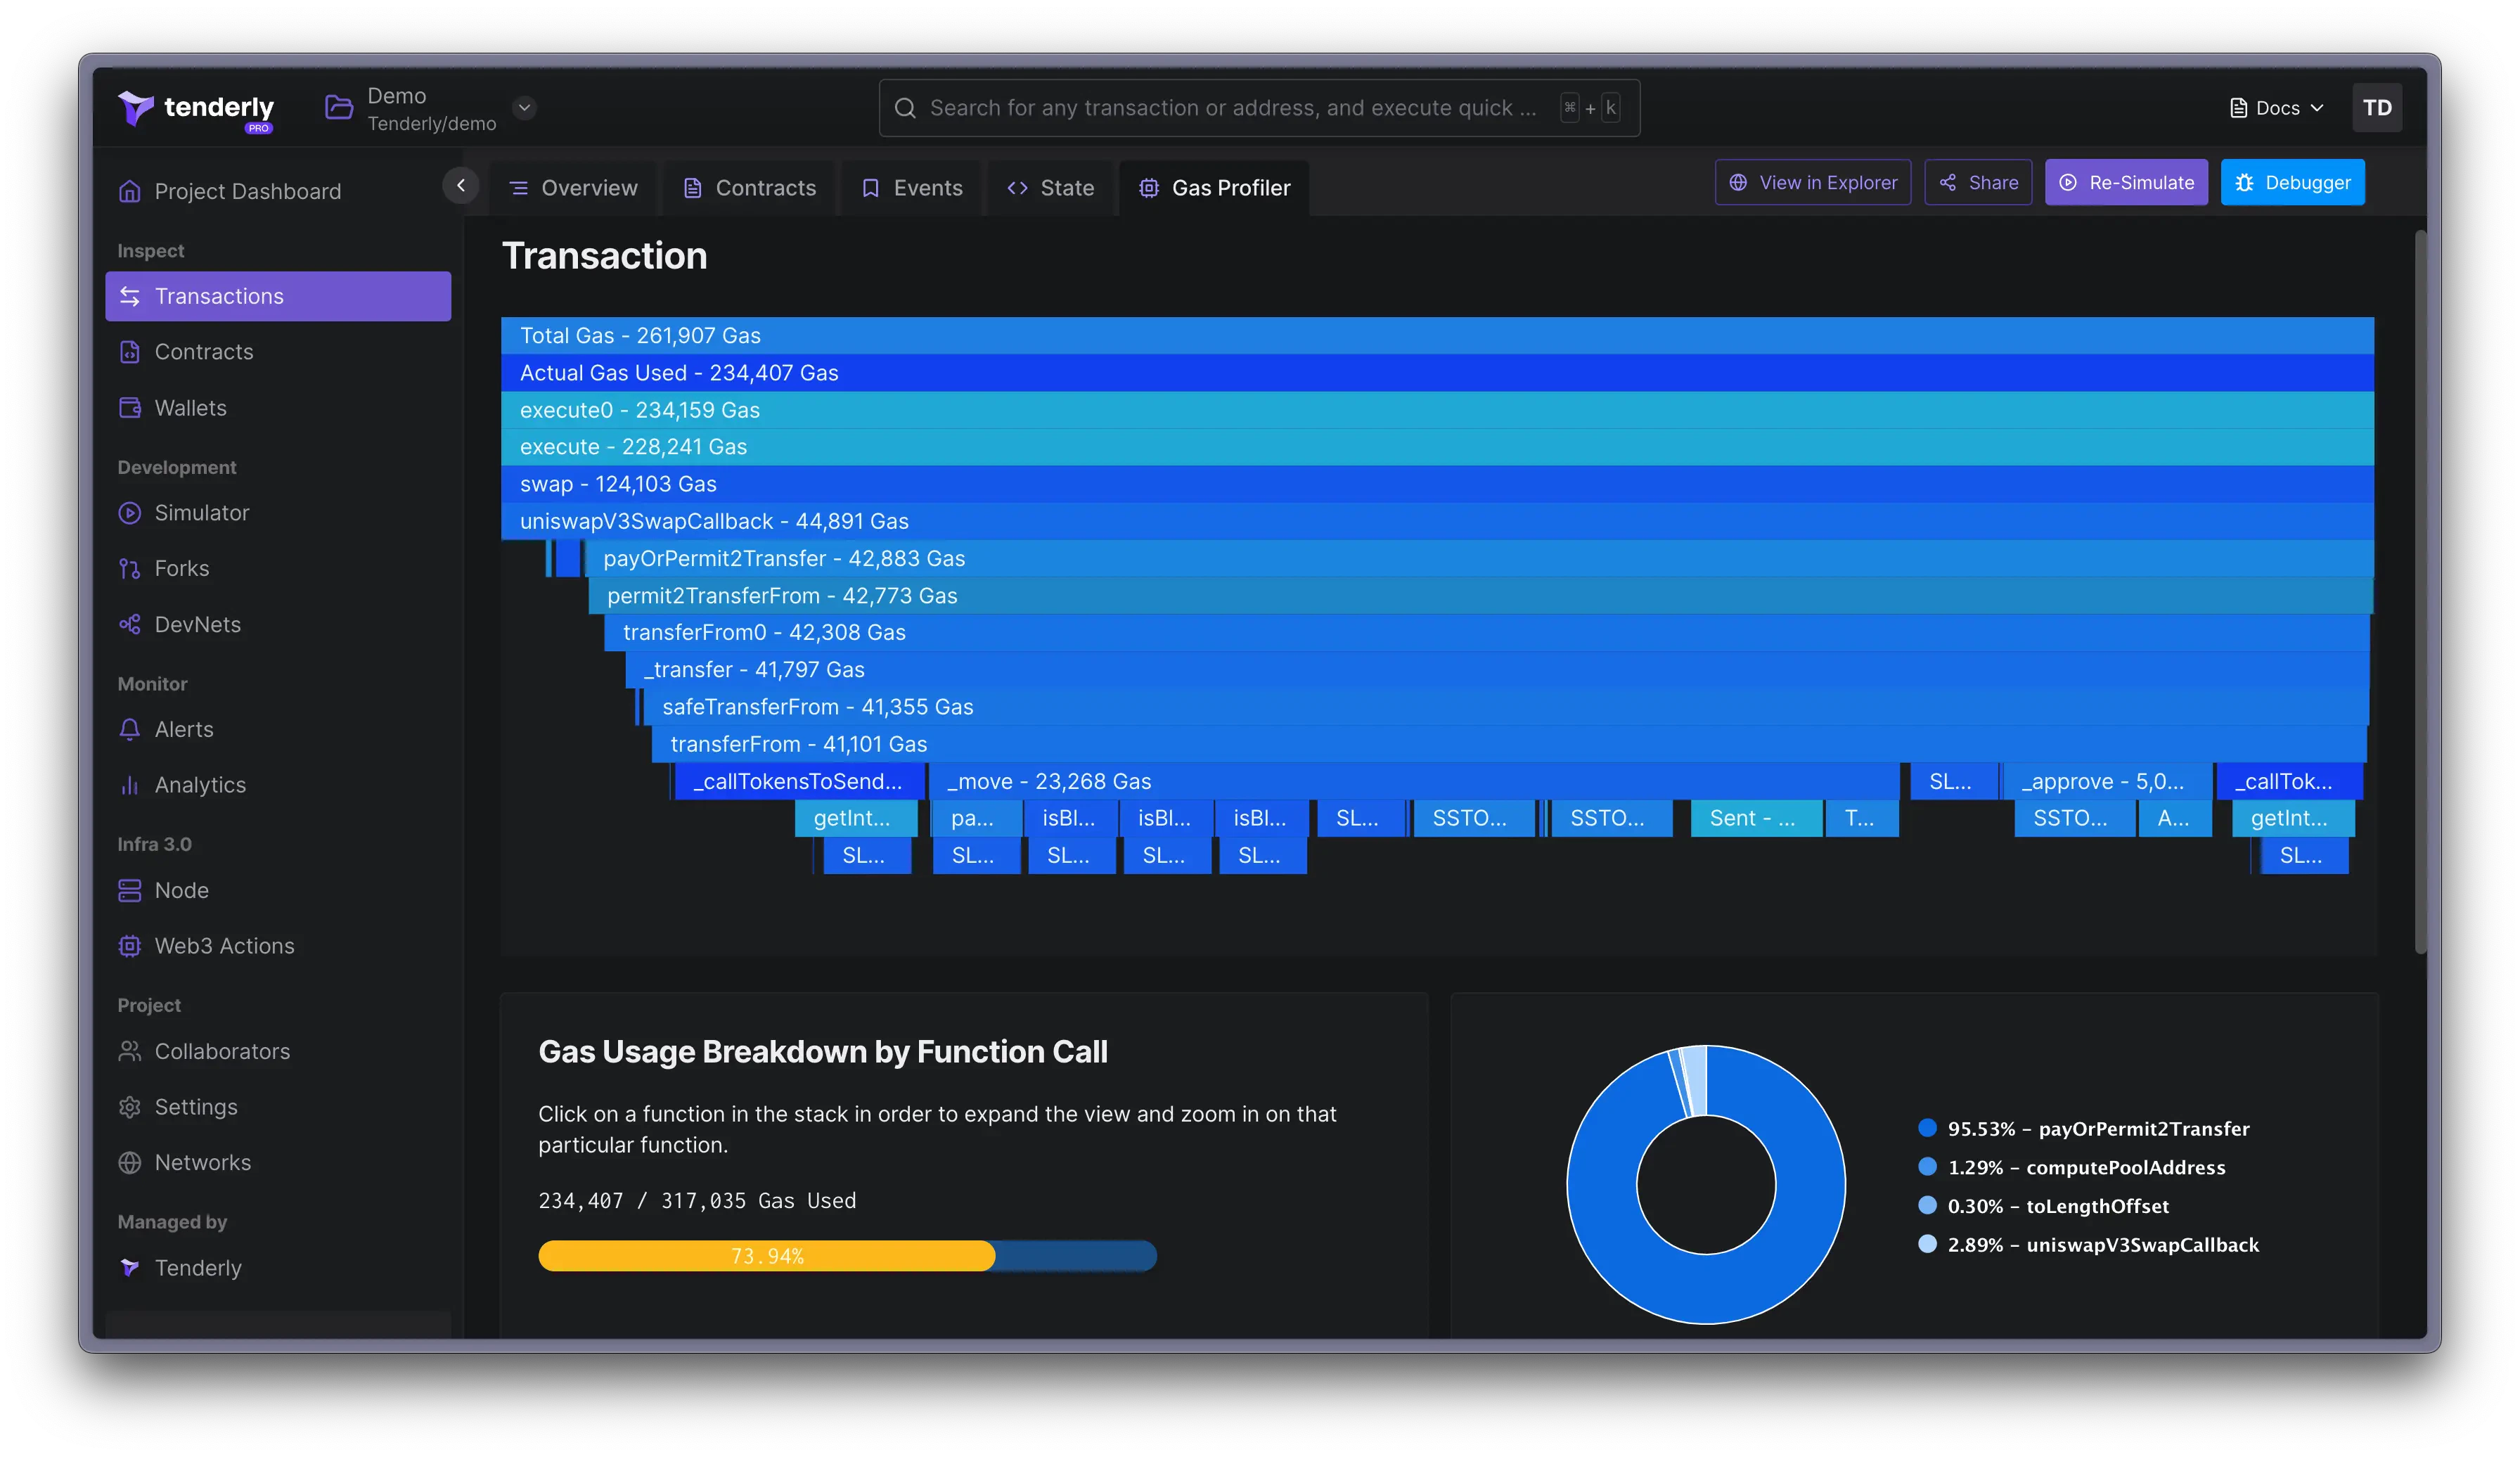 आप यह देखने के लिए किसी भी functions या opcodes पर क्लिक कर सकते हैं कि gas का उपयोग कैसे किया गया।
जब आप समस्याग्रस्त functions को debug करना शुरू करने और अपने smart contract द्वारा gas की खपत के तरीके को अनुकूलित करने के लिए तैयार हों, तो **View in Debugger** पर क्लिक करें। Gas Profiler आपको उपयोग किए गए gas और कुल उपयोग किए गए gas में अंतर्दृष्टि देता है।
Gas Profiler का उपयोग कैसे करें और gas खपत की गणना कैसे की जाती है, यह जानने के लिए इस विस्तृत गाइड को देखें:
आप यह देखने के लिए किसी भी functions या opcodes पर क्लिक कर सकते हैं कि gas का उपयोग कैसे किया गया।
जब आप समस्याग्रस्त functions को debug करना शुरू करने और अपने smart contract द्वारा gas की खपत के तरीके को अनुकूलित करने के लिए तैयार हों, तो **View in Debugger** पर क्लिक करें। Gas Profiler आपको उपयोग किए गए gas और कुल उपयोग किए गए gas में अंतर्दृष्टि देता है।
Gas Profiler का उपयोग कैसे करें और gas खपत की गणना कैसे की जाती है, यह जानने के लिए इस विस्तृत गाइड को देखें: