> ## Documentation Index
> Fetch the complete documentation index at: https://docs.tenderly.co/llms.txt
> Use this file to discover all available pages before exploring further.
# Gas Profiler
> 使用交互式火焰图按函数分解 gas 消耗,找出最昂贵的调用,并在 Debugger 中优化 gas 使用。
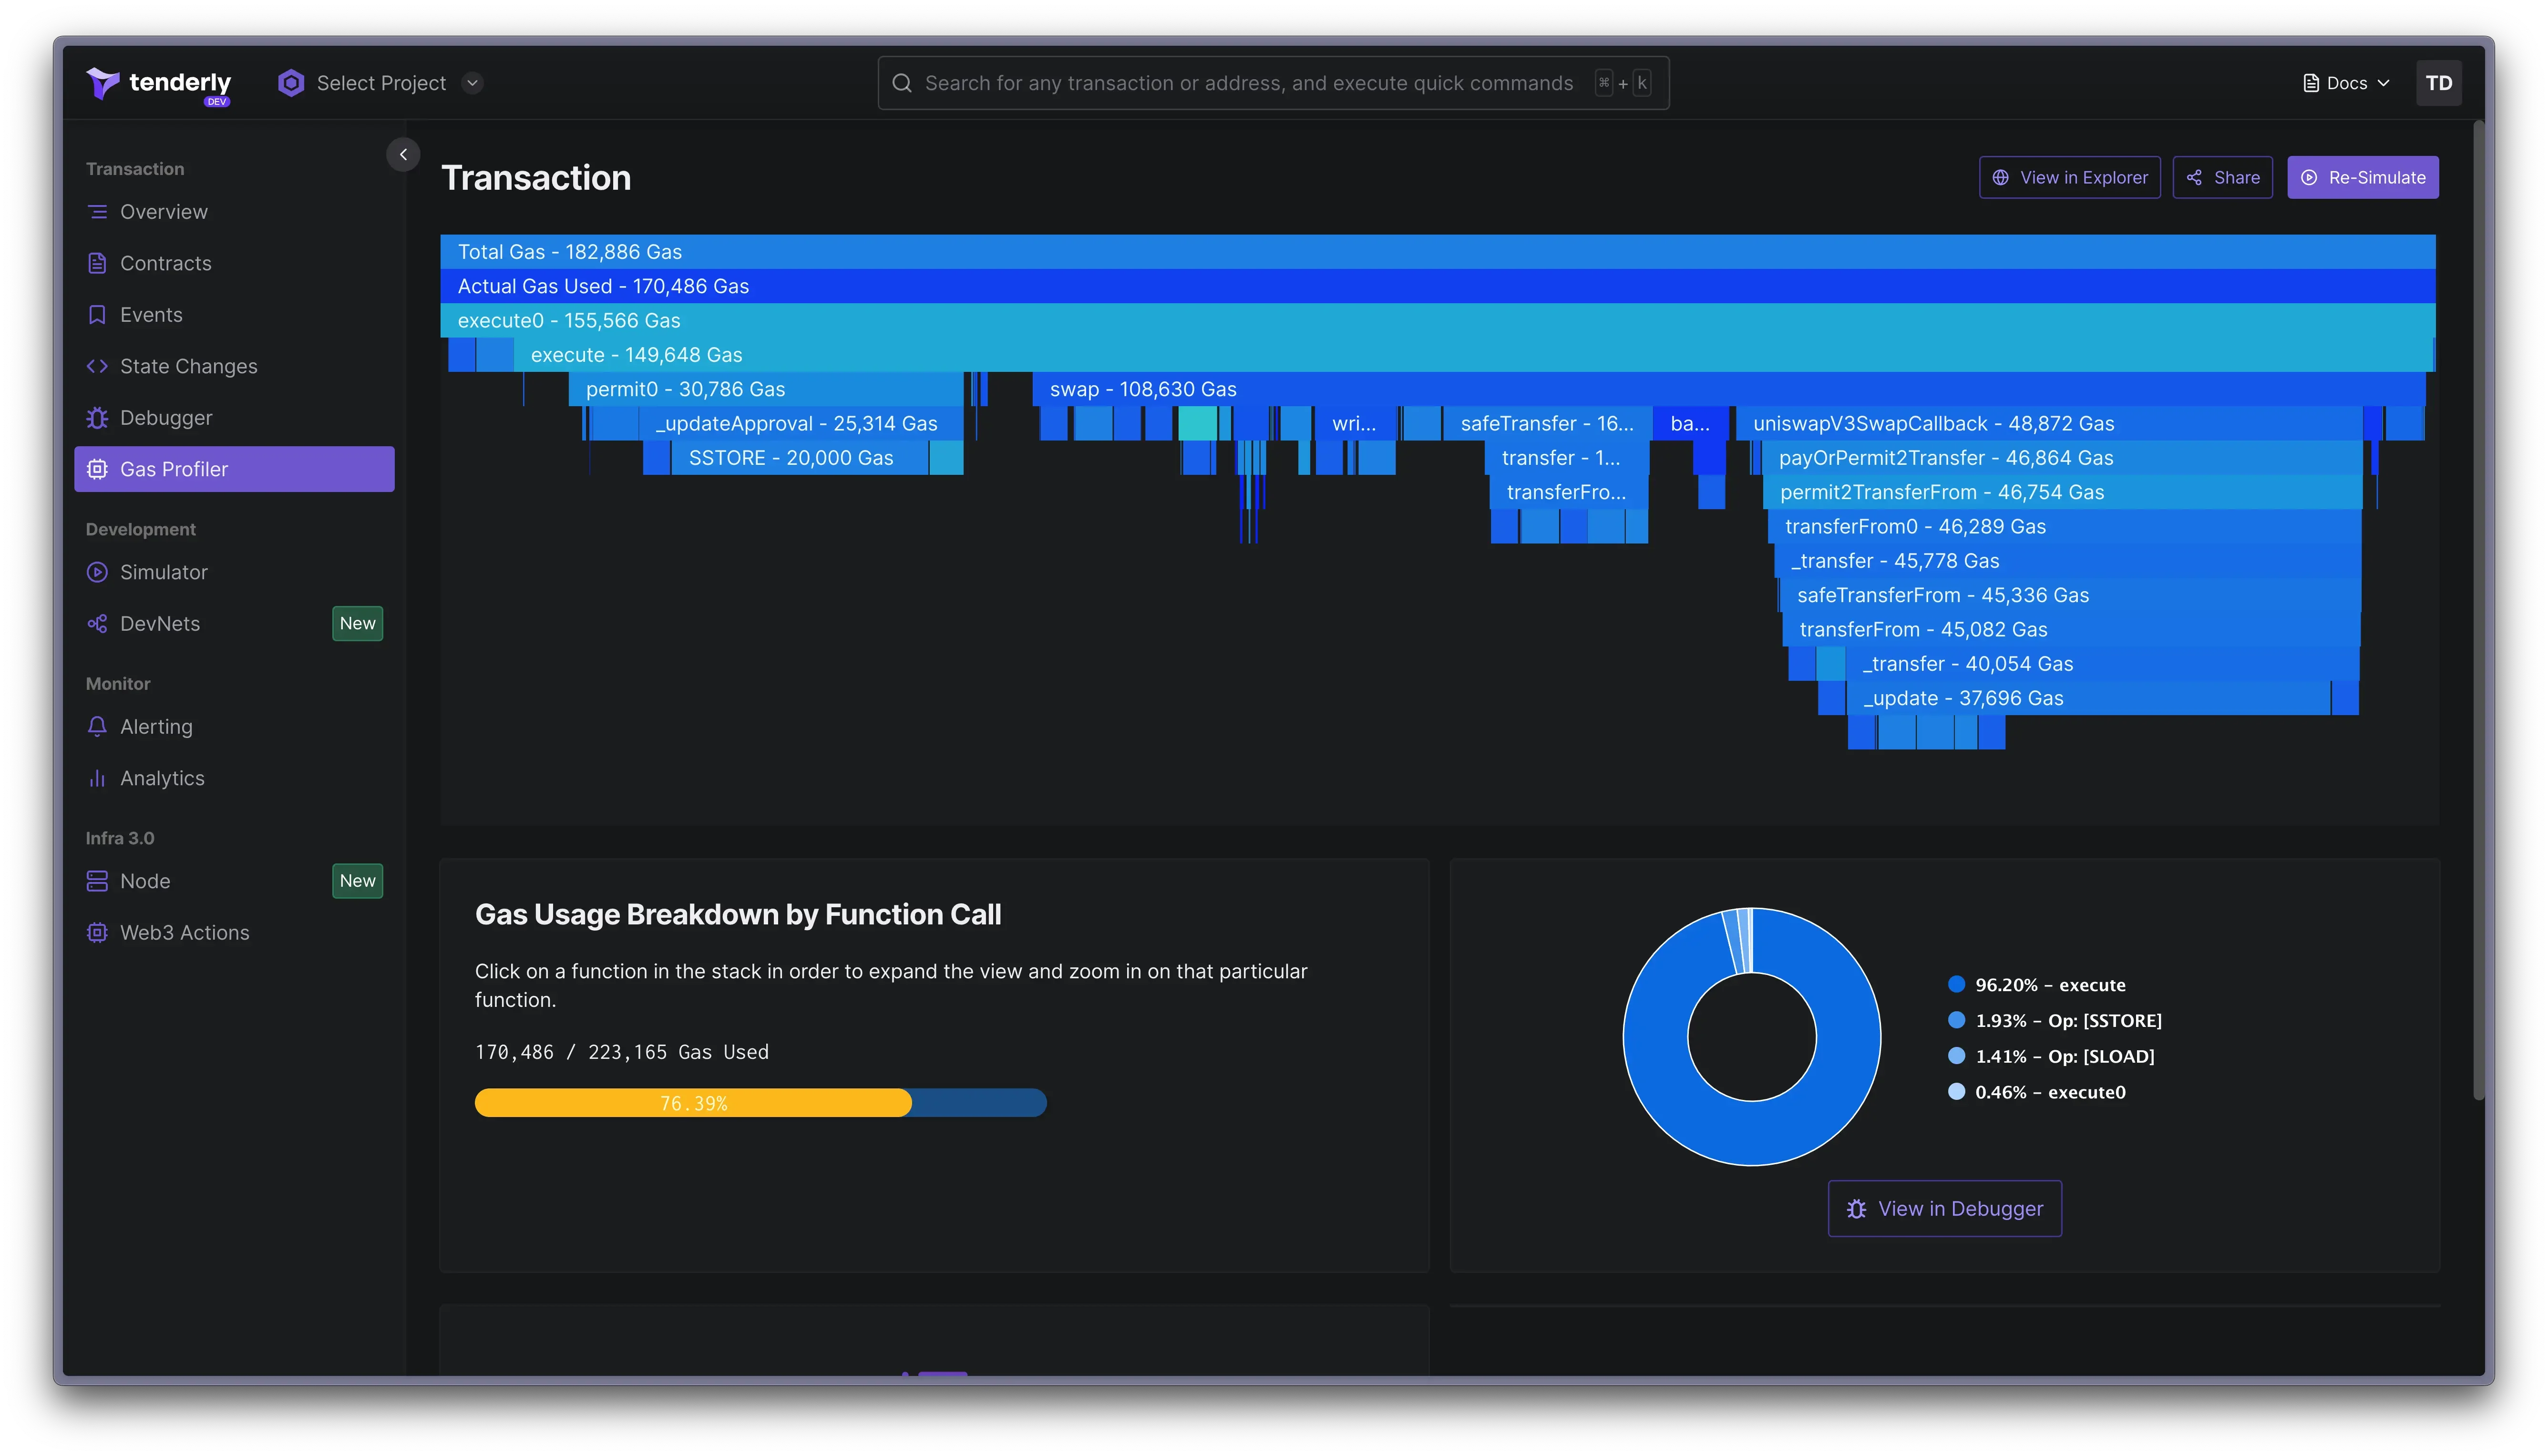
Gas Profiler 为您提供 gas 消耗的明细,展示合约中每个函数在执行期间如何使用 gas。当与 Debugger 和 Simulator 结合使用时,Gas Profiler 构成了 Developer Explorer 的核心。
 ## 开始使用 Gas Profiler
1. 从交易列表页面打开任何交易。试试这个[示例交易](https://dashboard.tenderly.co/tx/1/0x1696cfc031695003b8a58f0379c7f111b34c7612a67681354dc57cb5853c5c63/gas-usage)。
2. 在顶部菜单导航到 **Gas Profiler**,即可查看交互式火焰图,其中包含每个被调用函数(包括内部交易)的详细 gas 使用明细。
3. 点击任何函数以显示其 gas 使用情况的详细视图。
4. 若要深入了解,[在 Debugger 中打开该交易](/debugger/overview)以精确定位 Solidity 文件中负责执行的确切代码行。
## 开始使用 Gas Profiler
1. 从交易列表页面打开任何交易。试试这个[示例交易](https://dashboard.tenderly.co/tx/1/0x1696cfc031695003b8a58f0379c7f111b34c7612a67681354dc57cb5853c5c63/gas-usage)。
2. 在顶部菜单导航到 **Gas Profiler**,即可查看交互式火焰图,其中包含每个被调用函数(包括内部交易)的详细 gas 使用明细。
3. 点击任何函数以显示其 gas 使用情况的详细视图。
4. 若要深入了解,[在 Debugger 中打开该交易](/debugger/overview)以精确定位 Solidity 文件中负责执行的确切代码行。
 ### 优化 gas 使用
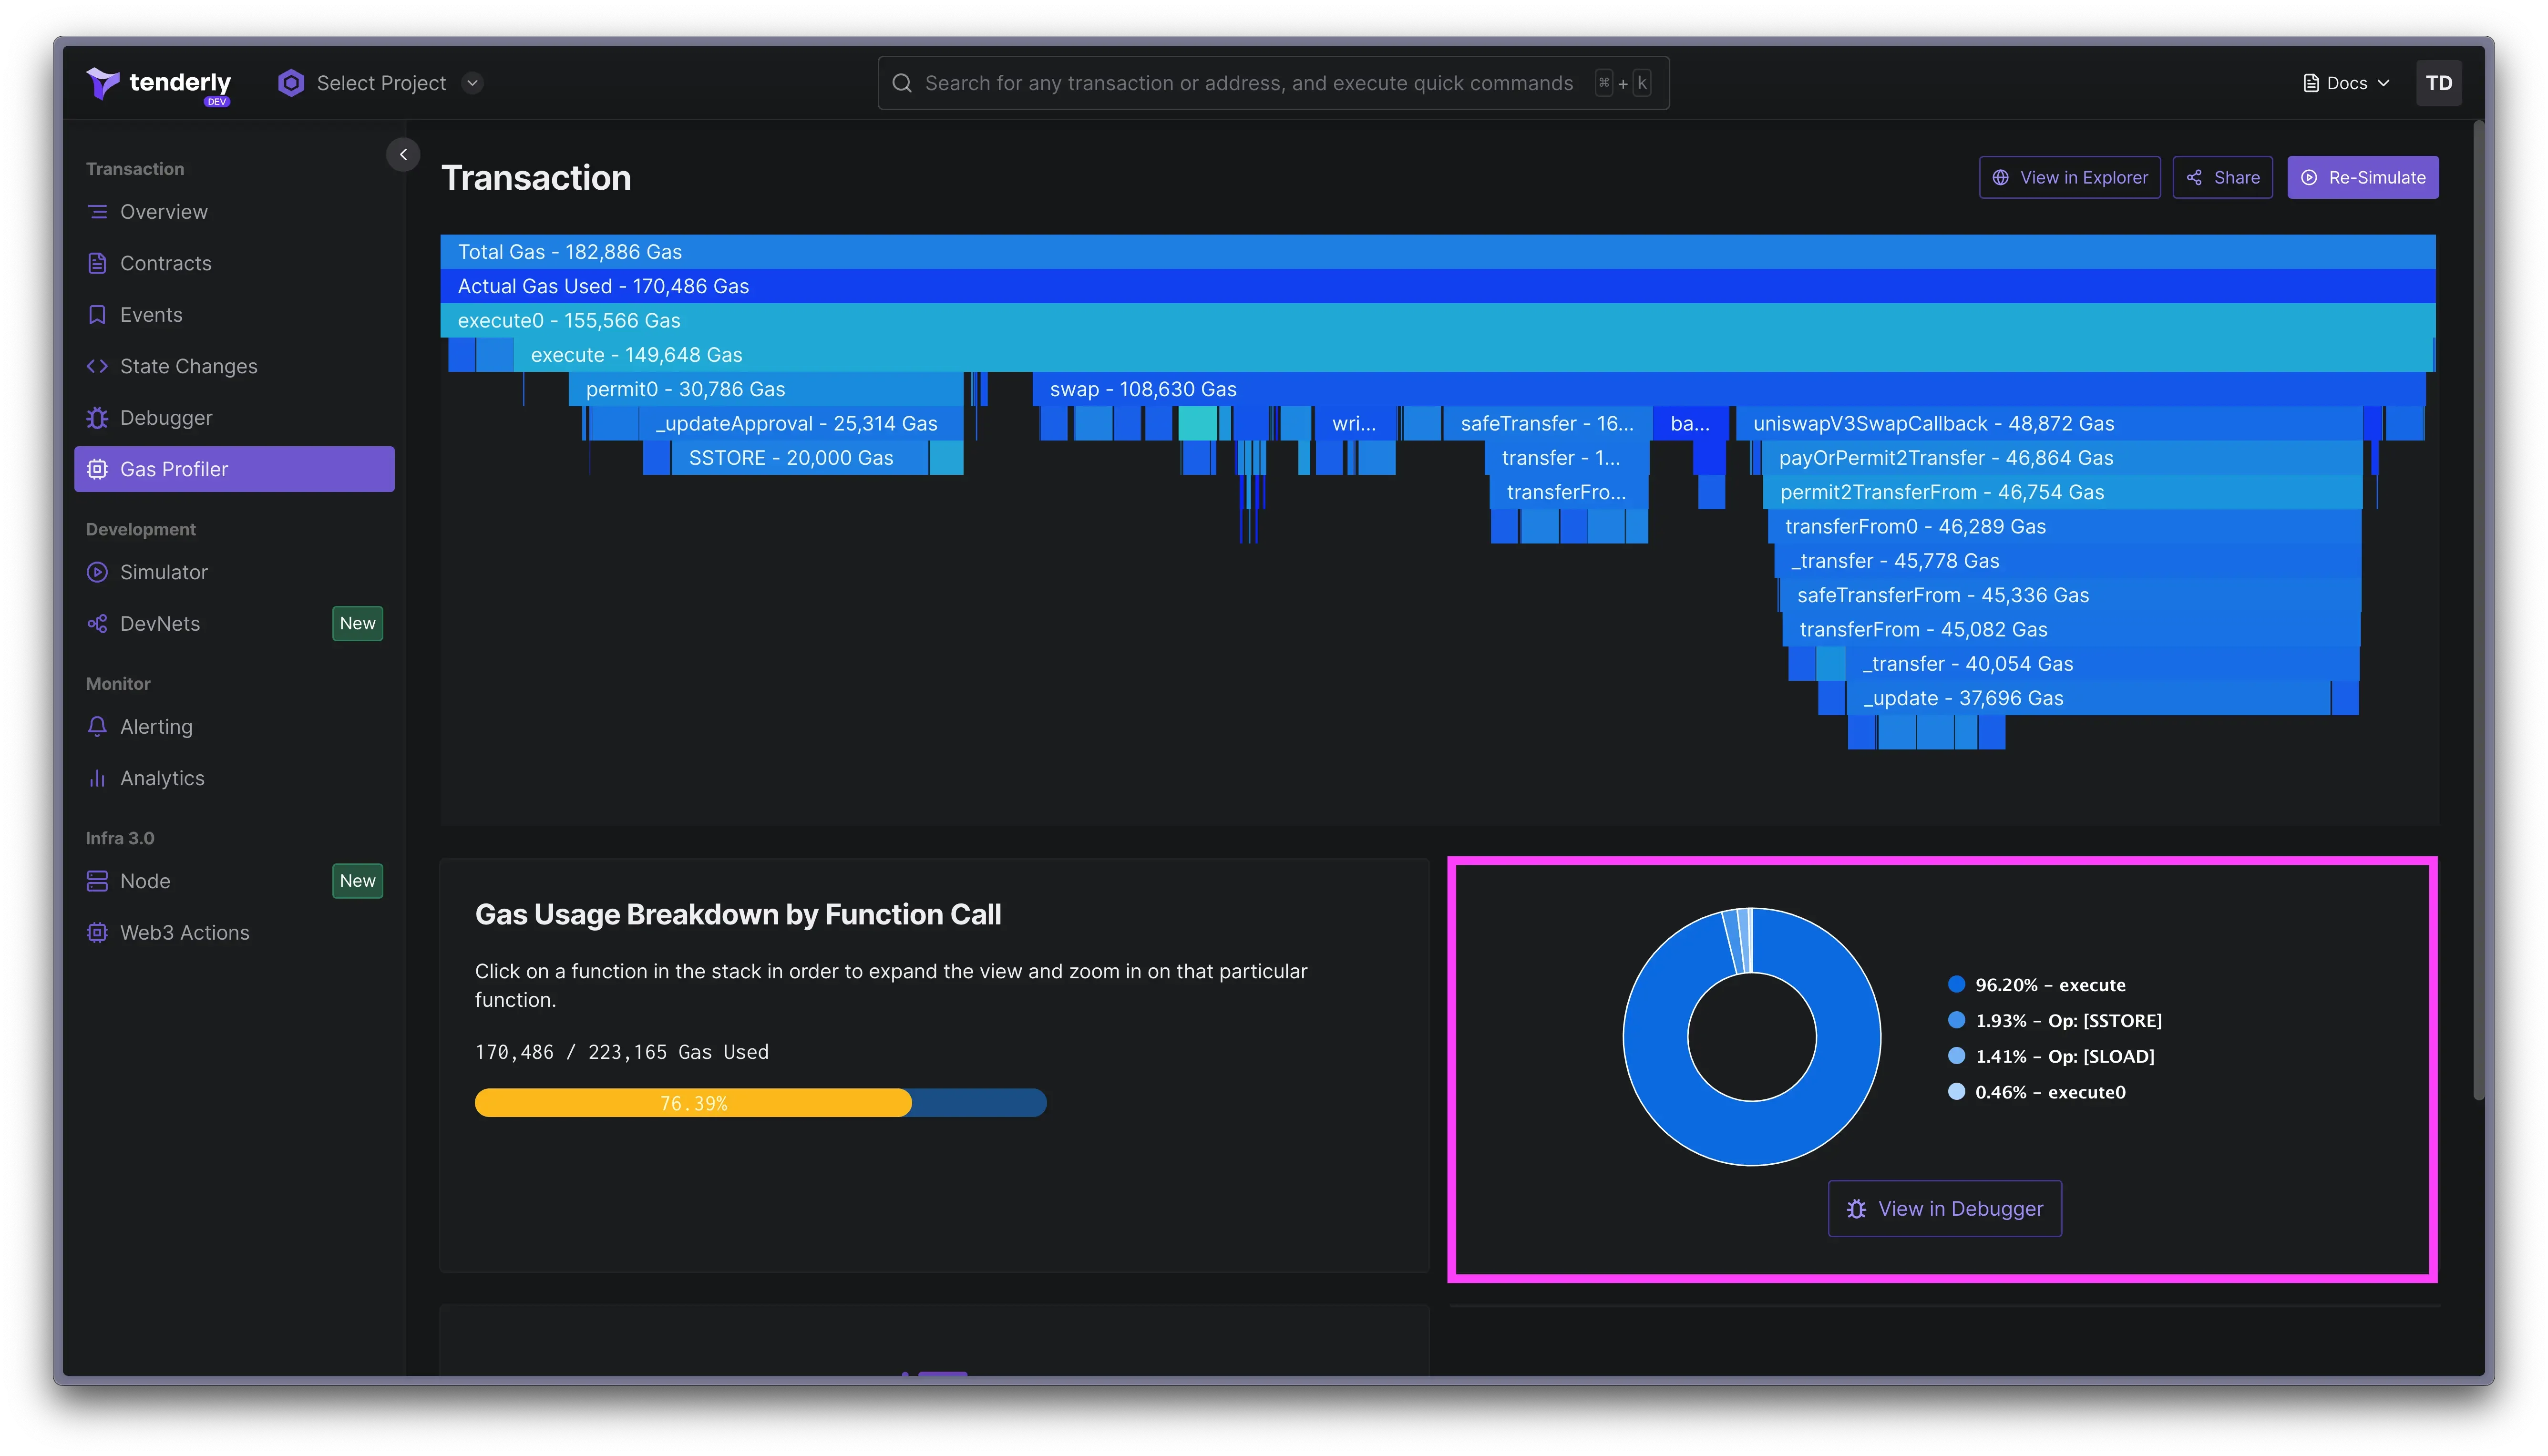
1. 在火焰图中点击函数调用会在下方窗格中显示详细的 gas 使用信息。
2. 如果您怀疑某个函数需要 gas 优化,请点击 **View in Debugger** 按钮,深入代码进行优化以减少 gas 使用。
3. 要验证这些更改是否有助于降低 gas 使用,您可以使用更改后的代码模拟同一交易,并比较 gas 分析结果。
#### 总 gas 与实际 gas
**Total Gas** 表示执行的整体 gas 成本,涵盖所有调用操作码相关 gas 成本的总和。
**Actual Gas** 表示执行的净 gas 成本。当乘以 `gas_price` 时,它提供您为此次执行支付的确切 wei 数。
计算 Actual Gas 的公式:`actual_gas_used = total_gas - gas_refund`。
区块链用户因清理存储而获得奖励,表现为对有效"删除"现有存储数据的 `SSTORE` 调用的 [gas 退还](https://github.com/wolflo/evm-opcodes/blob/main/gas.md#a0-3-gas-refunds)。这些 gas 退还从 Total Gas 中减去,得到实际使用的 Actual Gas。
### 优化 gas 使用
1. 在火焰图中点击函数调用会在下方窗格中显示详细的 gas 使用信息。
2. 如果您怀疑某个函数需要 gas 优化,请点击 **View in Debugger** 按钮,深入代码进行优化以减少 gas 使用。
3. 要验证这些更改是否有助于降低 gas 使用,您可以使用更改后的代码模拟同一交易,并比较 gas 分析结果。
#### 总 gas 与实际 gas
**Total Gas** 表示执行的整体 gas 成本,涵盖所有调用操作码相关 gas 成本的总和。
**Actual Gas** 表示执行的净 gas 成本。当乘以 `gas_price` 时,它提供您为此次执行支付的确切 wei 数。
计算 Actual Gas 的公式:`actual_gas_used = total_gas - gas_refund`。
区块链用户因清理存储而获得奖励,表现为对有效"删除"现有存储数据的 `SSTORE` 调用的 [gas 退还](https://github.com/wolflo/evm-opcodes/blob/main/gas.md#a0-3-gas-refunds)。这些 gas 退还从 Total Gas 中减去,得到实际使用的 Actual Gas。