> ## Documentation Index
> Fetch the complete documentation index at: https://docs.tenderly.co/llms.txt
> Use this file to discover all available pages before exploring further.
# 交易
> 关于在 Tenderly Dashboard 中管理和分析交易,用于开发和监控的指南。
Tenderly 为您提供最详尽的交易执行详情概览。对于每笔交易,Tenderly 都会提取以下数据以及更多信息:常规信息、[解码调用追踪](#decoded-call-trace)、[代币转账](#tokens-transferred)、[资金流向](#fund-flow)、[涉及的合约](#involved-contracts)、[状态变更](#state-changes)、[发出的事件](#emitted-events)、[使用的 gas](#gas-used) 等。
[在 Loom 上观看 →](https://www.loom.com/share/05325e45c232445b992214da8c6ba179?sid=e10e8812-874d-42ad-9def-ea47f8e6a13d)
在交易概览页面,您还可以访问 [Debugger](/debugger/overview) 以深入了解调用堆栈和智能合约源代码。您还可以使用 [Simulator](/simulator-ui/overview) 修改众多交易参数,并对照最新的网络状态模拟结果。
 ## 解码调用追踪
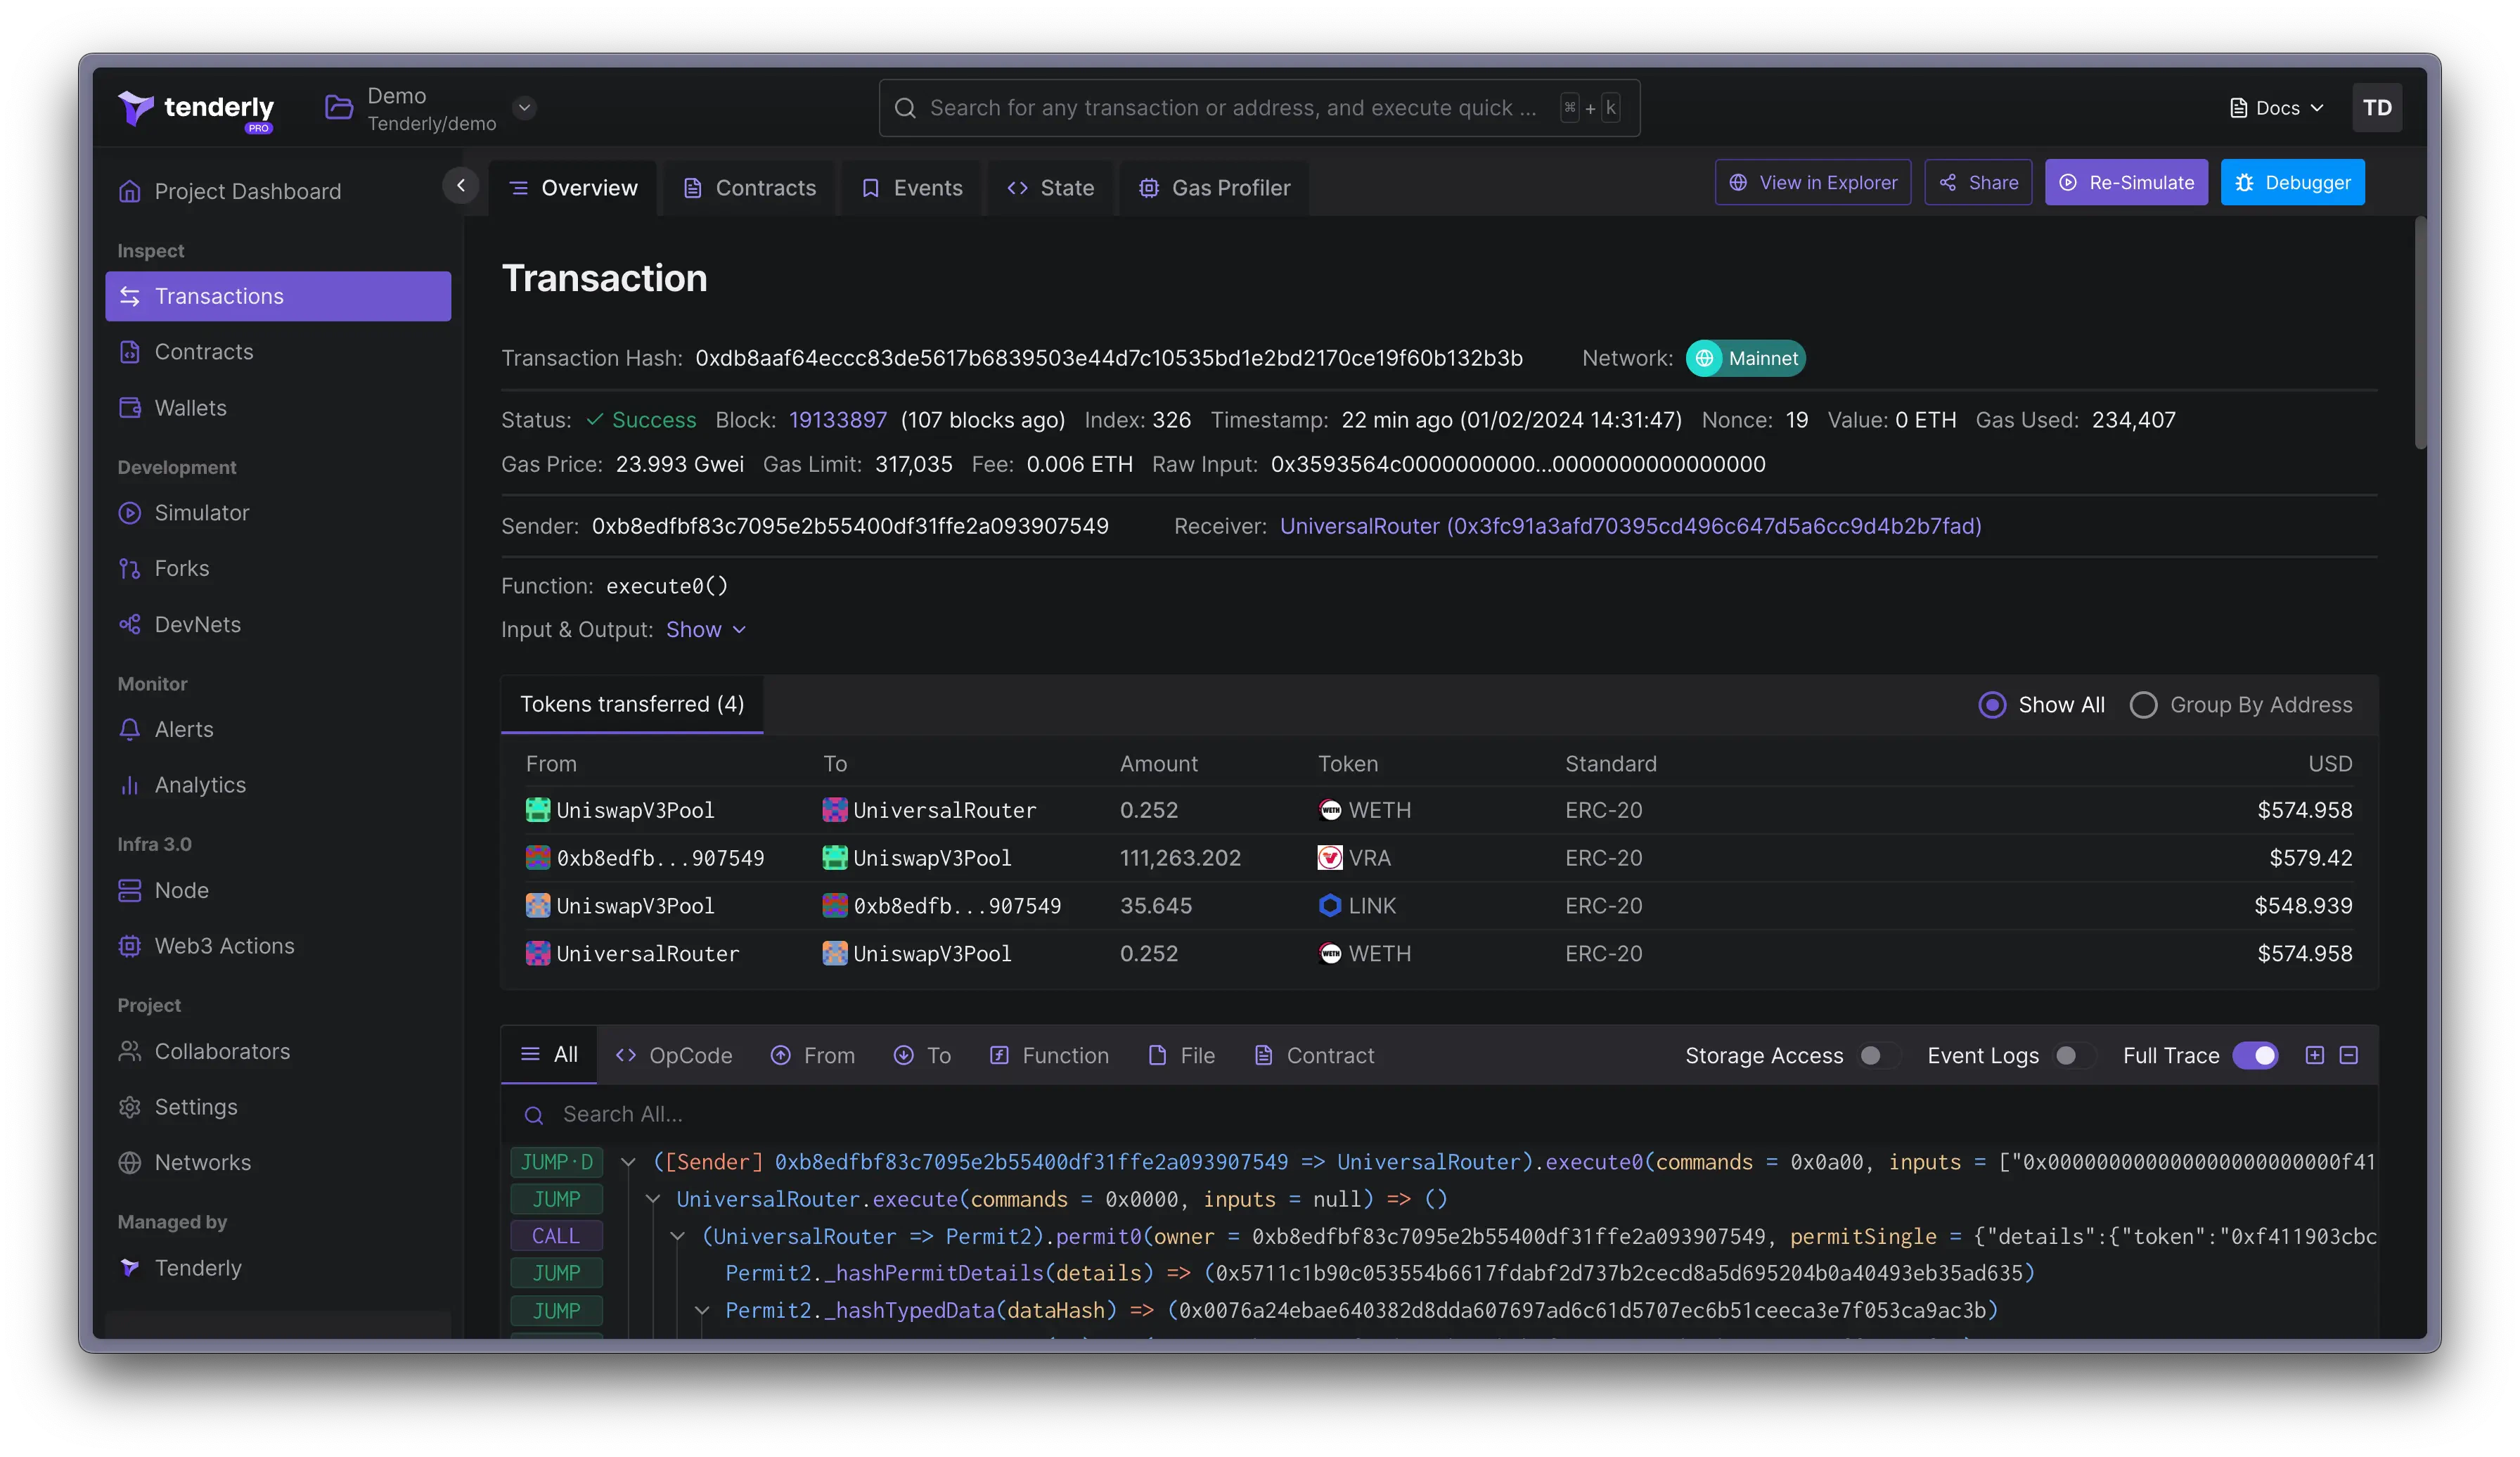
解码调用追踪面板允许您检查各种操作码及其输入和输出:`JUMP`、`CALL`、`DELEGATECALL`、`STATICCALL`、`CREATE2`、`CREATE`、`REVERT`、`JUMPDEST`、`SLOAD` 和 `SSTORE`。进一步了解 EVM [操作码](https://ethervm.io/)。
## 解码调用追踪
解码调用追踪面板允许您检查各种操作码及其输入和输出:`JUMP`、`CALL`、`DELEGATECALL`、`STATICCALL`、`CREATE2`、`CREATE`、`REVERT`、`JUMPDEST`、`SLOAD` 和 `SSTORE`。进一步了解 EVM [操作码](https://ethervm.io/)。
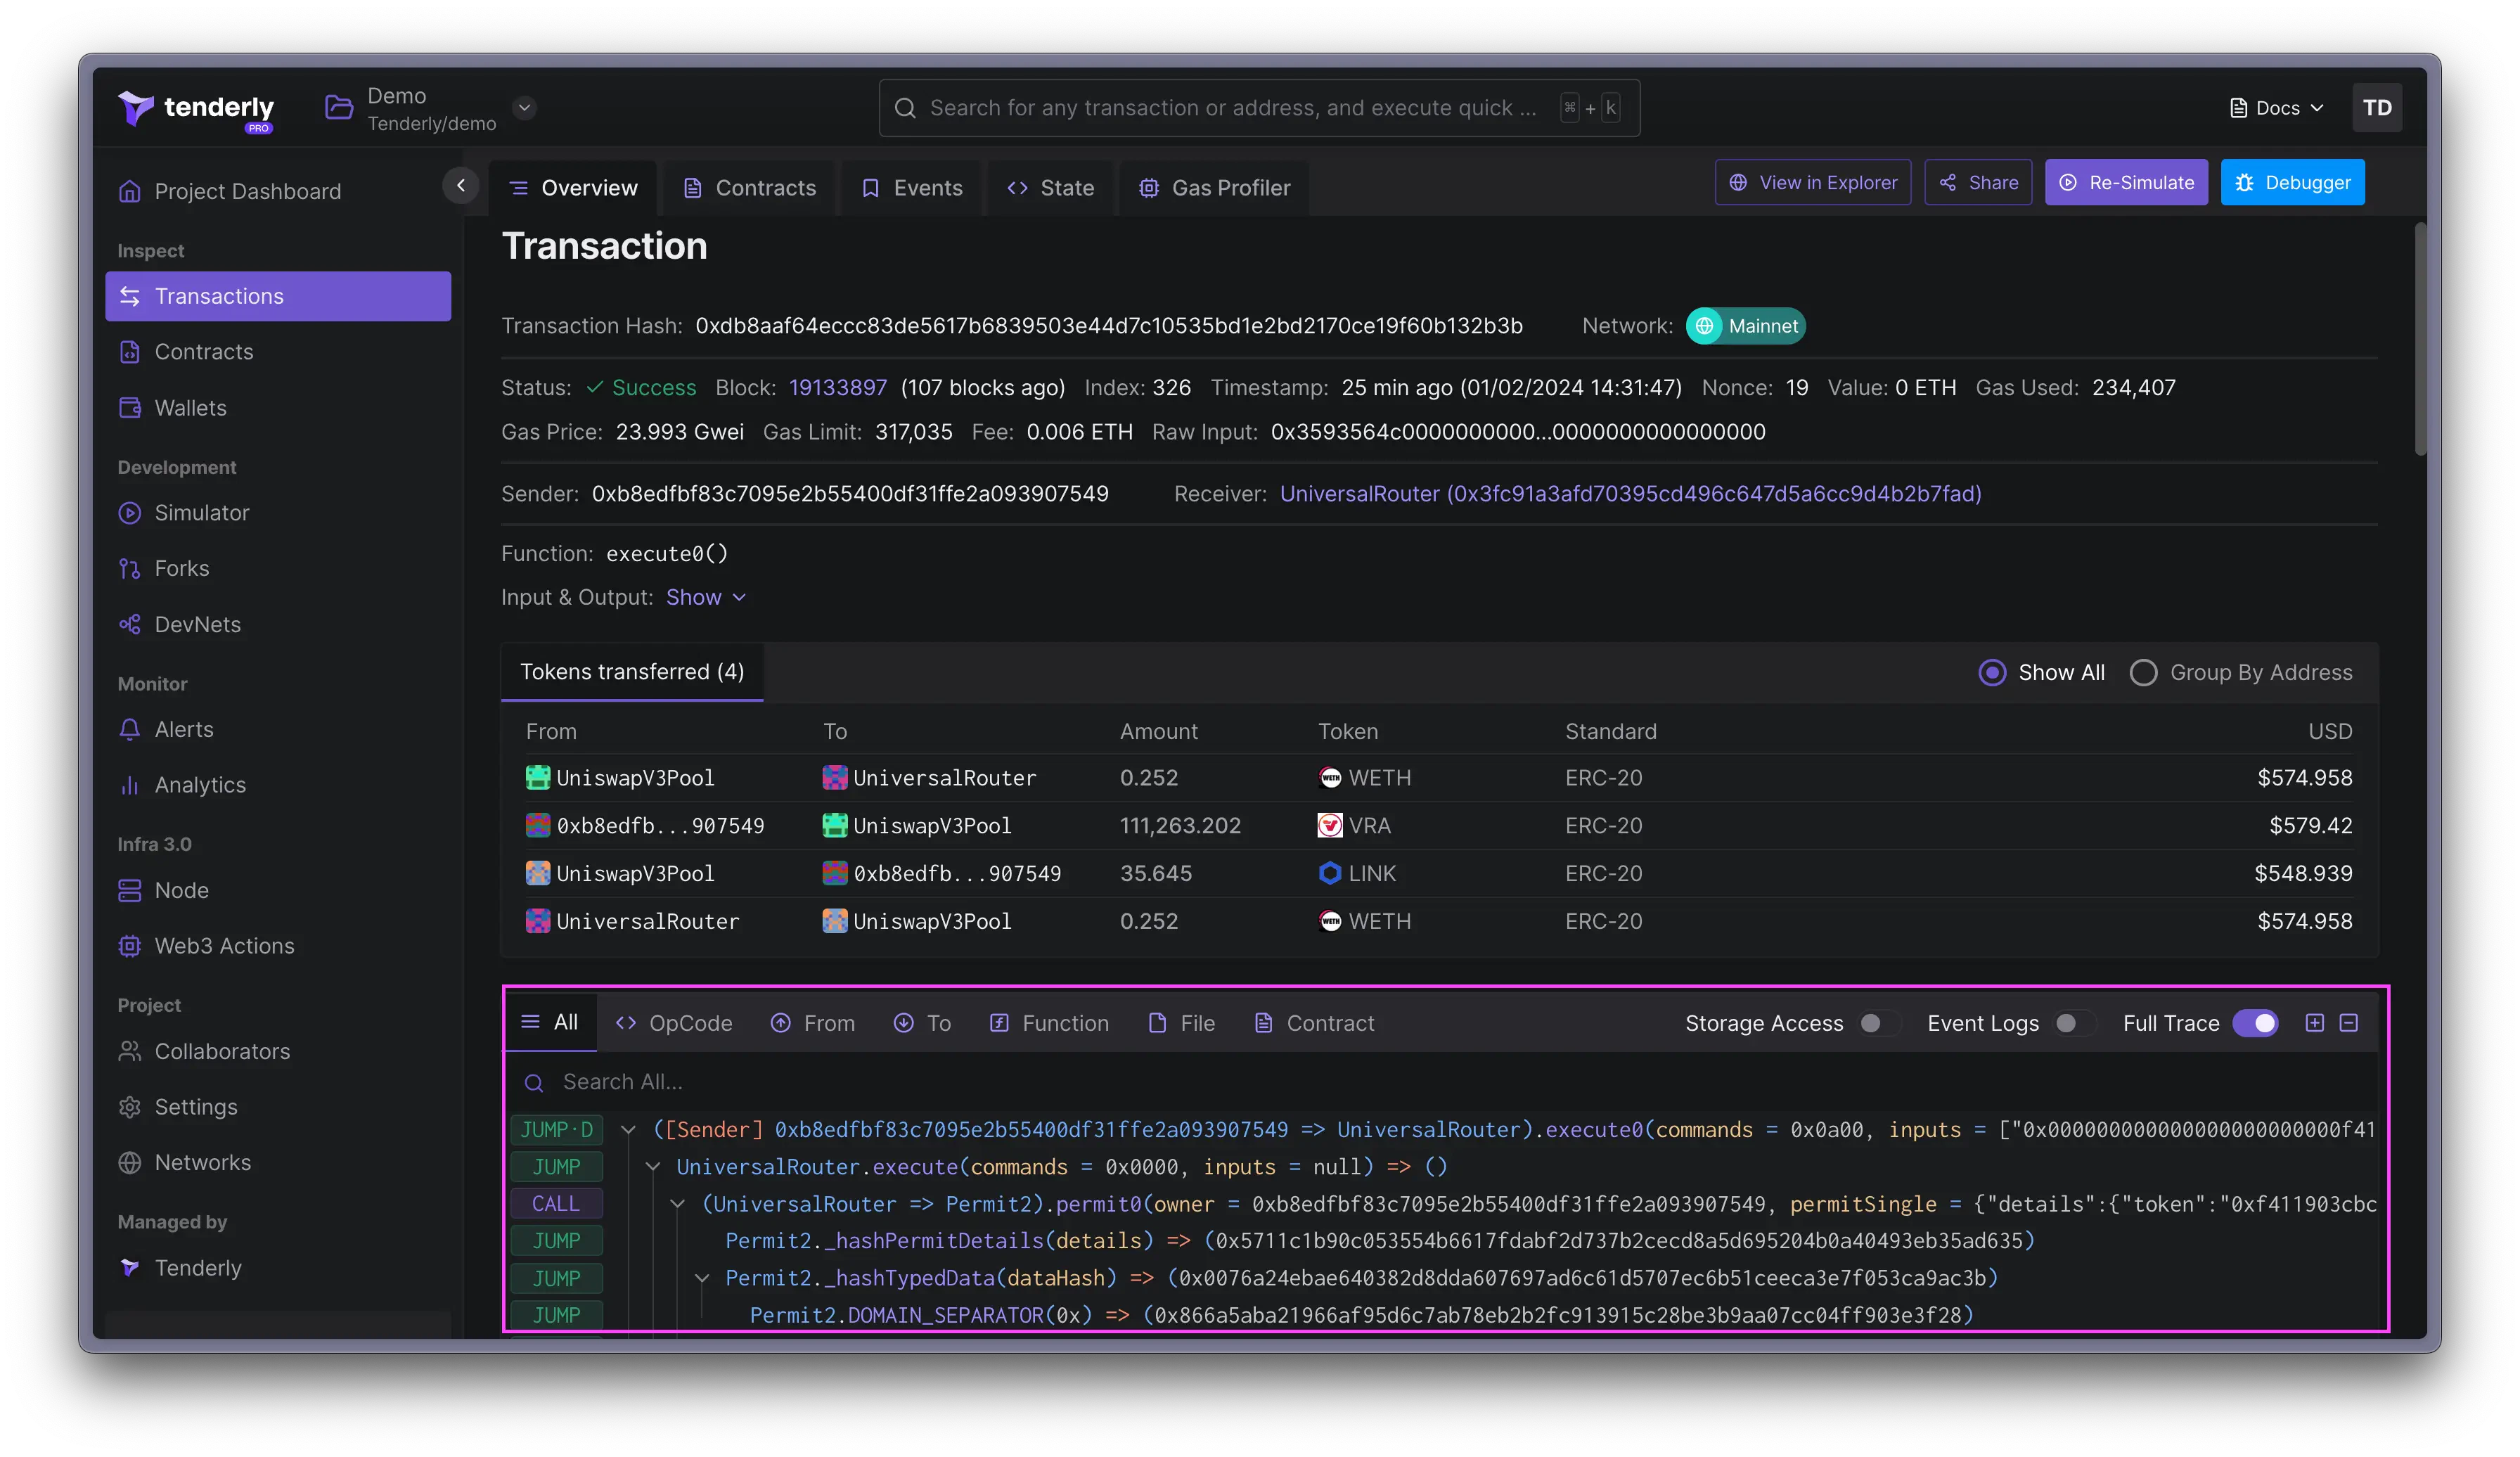 您还可以控制 Dashboard 中显示的调用追踪数据的详细程度。切换 **Full Trace**、**Storage Access** 和 **Event Logs** 以在调用追踪中包含或排除信息。
### 搜索调用追踪
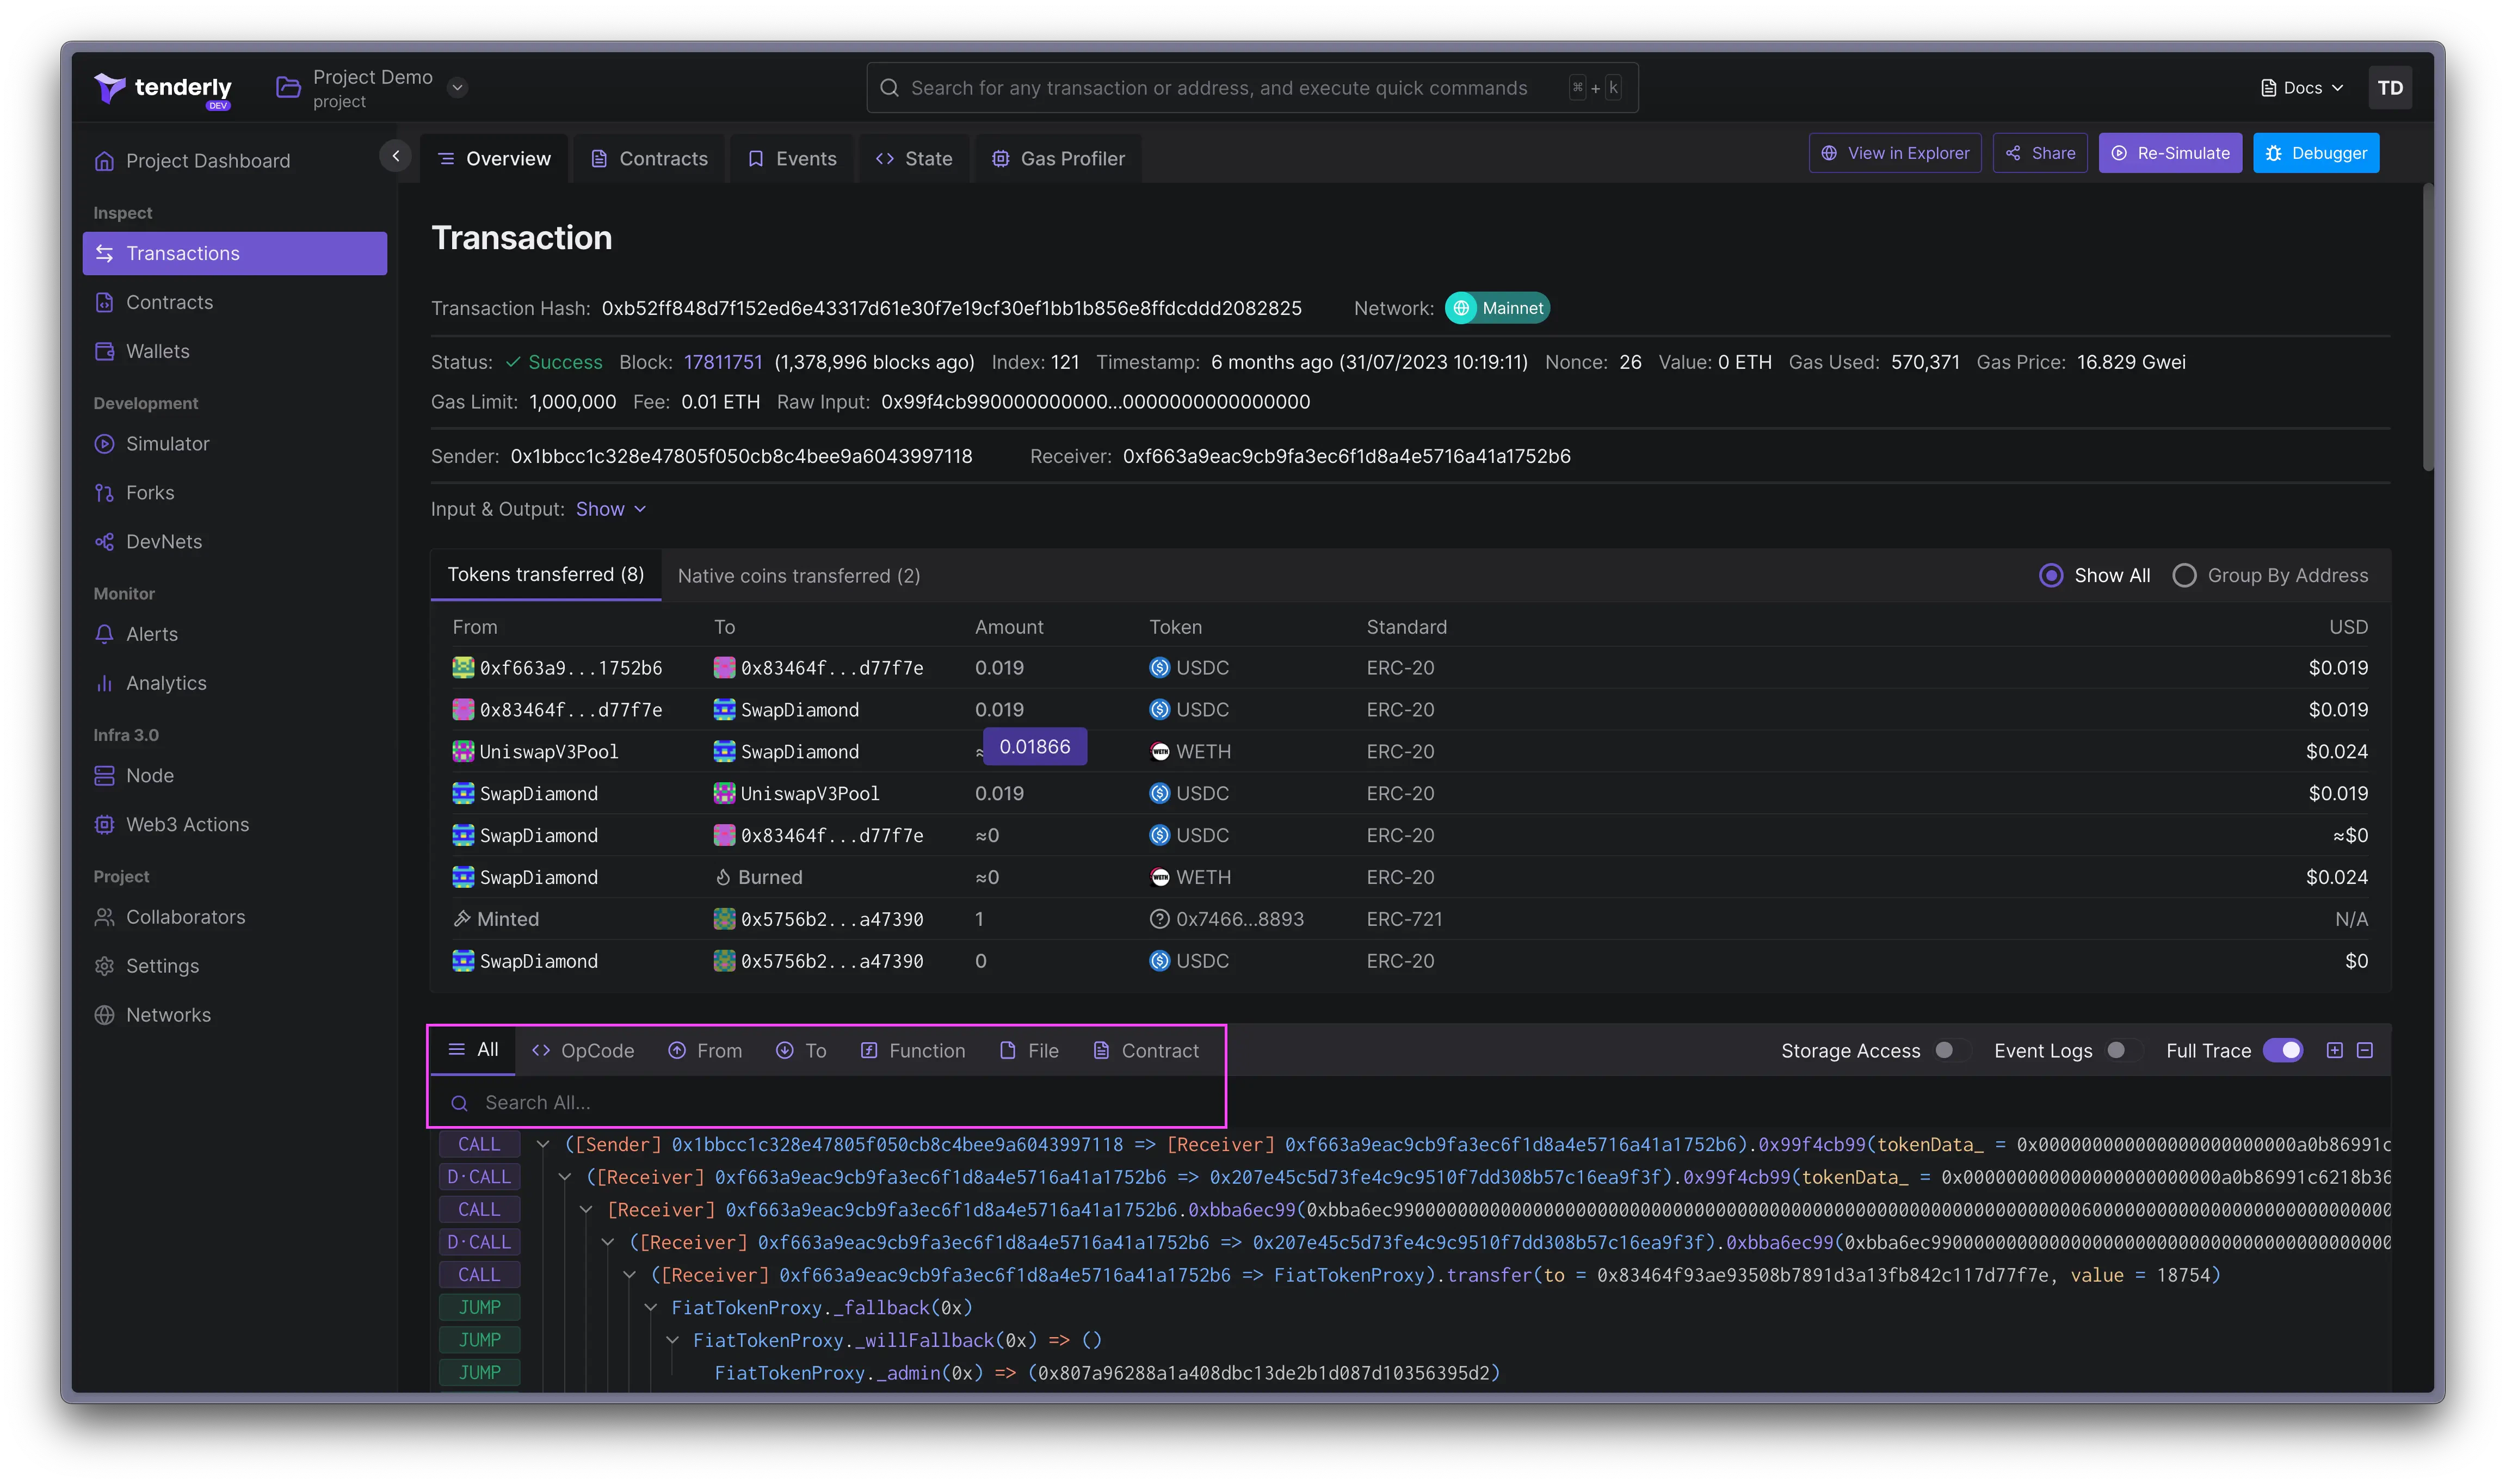
您可以搜索整个调用追踪,快速找到特定的操作码、函数和变量。如果您需要查找发送方和接收方地址、Solidity 文件和合约,搜索选项也同样适用。
您还可以控制 Dashboard 中显示的调用追踪数据的详细程度。切换 **Full Trace**、**Storage Access** 和 **Event Logs** 以在调用追踪中包含或排除信息。
### 搜索调用追踪
您可以搜索整个调用追踪,快速找到特定的操作码、函数和变量。如果您需要查找发送方和接收方地址、Solidity 文件和合约,搜索选项也同样适用。
 ### 存储访问
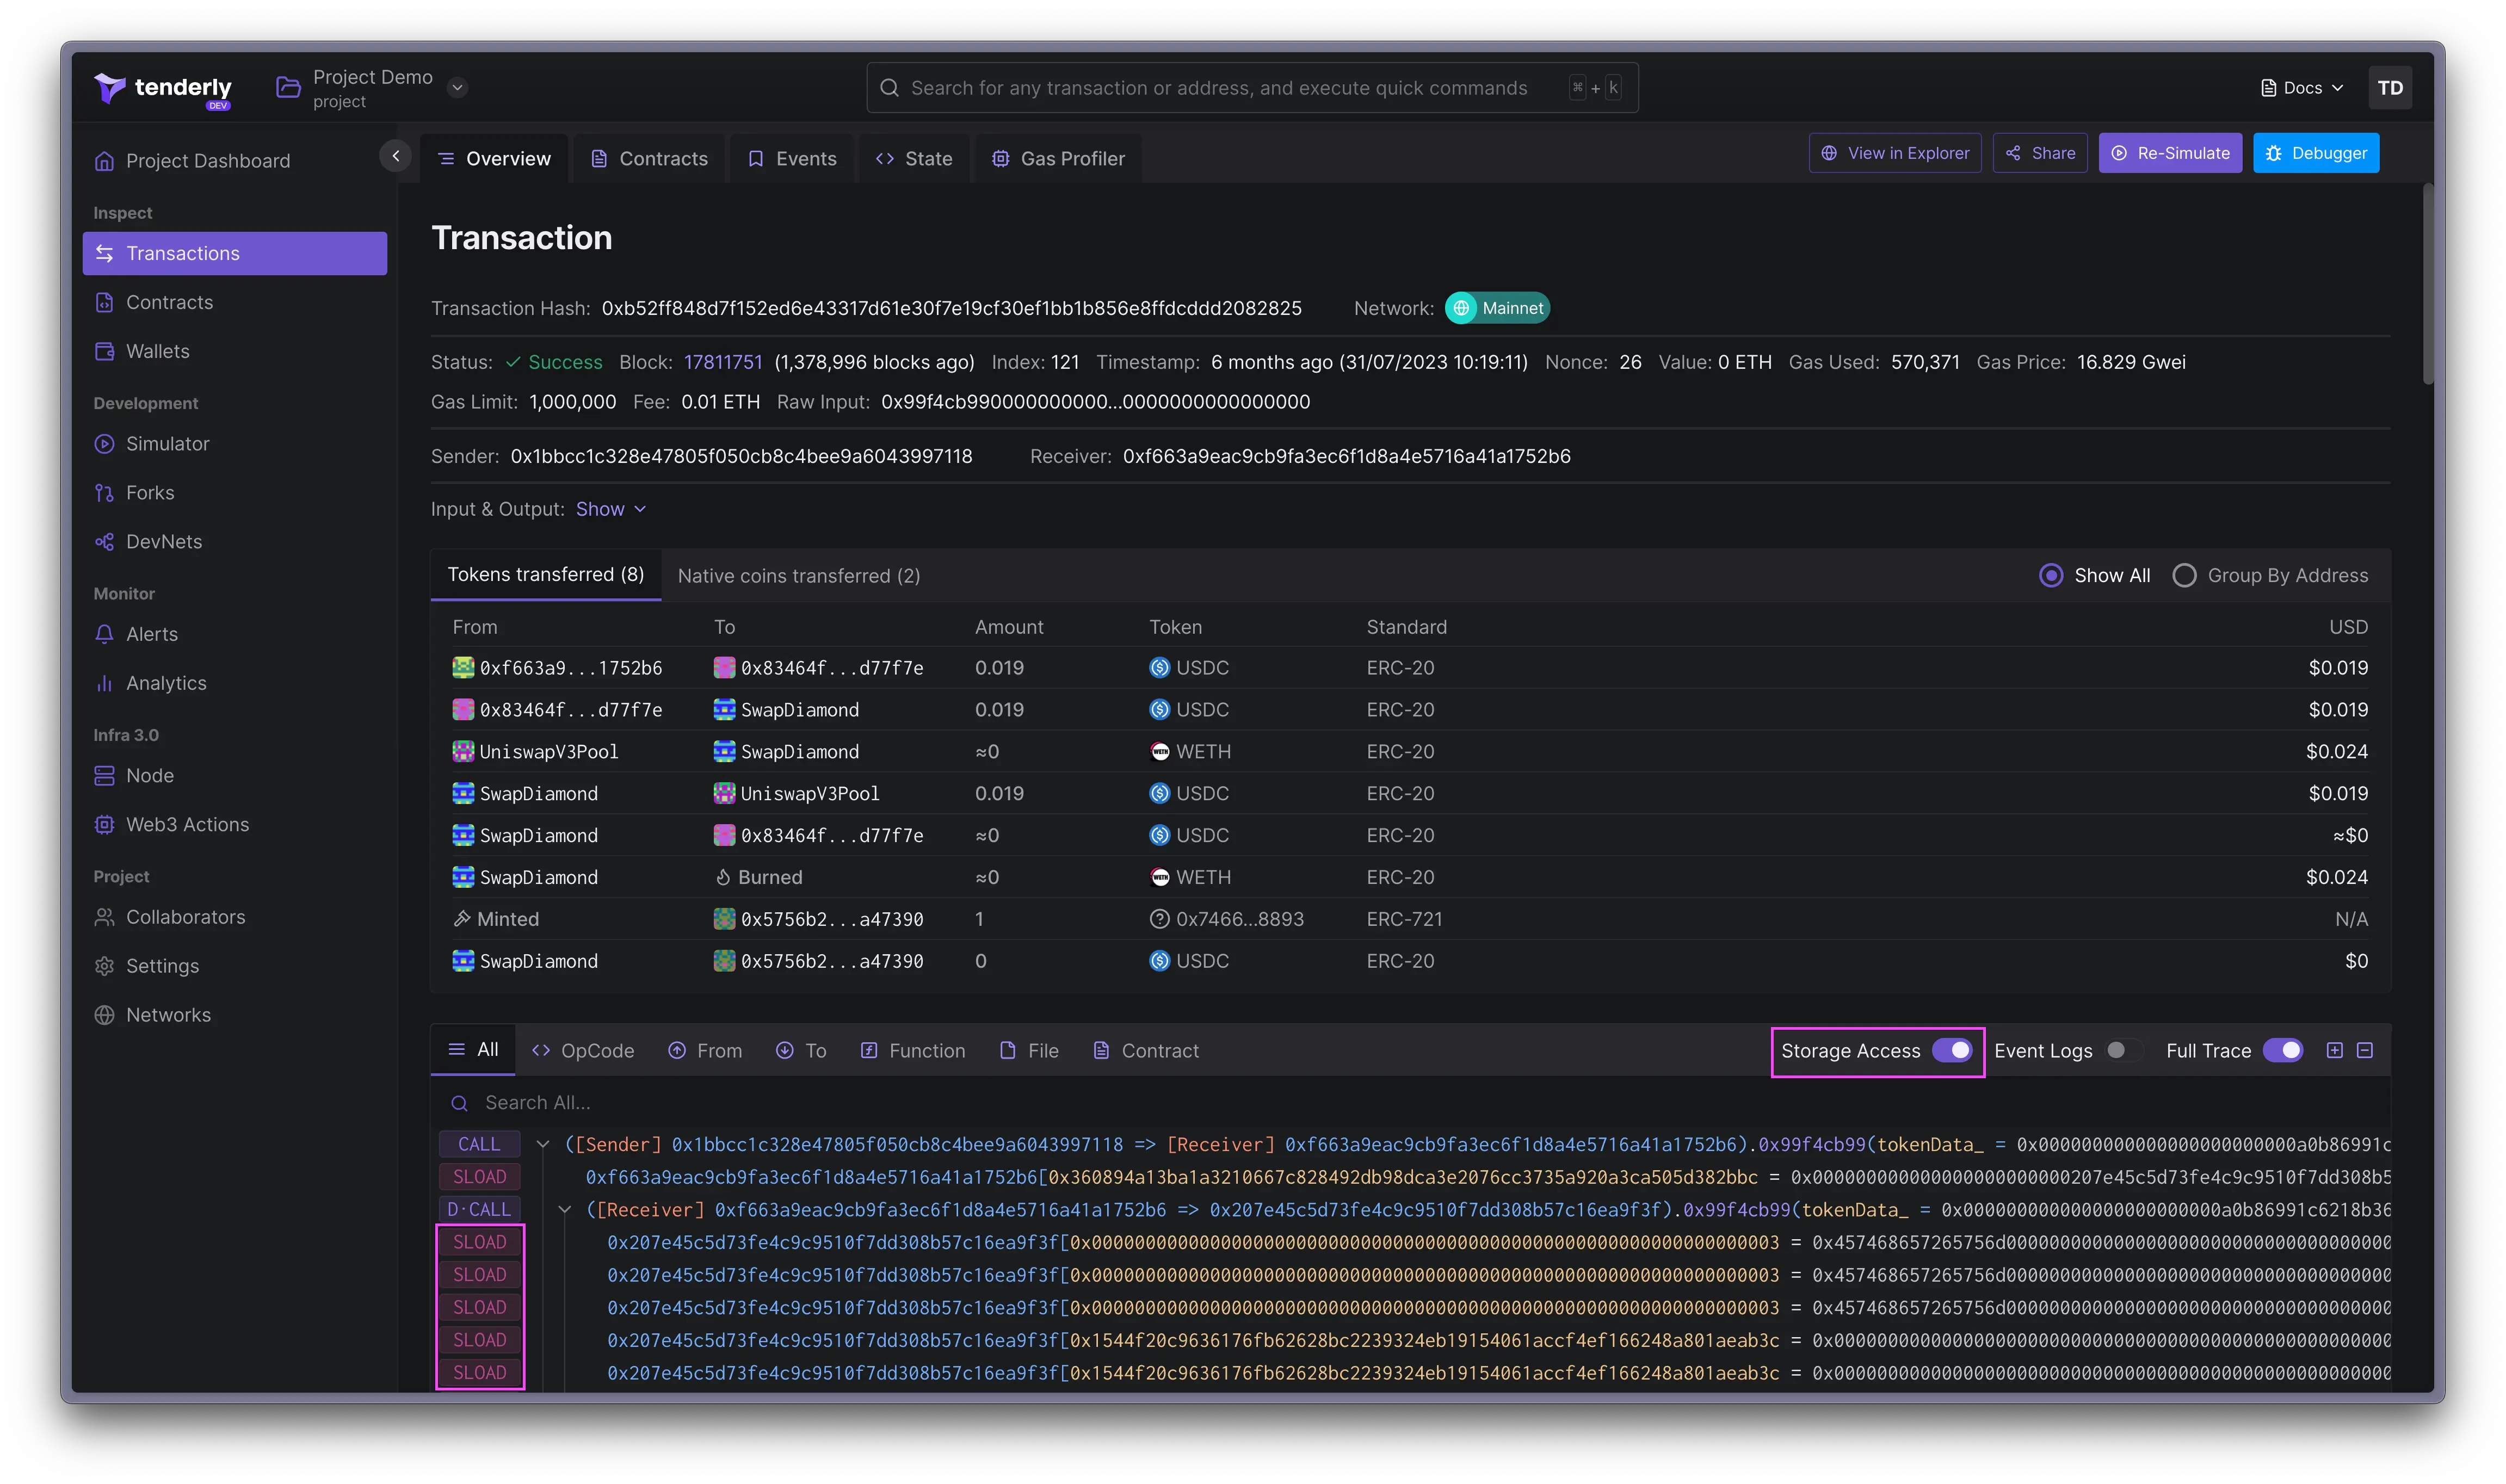
点击 **Storage Access** 以在调用追踪中包含 `SSLOAD` 和 `SSTORE` 操作码、访问的存储槽以及任何值的变更。存储操作码默认不显示,您需要启用它们。
### 存储访问
点击 **Storage Access** 以在调用追踪中包含 `SSLOAD` 和 `SSTORE` 操作码、访问的存储槽以及任何值的变更。存储操作码默认不显示,您需要启用它们。
 ### 事件日志
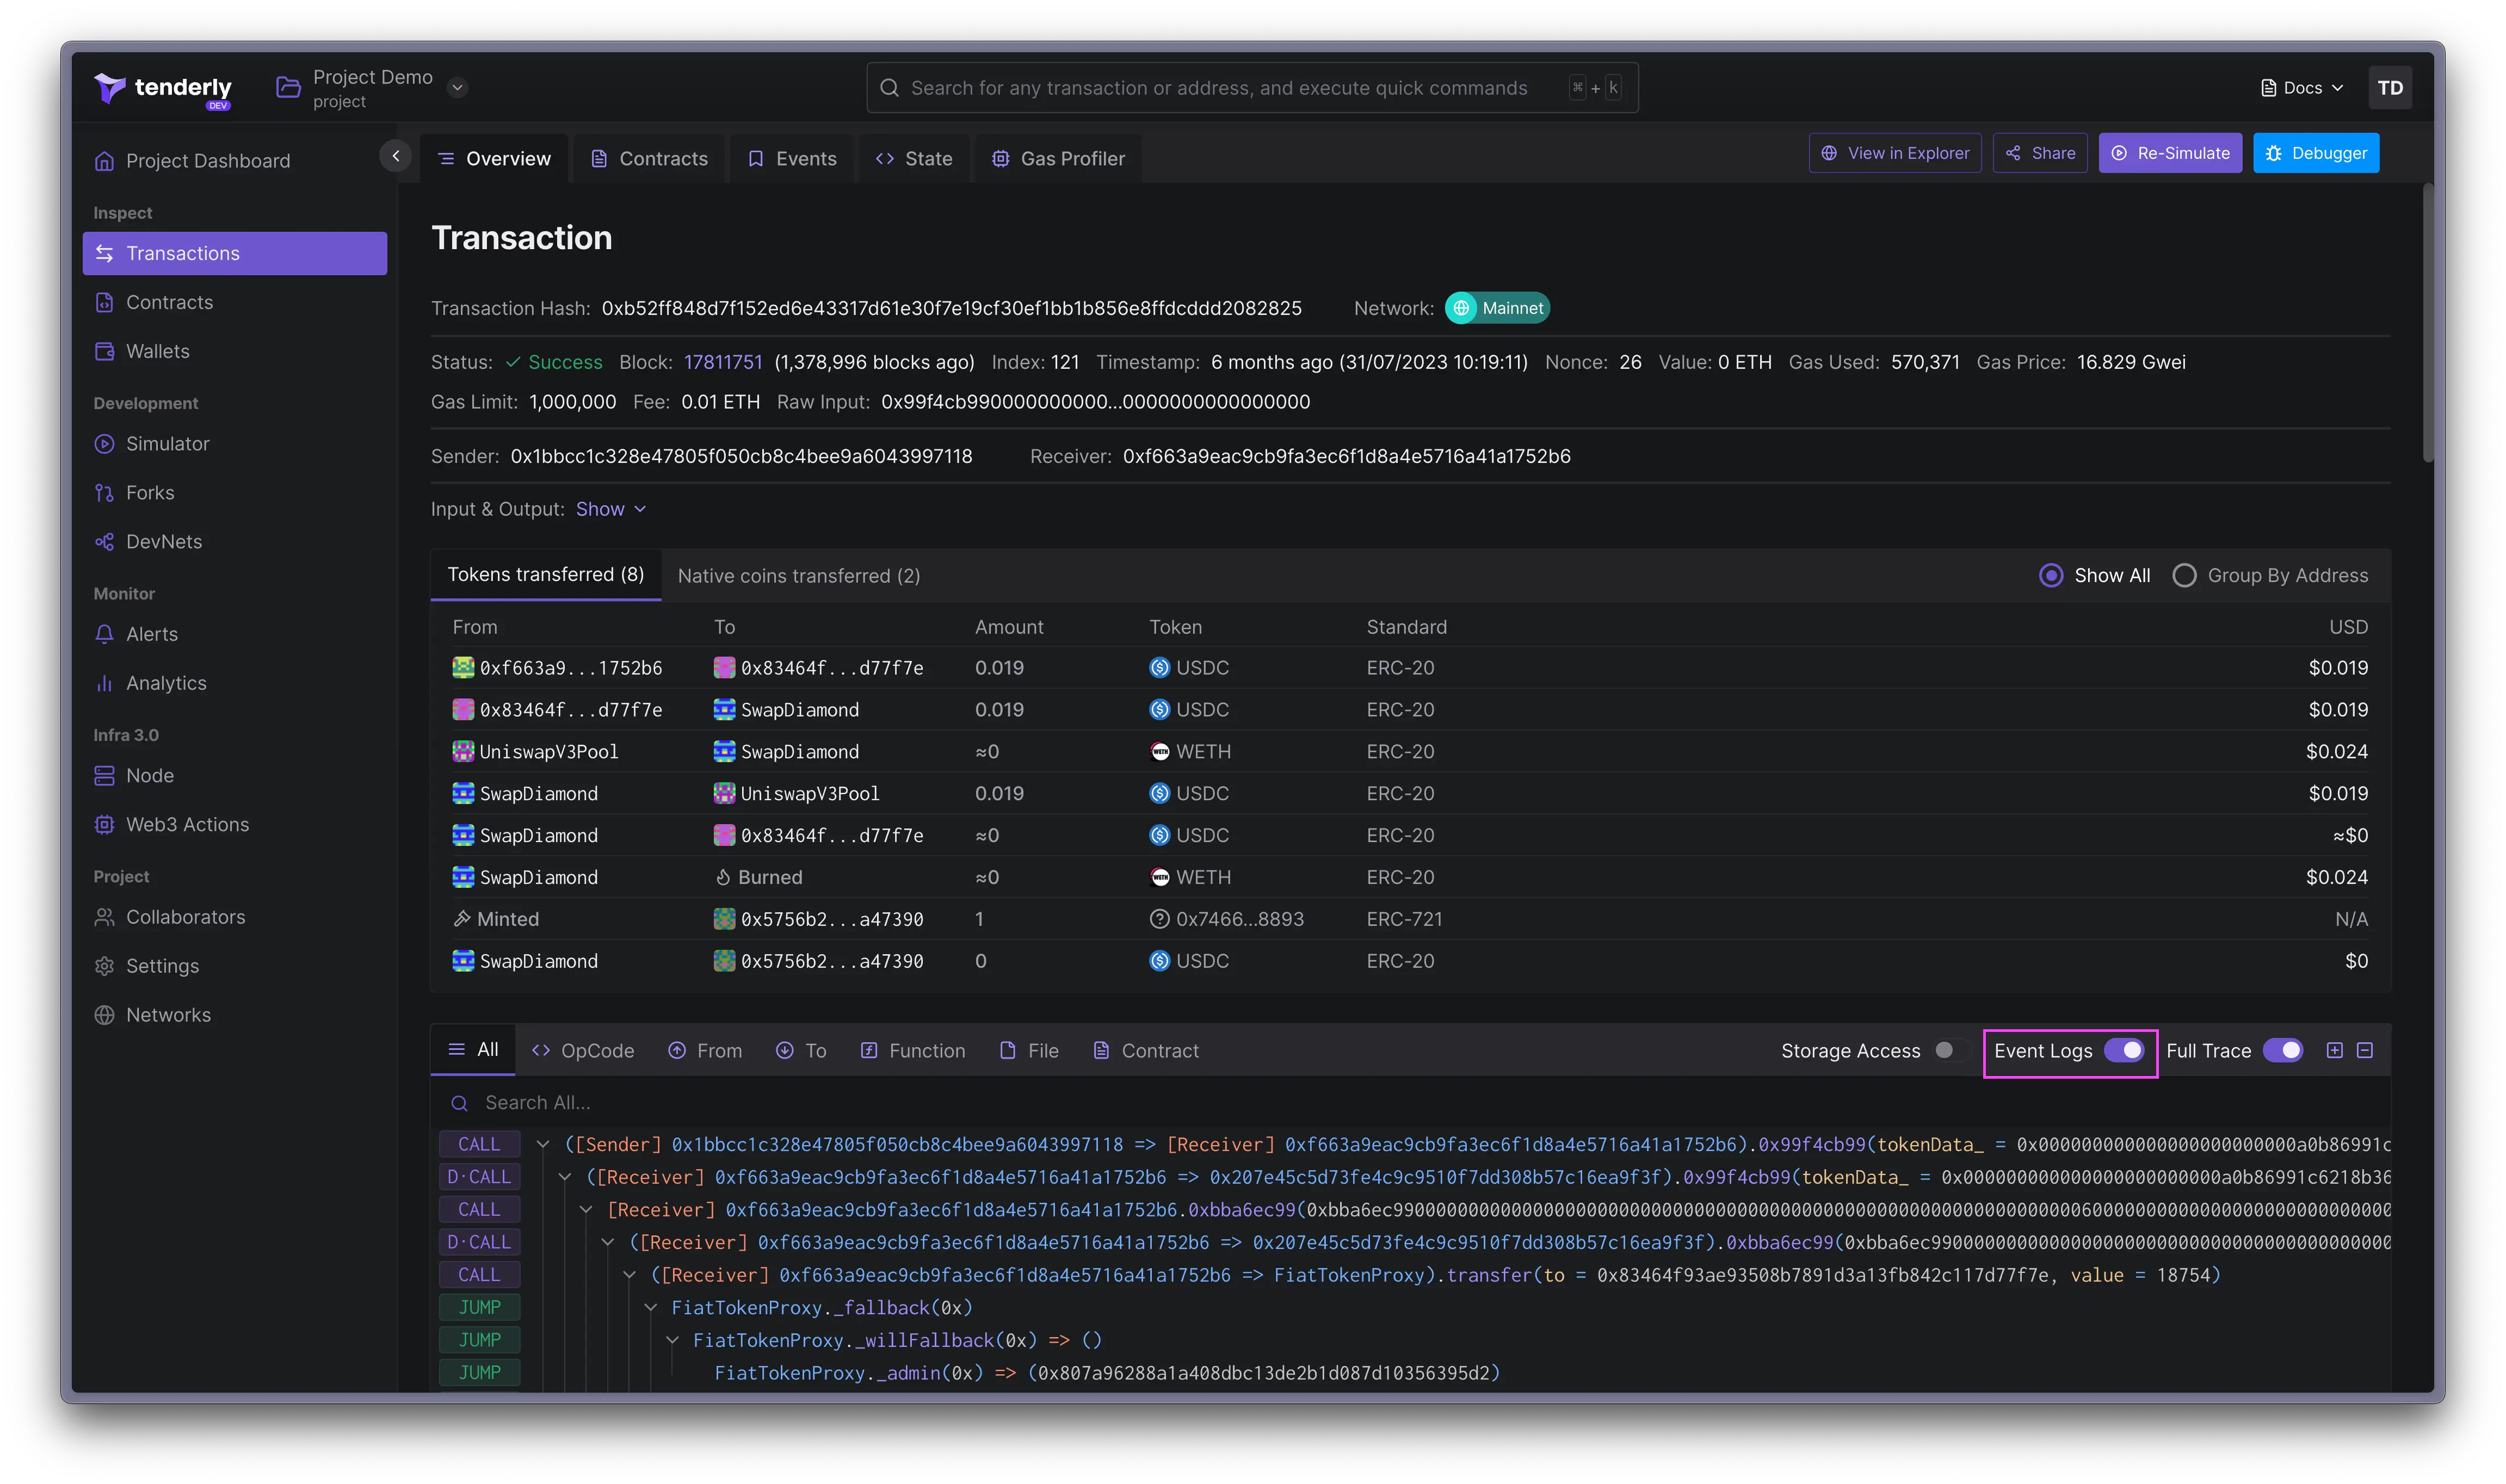
切换 **Events Log** 选项以在调用追踪中包含 log 操作码 `log0` 到 `log4`。启用此选项将显示交易中发生的事件。
### 事件日志
切换 **Events Log** 选项以在调用追踪中包含 log 操作码 `log0` 到 `log4`。启用此选项将显示交易中发生的事件。
 ### 评论和优先级设置
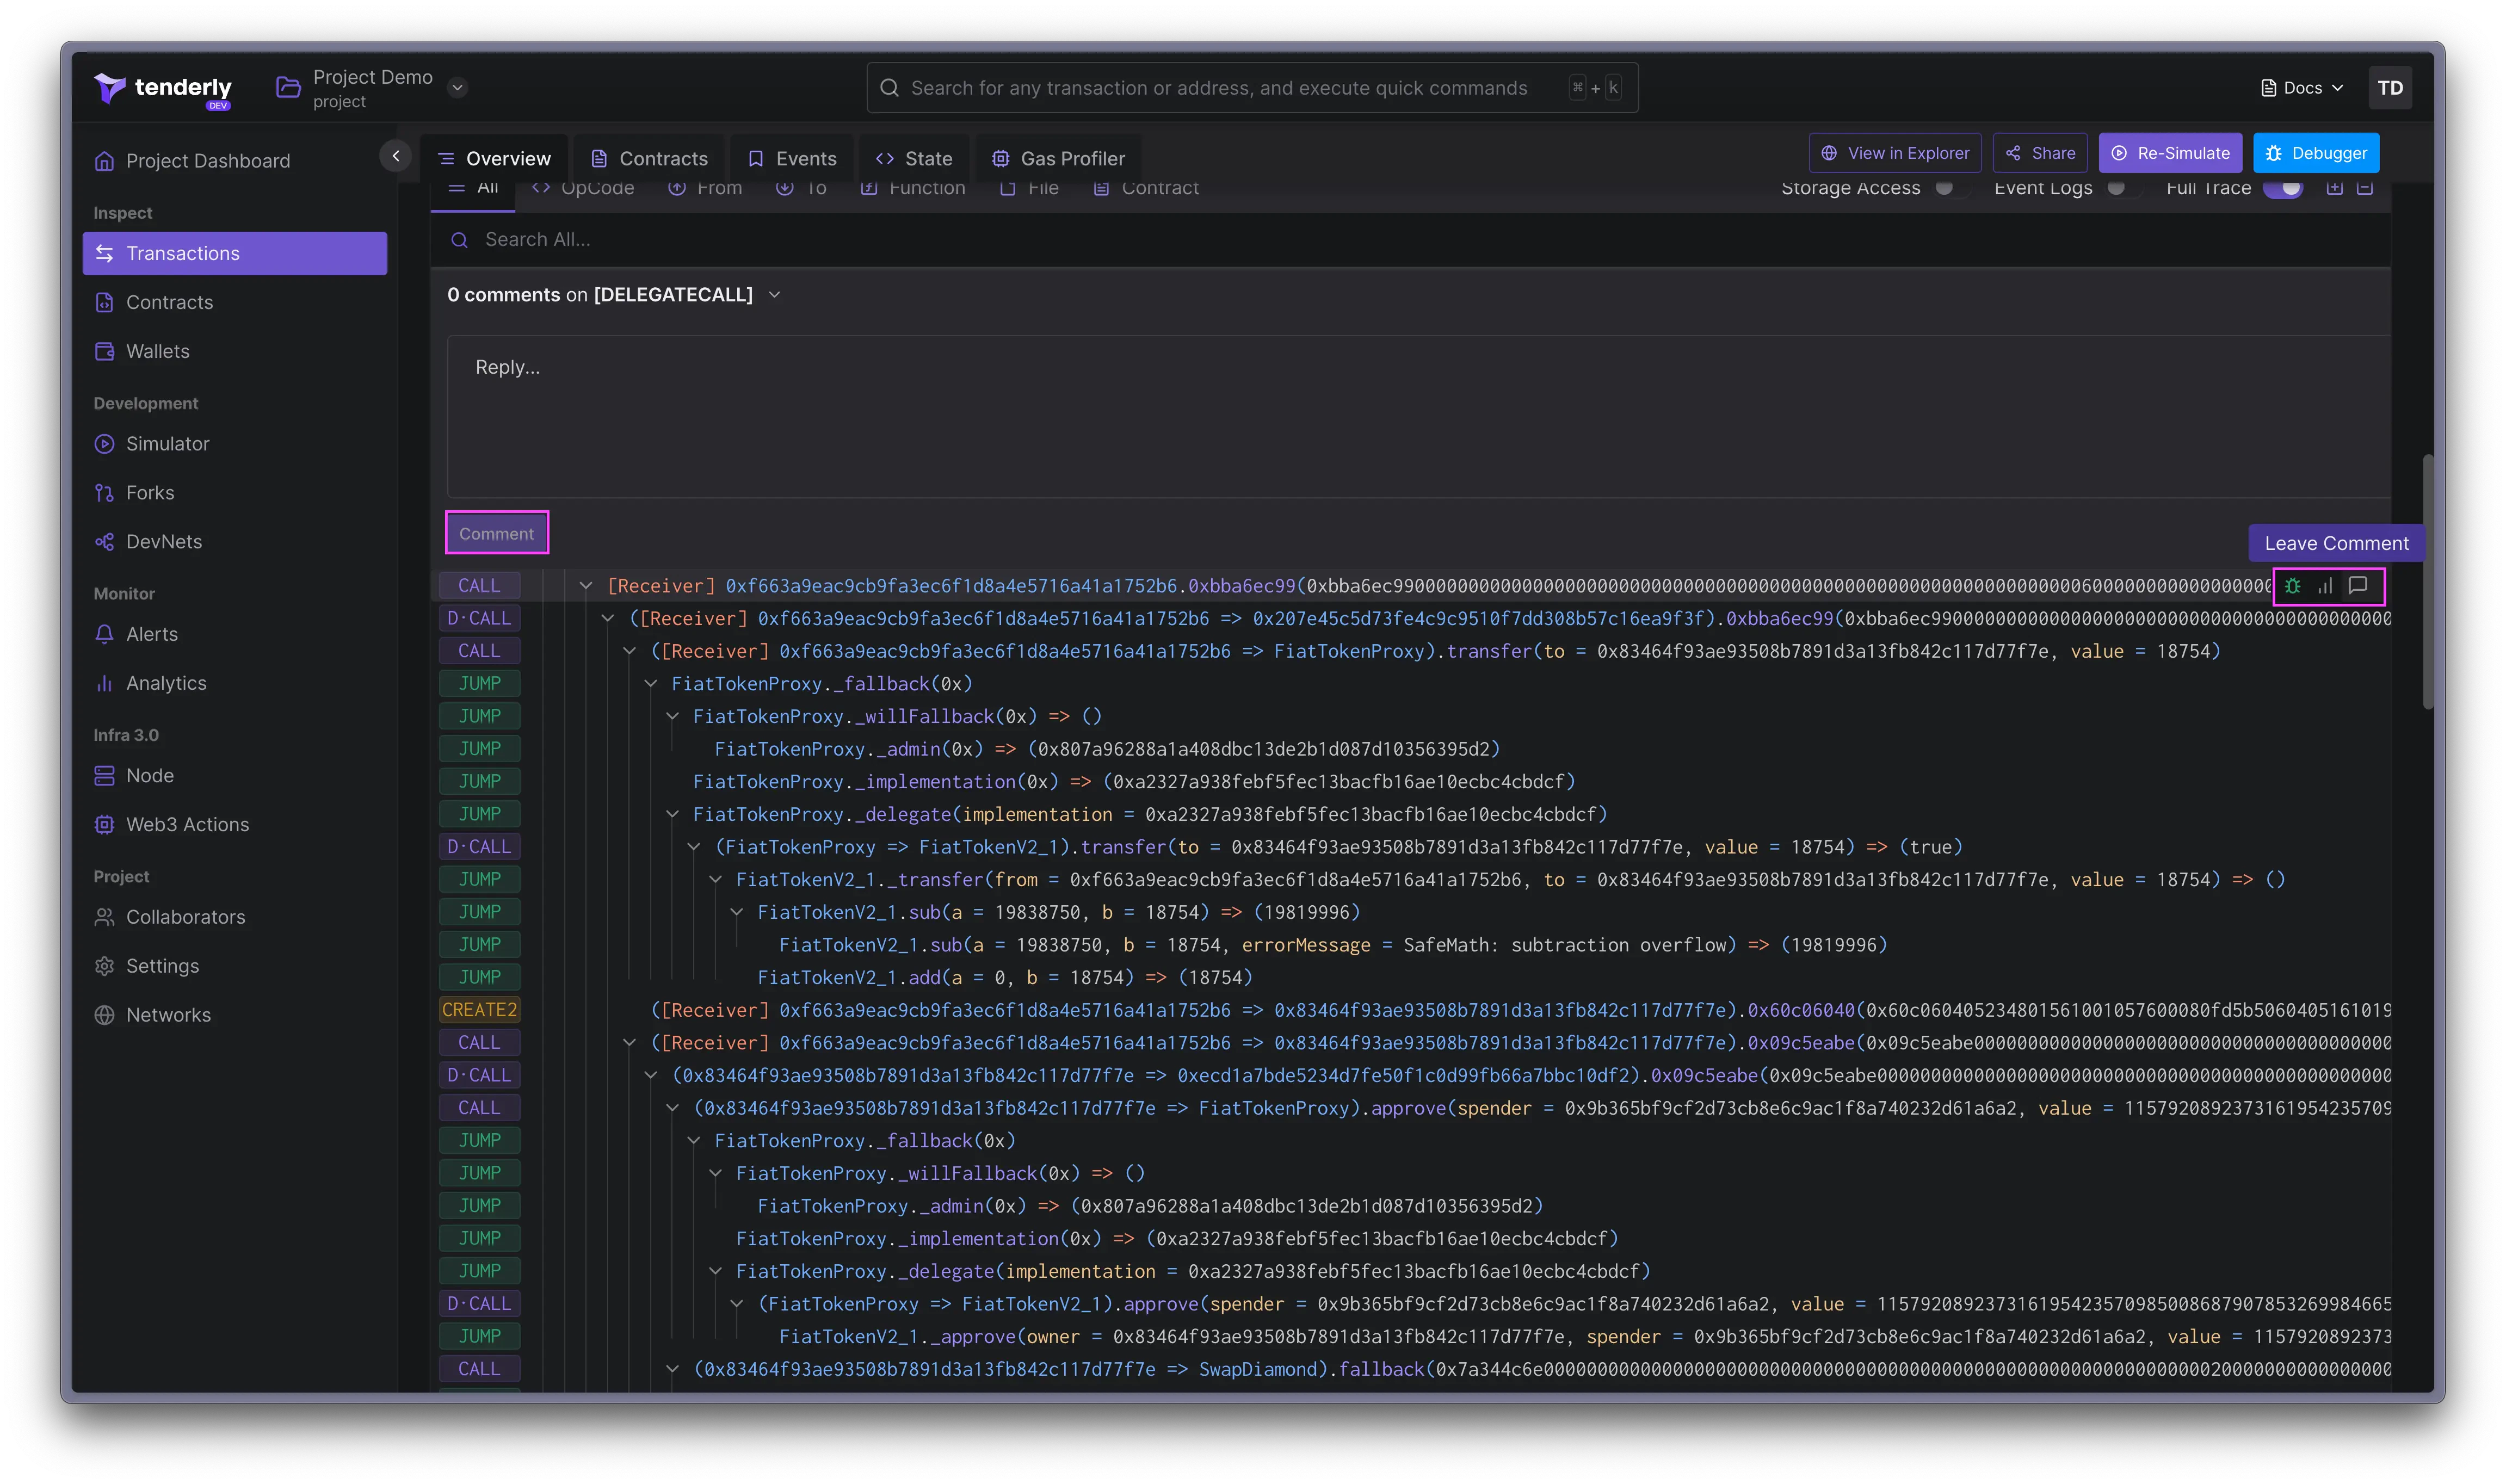
您可以在调用追踪的任意部分留下评论。将鼠标悬停在调用追踪中的任何元素上,然后点击对话气泡图标即可留下评论。
如果您是团队的一员,并且希望在调用追踪的特定部分留下笔记供其他成员查看,评论功能就非常有用。所有项目成员都可以看到评论。
### 评论和优先级设置
您可以在调用追踪的任意部分留下评论。将鼠标悬停在调用追踪中的任何元素上,然后点击对话气泡图标即可留下评论。
如果您是团队的一员,并且希望在调用追踪的特定部分留下笔记供其他成员查看,评论功能就非常有用。所有项目成员都可以看到评论。
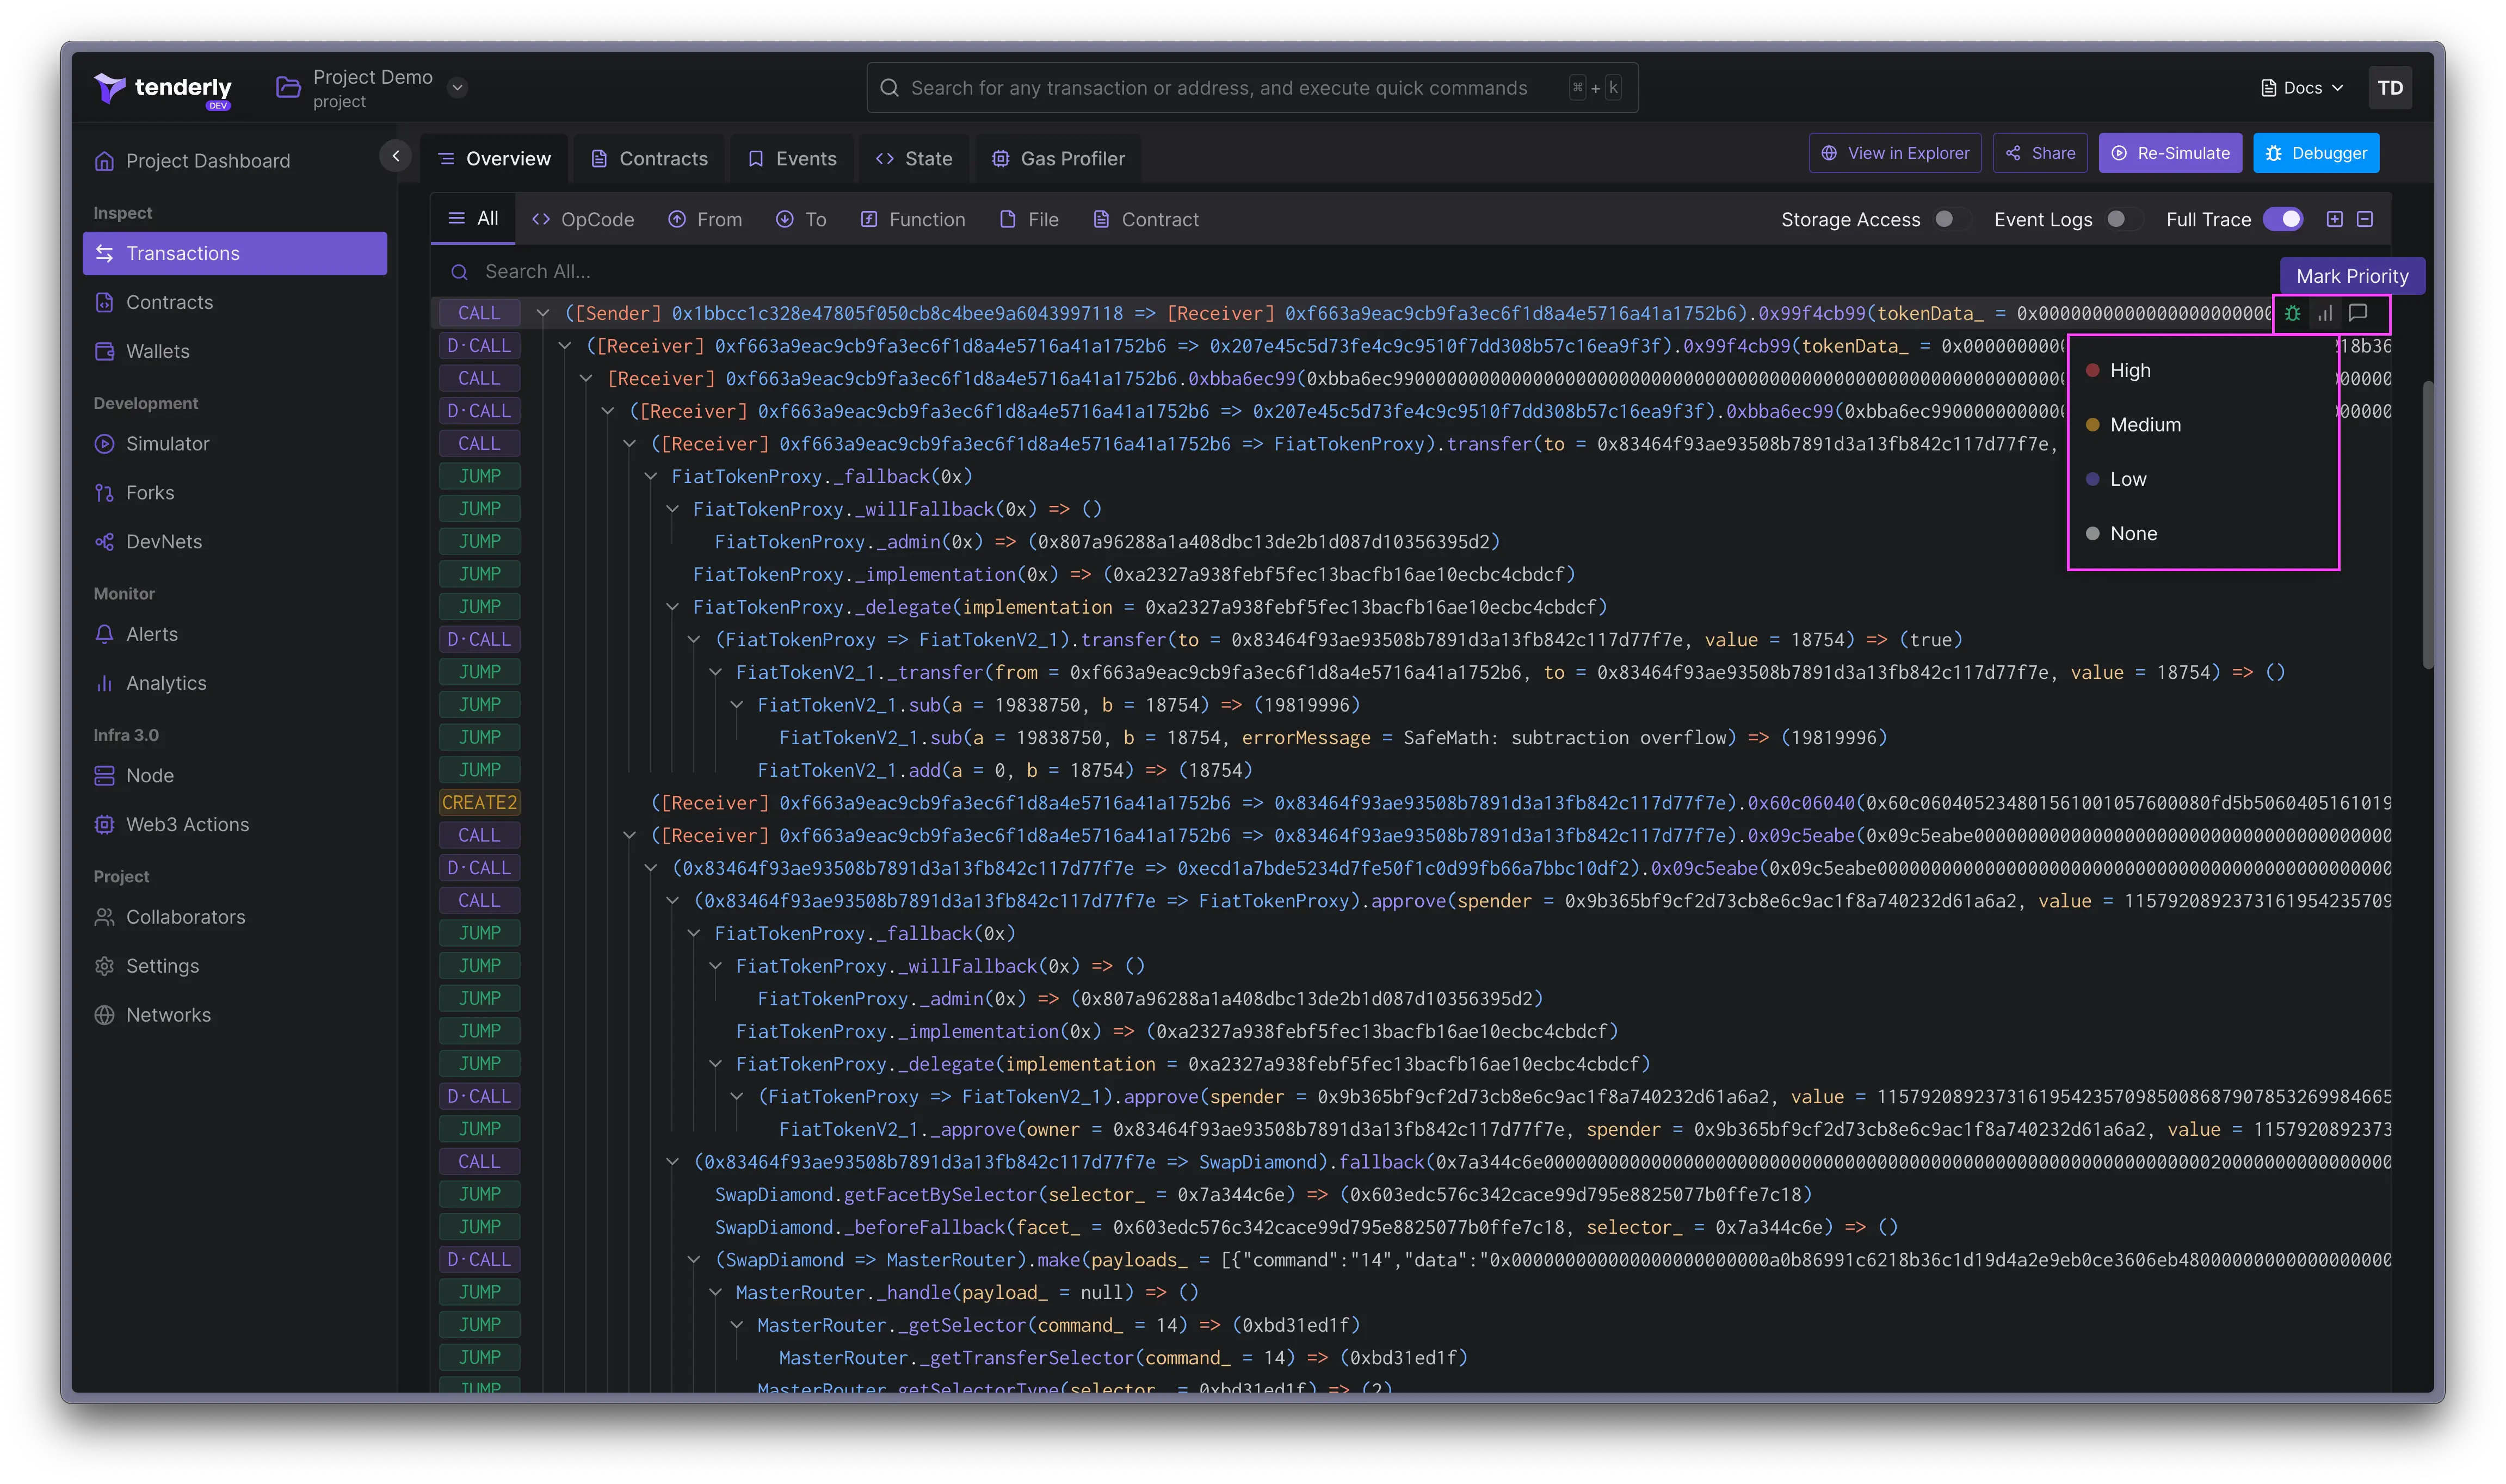
 在查看调用追踪时,您可能希望**为各个元素设置优先级**为**高**、**中**或**低**。将鼠标悬停在调用追踪中的任何元素上,然后点击折线图图标以设置或移除优先级。
 当您在追踪中发现有问题的调用并希望提醒团队进行调查时,优先级设置功能非常有帮助。
## 代币转账
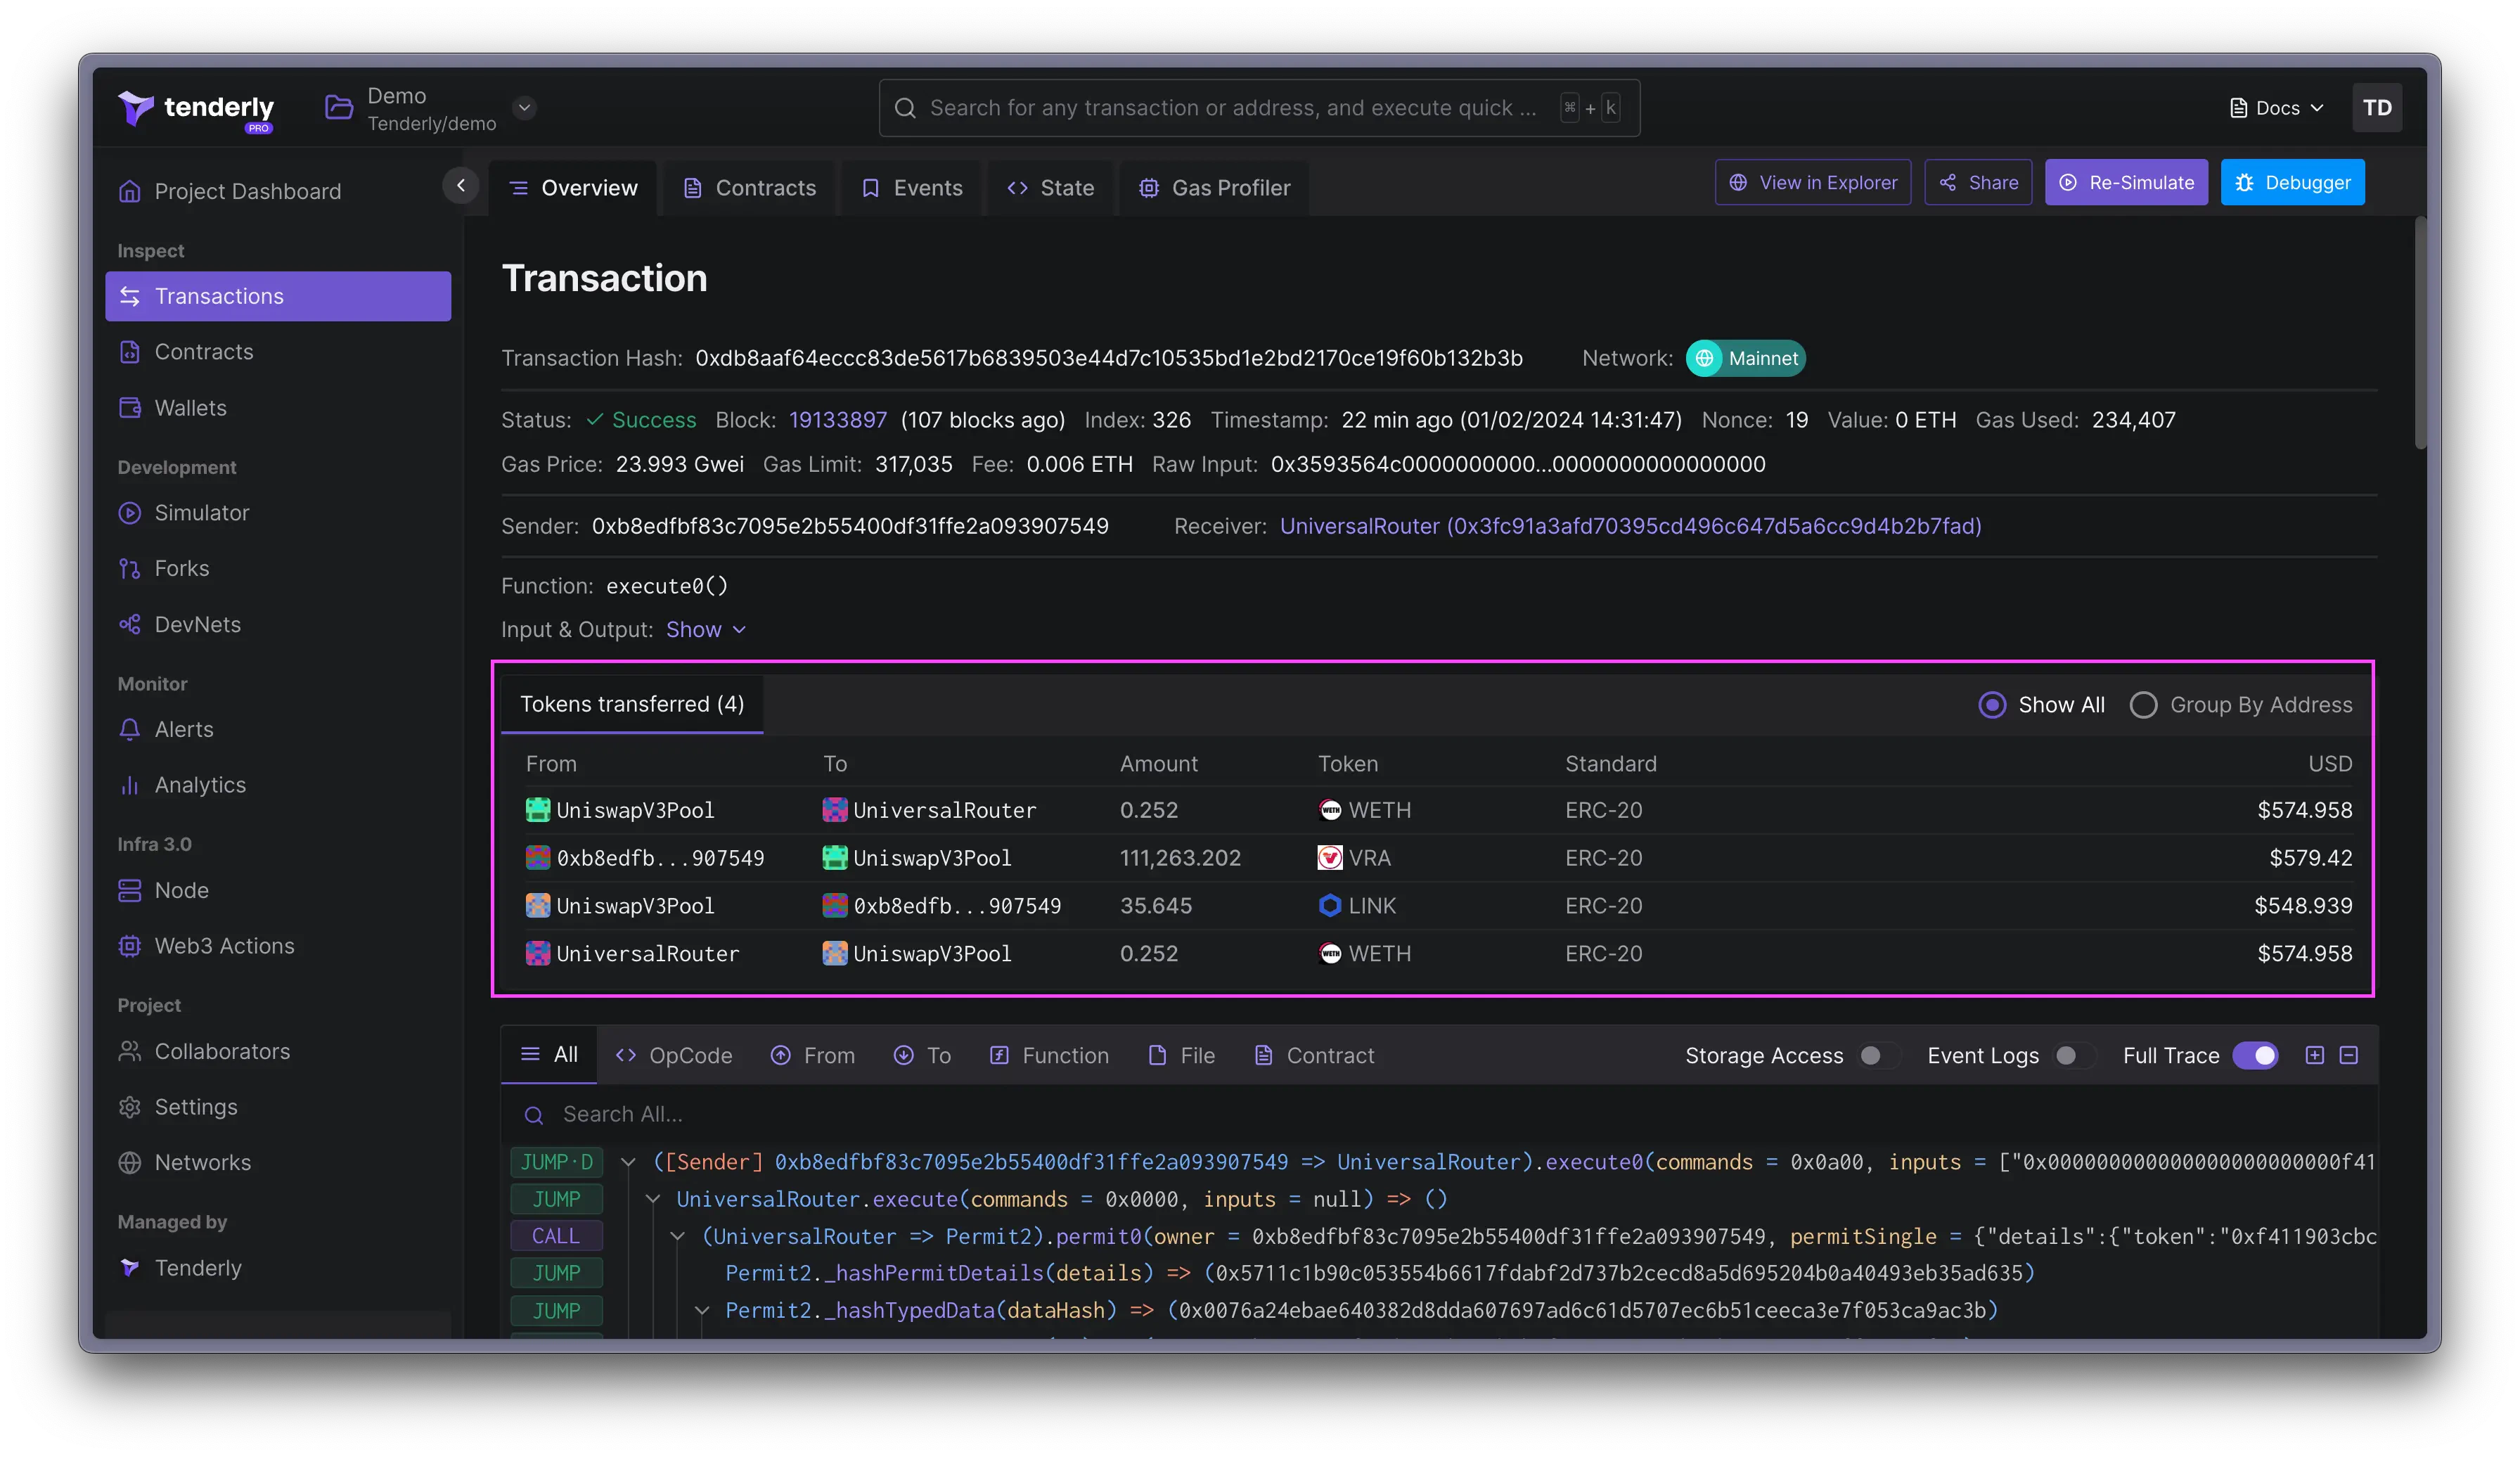
**Tokens Transfers** 面板显示交易中发生的所有资产转账,包括使用 CoinGecko 数据转换为美元的余额和资产变化。
当您在追踪中发现有问题的调用并希望提醒团队进行调查时,优先级设置功能非常有帮助。
## 代币转账
**Tokens Transfers** 面板显示交易中发生的所有资产转账,包括使用 CoinGecko 数据转换为美元的余额和资产变化。
 ## 资金流向
**Fund Flow** 标签页将所有代币转账可视化为交互式有向图。每个地址是一个节点,每次转账是一条边,布局展示了资产在执行期间所走的完整路径。使用它来追踪多跳交换、闪电贷或任何难以通过扁平转账列表理解的交易。
## 涉及的合约
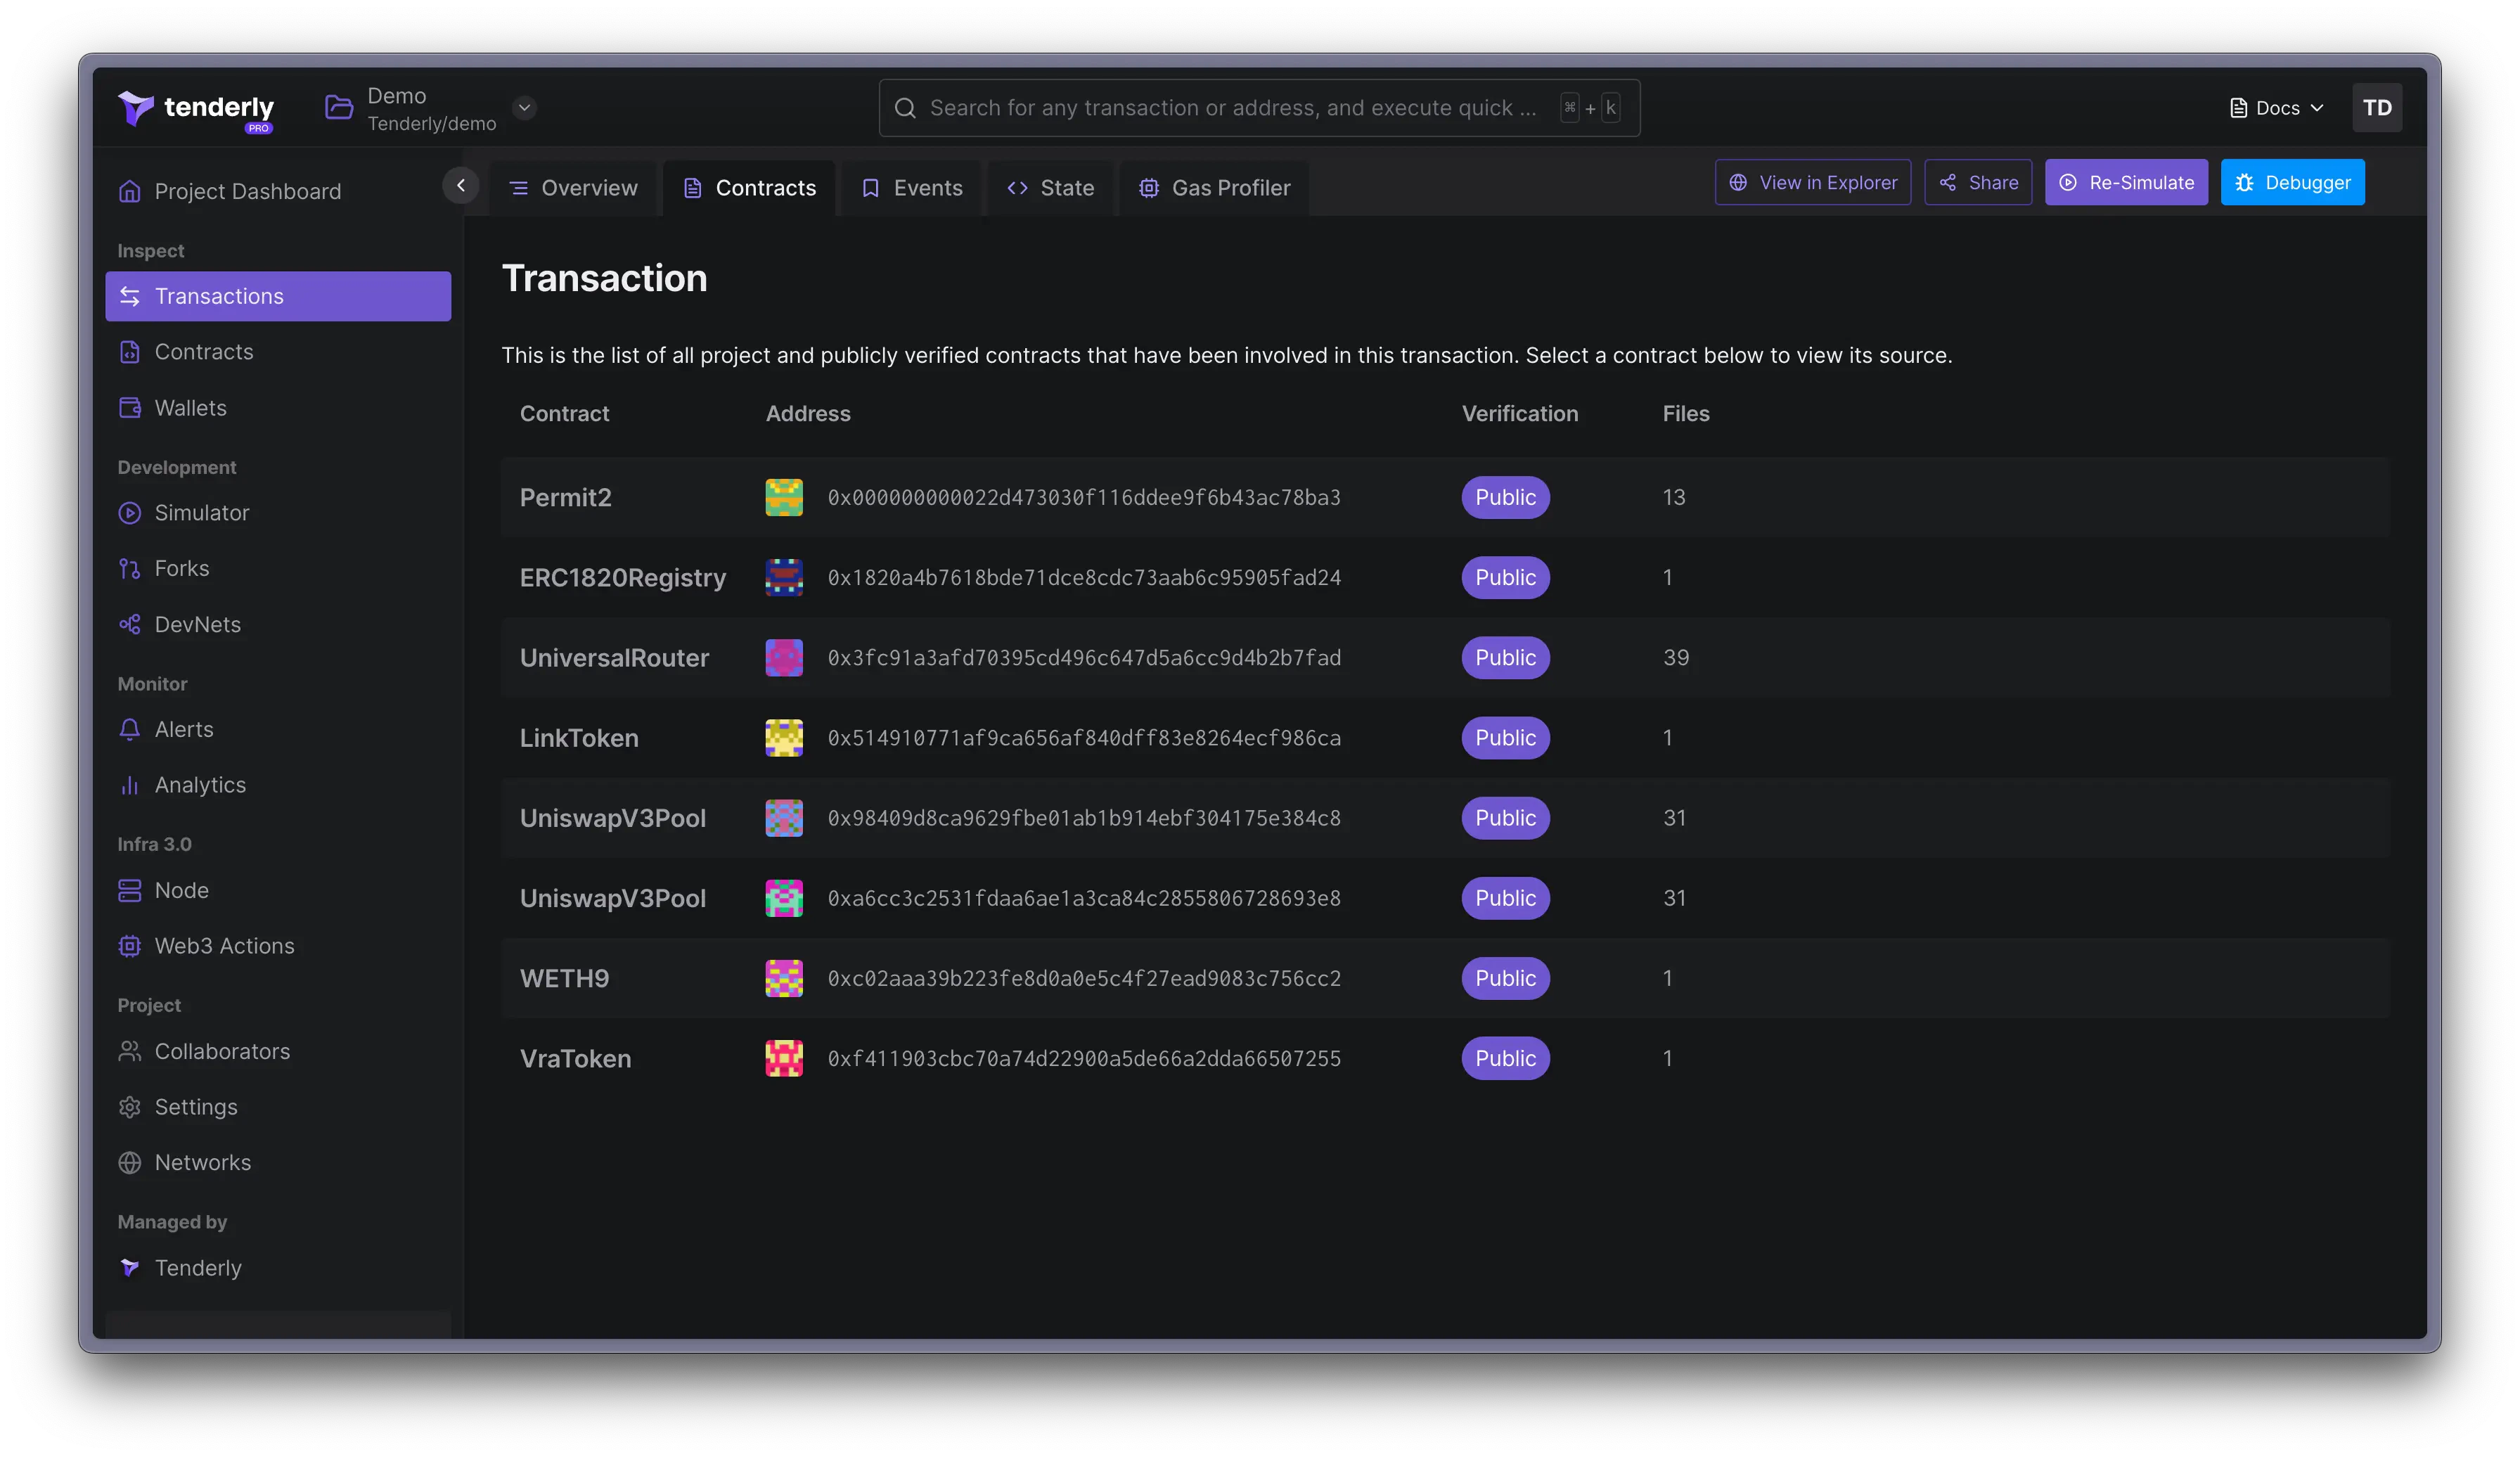
**Contracts** 标签页包含参与交易执行的所有合约的列表。点击特定合约以查看其源代码。
## 资金流向
**Fund Flow** 标签页将所有代币转账可视化为交互式有向图。每个地址是一个节点,每次转账是一条边,布局展示了资产在执行期间所走的完整路径。使用它来追踪多跳交换、闪电贷或任何难以通过扁平转账列表理解的交易。
## 涉及的合约
**Contracts** 标签页包含参与交易执行的所有合约的列表。点击特定合约以查看其源代码。
 ## 发出的事件
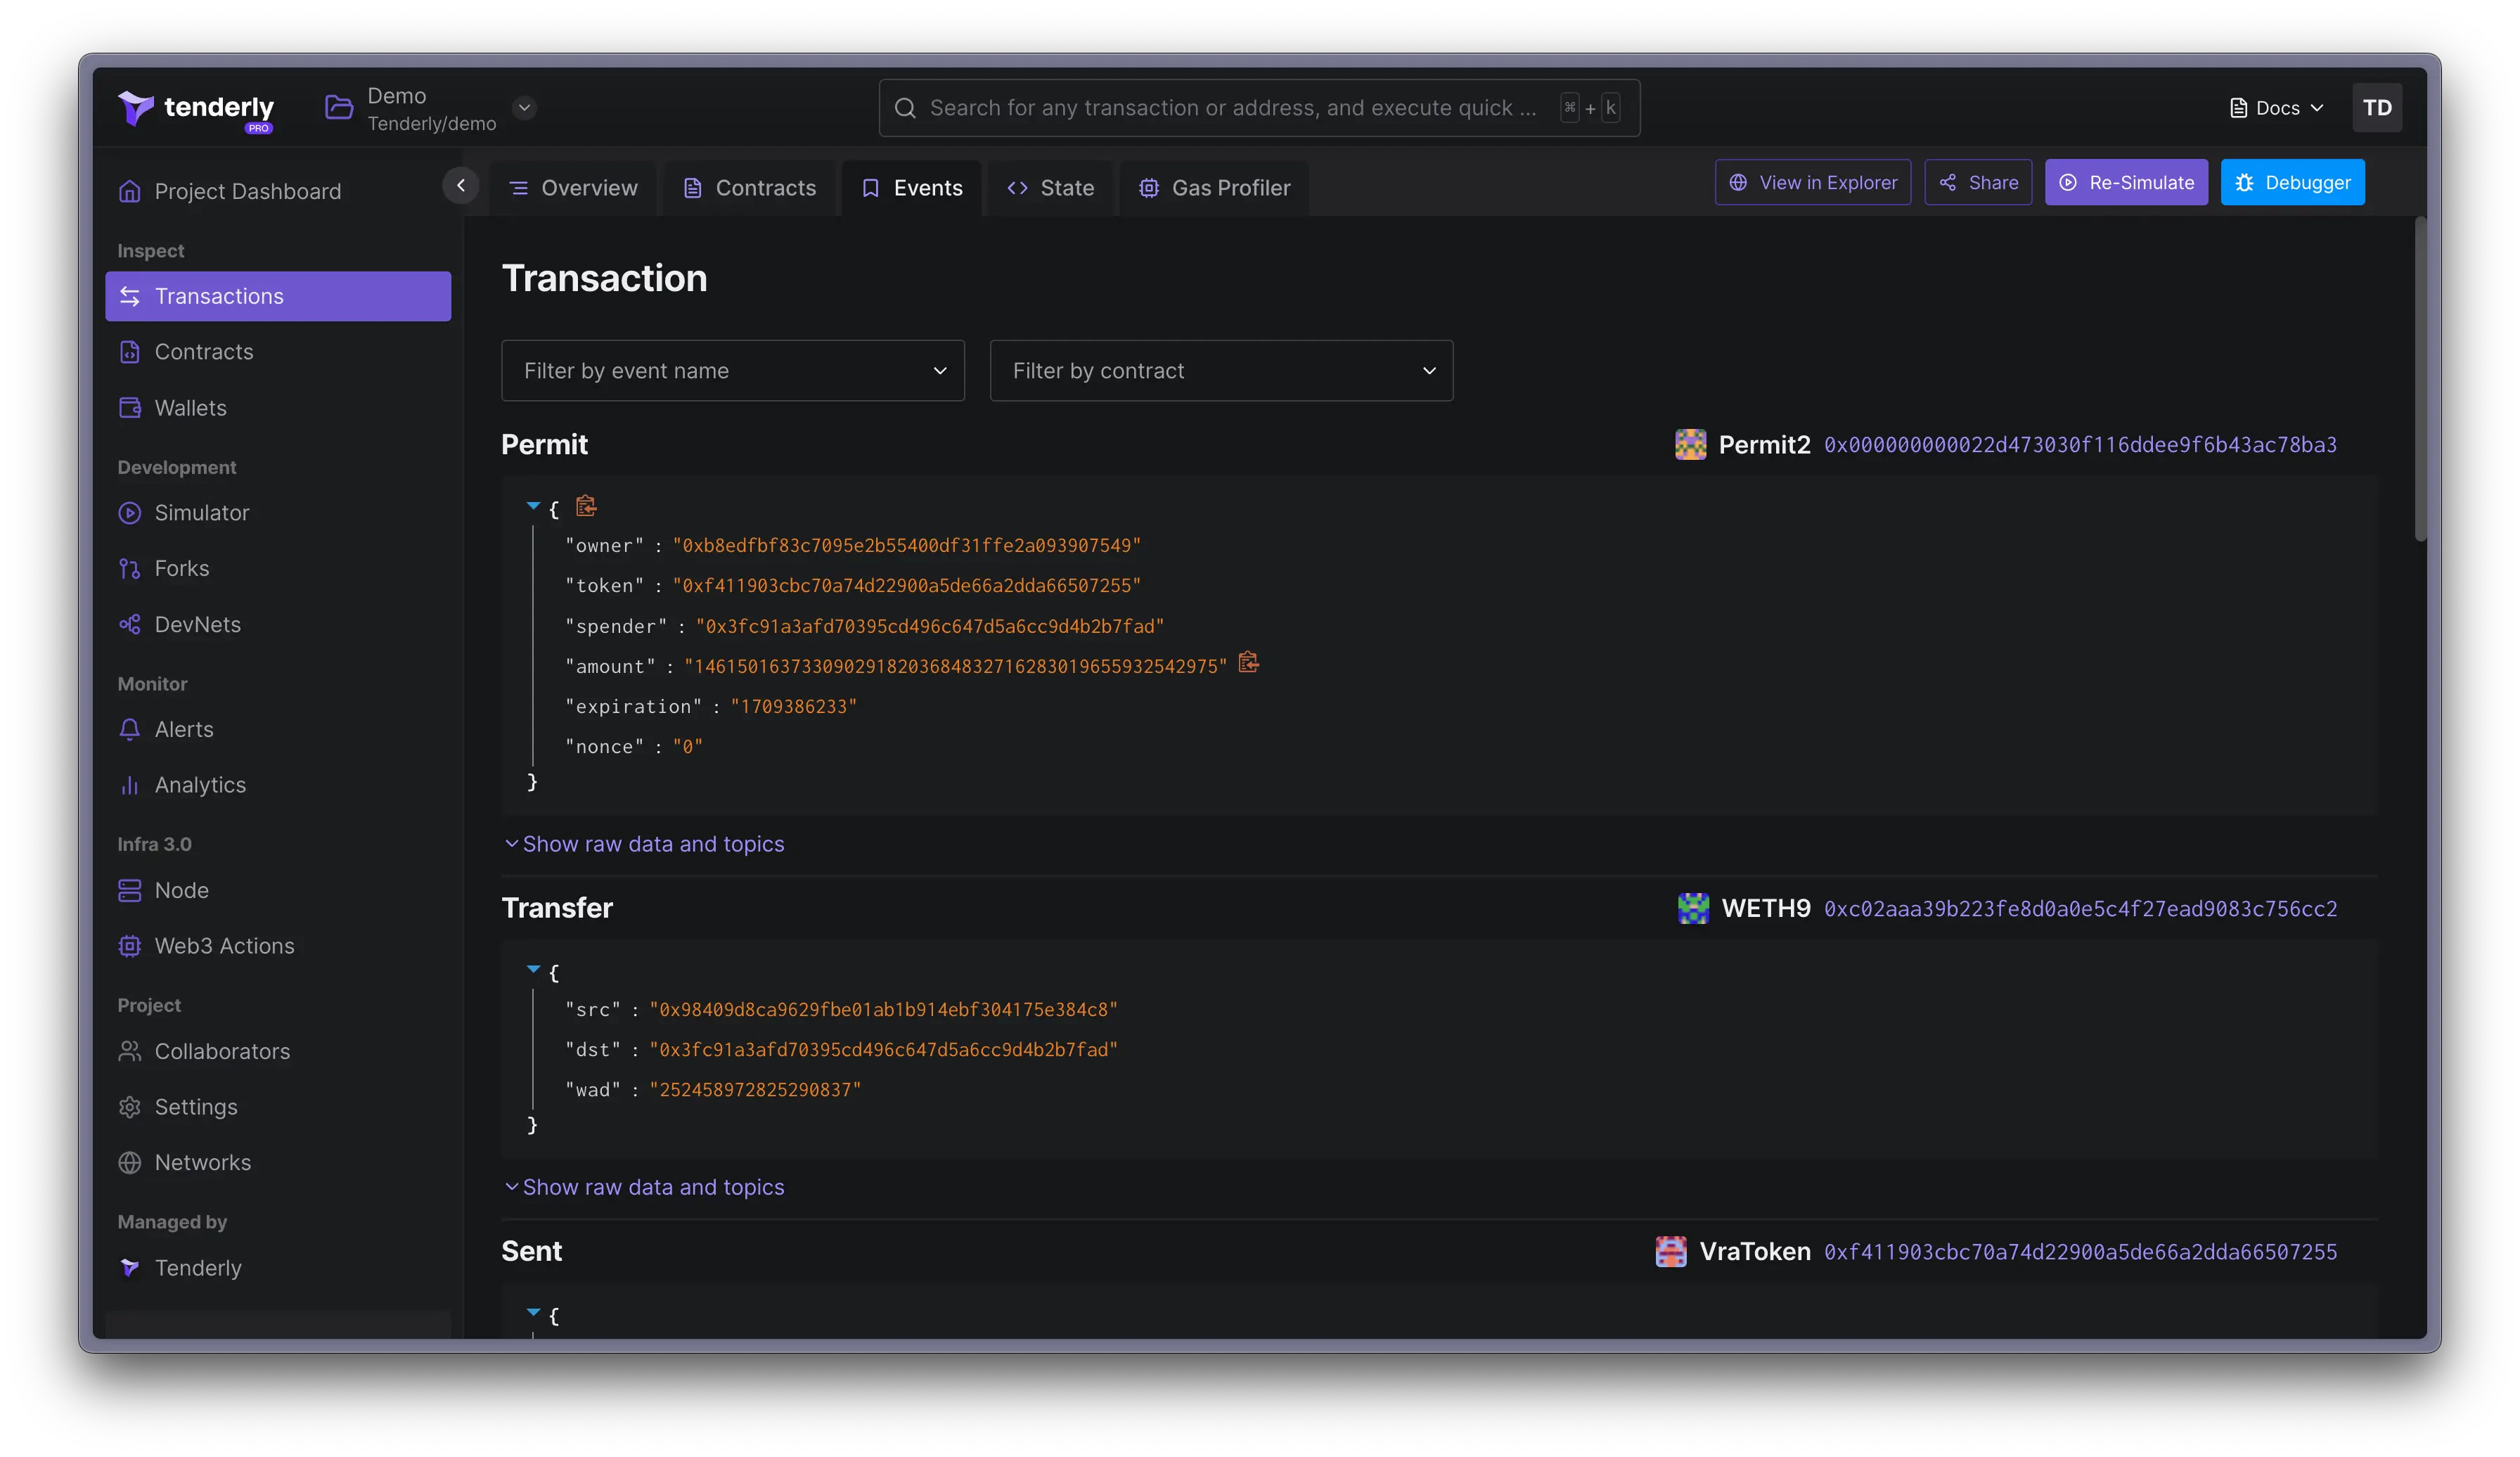
**Events** 标签页列出了交易触发的所有事件。这与在调用追踪中开启 Events Logs 切换时看到的数据相同。显示的数据格式有所不同。如果合约已验证,您将看到解码数据,但也提供原始数据。
## 发出的事件
**Events** 标签页列出了交易触发的所有事件。这与在调用追踪中开启 Events Logs 切换时看到的数据相同。显示的数据格式有所不同。如果合约已验证,您将看到解码数据,但也提供原始数据。
 ## 状态变更
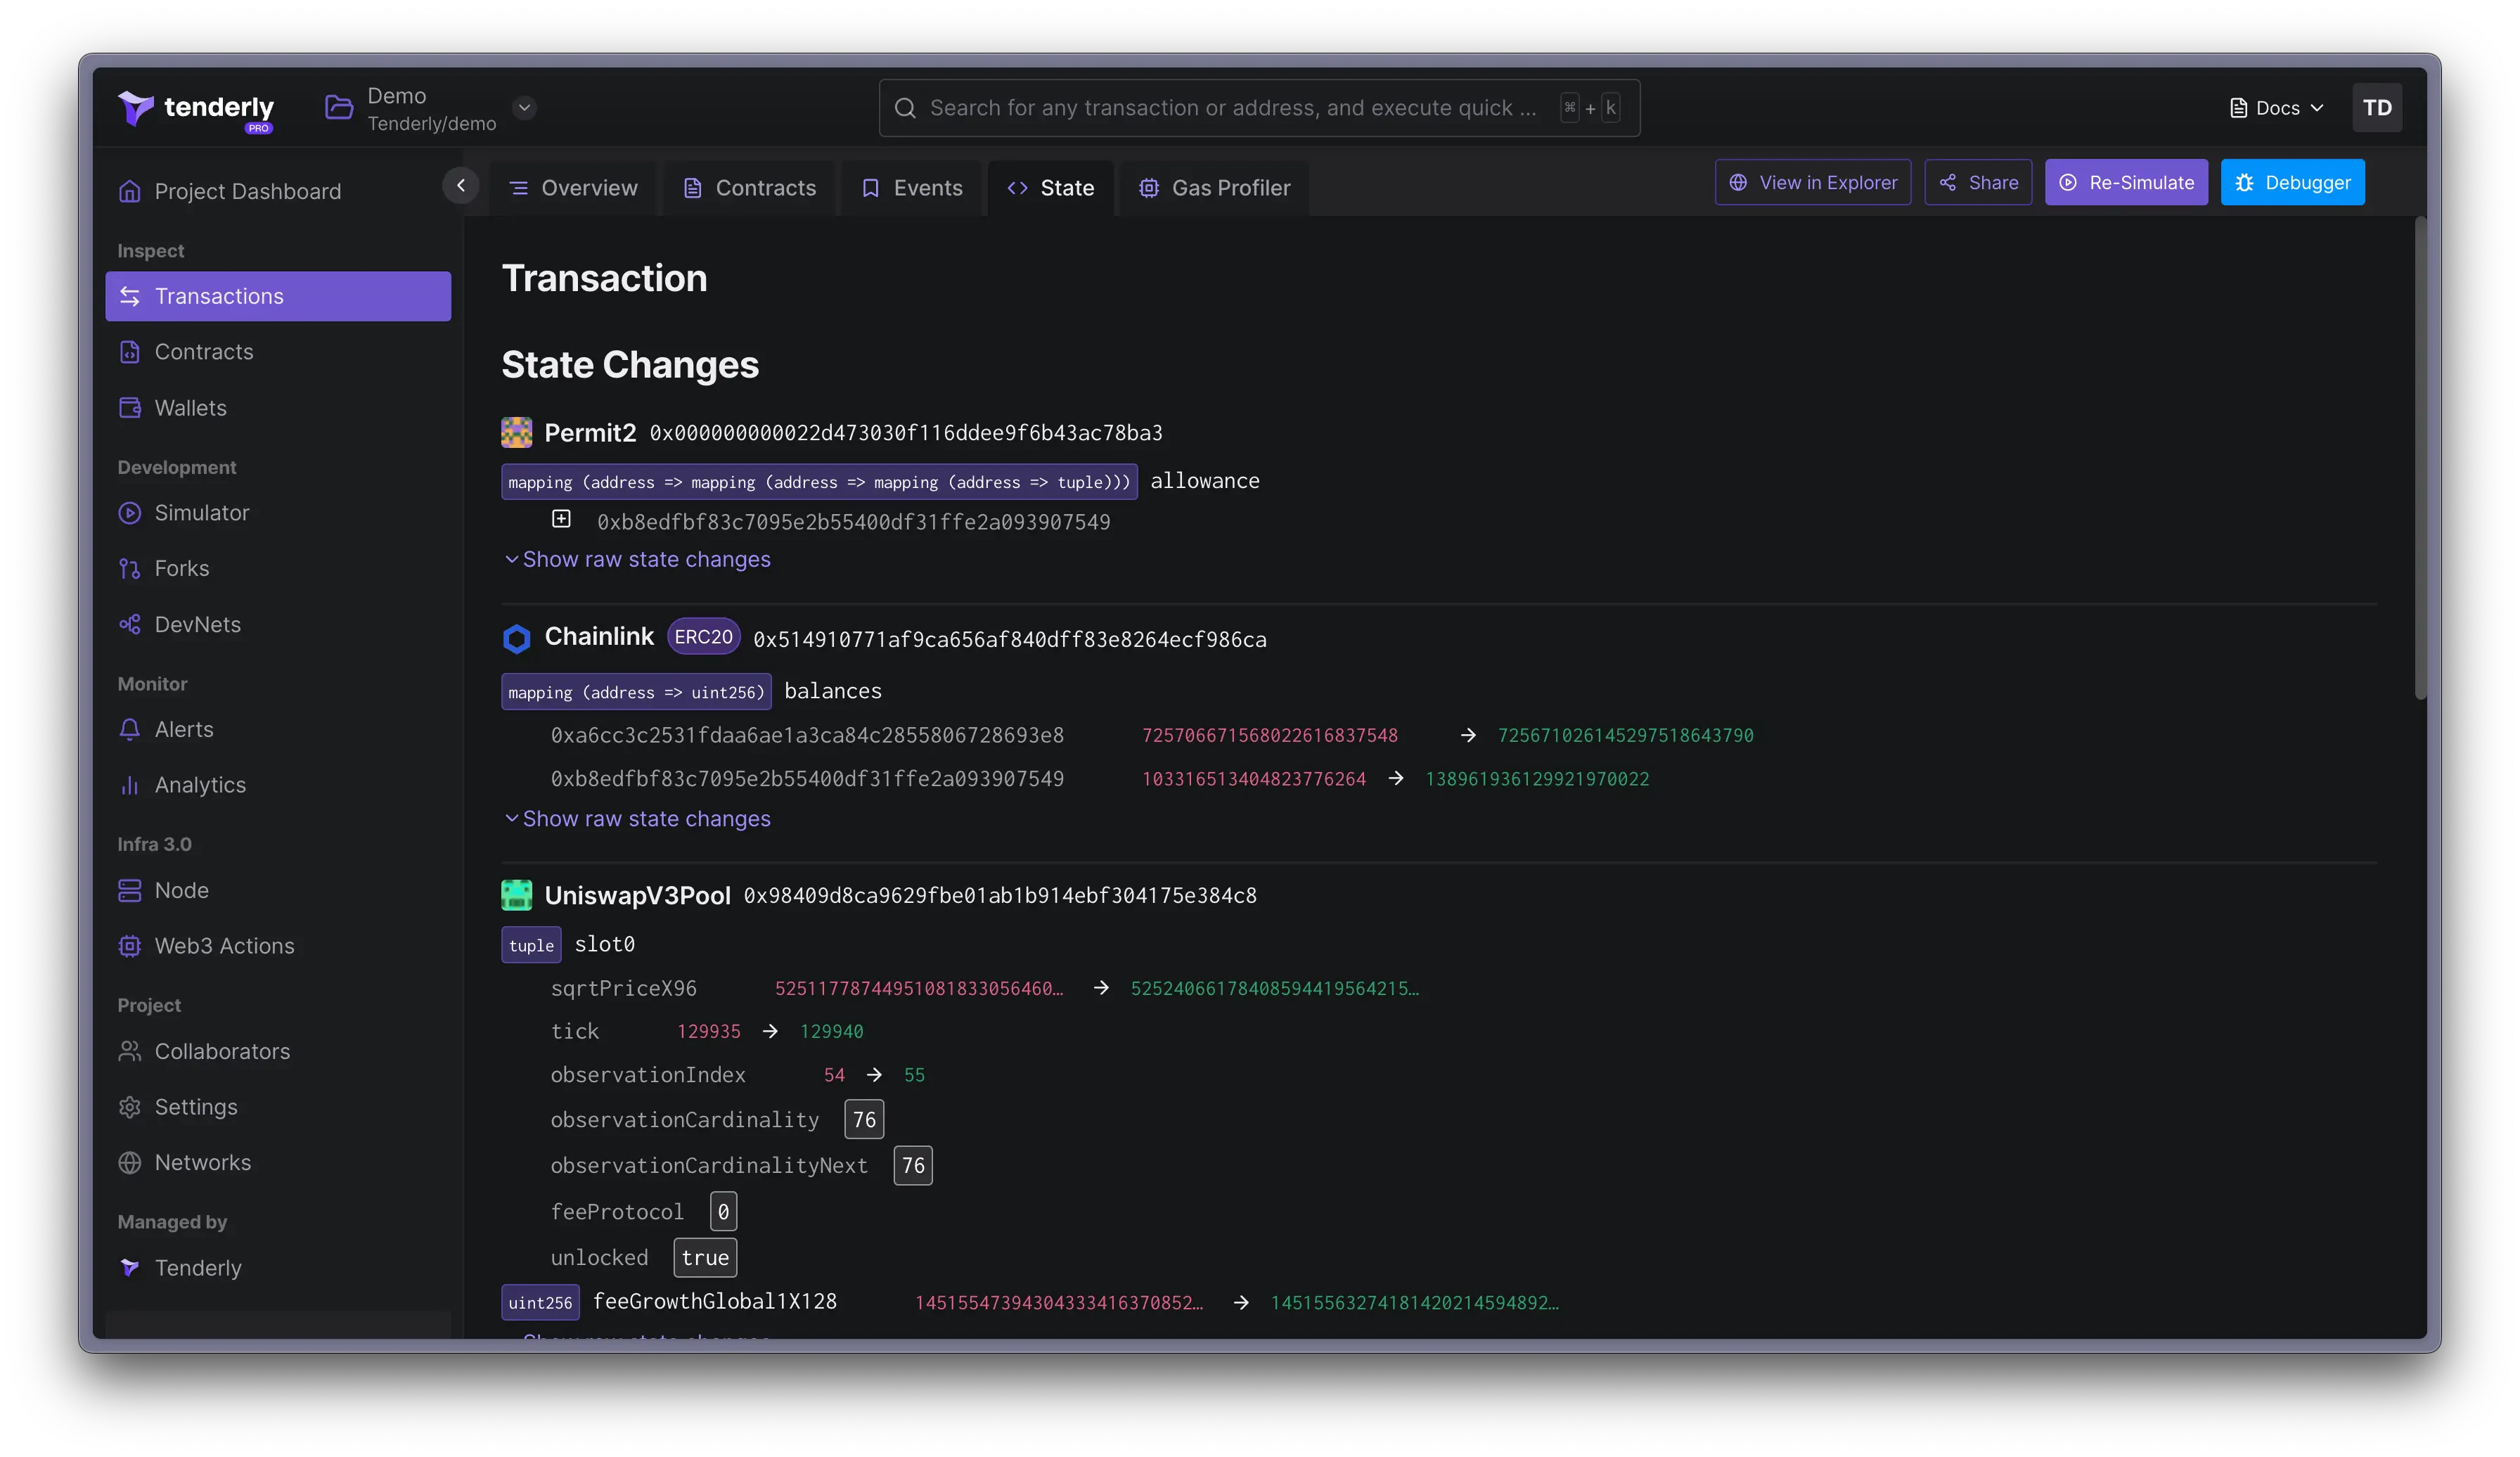
**State** 标签页显示以某种方式改变了区块链状态的所有事件或变量,包括旧值和新值。所有数据都会被解码,但您也可以查看原始状态变更。
## 状态变更
**State** 标签页显示以某种方式改变了区块链状态的所有事件或变量,包括旧值和新值。所有数据都会被解码,但您也可以查看原始状态变更。
 您可以通过 RPC 获取状态变更相关数据。进一步了解
[`tenderly_trace`](/node-rpc/rpc-reference?network=ethereum-mainnet\&method=tenderly_traceTransaction)、
[`tenderly_simulate`](/node-rpc/rpc-reference?network=ethereum-mainnet\&method=tenderly_simulateTransaction) 和
[`tenderly_simulateBundle`](/node-rpc/rpc-reference?network=ethereum-mainnet\&method=tenderly_simulateBundle) RPC 方法。
## Gas Profiler
**Gas Profiler** 标签页提供一种可视化方式,展示执行交易时如何、在何处以及使用了多少 gas。这些数据以火焰图形式显示,包含按函数和操作码细分的 gas 使用详情。
您可以通过 RPC 获取状态变更相关数据。进一步了解
[`tenderly_trace`](/node-rpc/rpc-reference?network=ethereum-mainnet\&method=tenderly_traceTransaction)、
[`tenderly_simulate`](/node-rpc/rpc-reference?network=ethereum-mainnet\&method=tenderly_simulateTransaction) 和
[`tenderly_simulateBundle`](/node-rpc/rpc-reference?network=ethereum-mainnet\&method=tenderly_simulateBundle) RPC 方法。
## Gas Profiler
**Gas Profiler** 标签页提供一种可视化方式,展示执行交易时如何、在何处以及使用了多少 gas。这些数据以火焰图形式显示,包含按函数和操作码细分的 gas 使用详情。
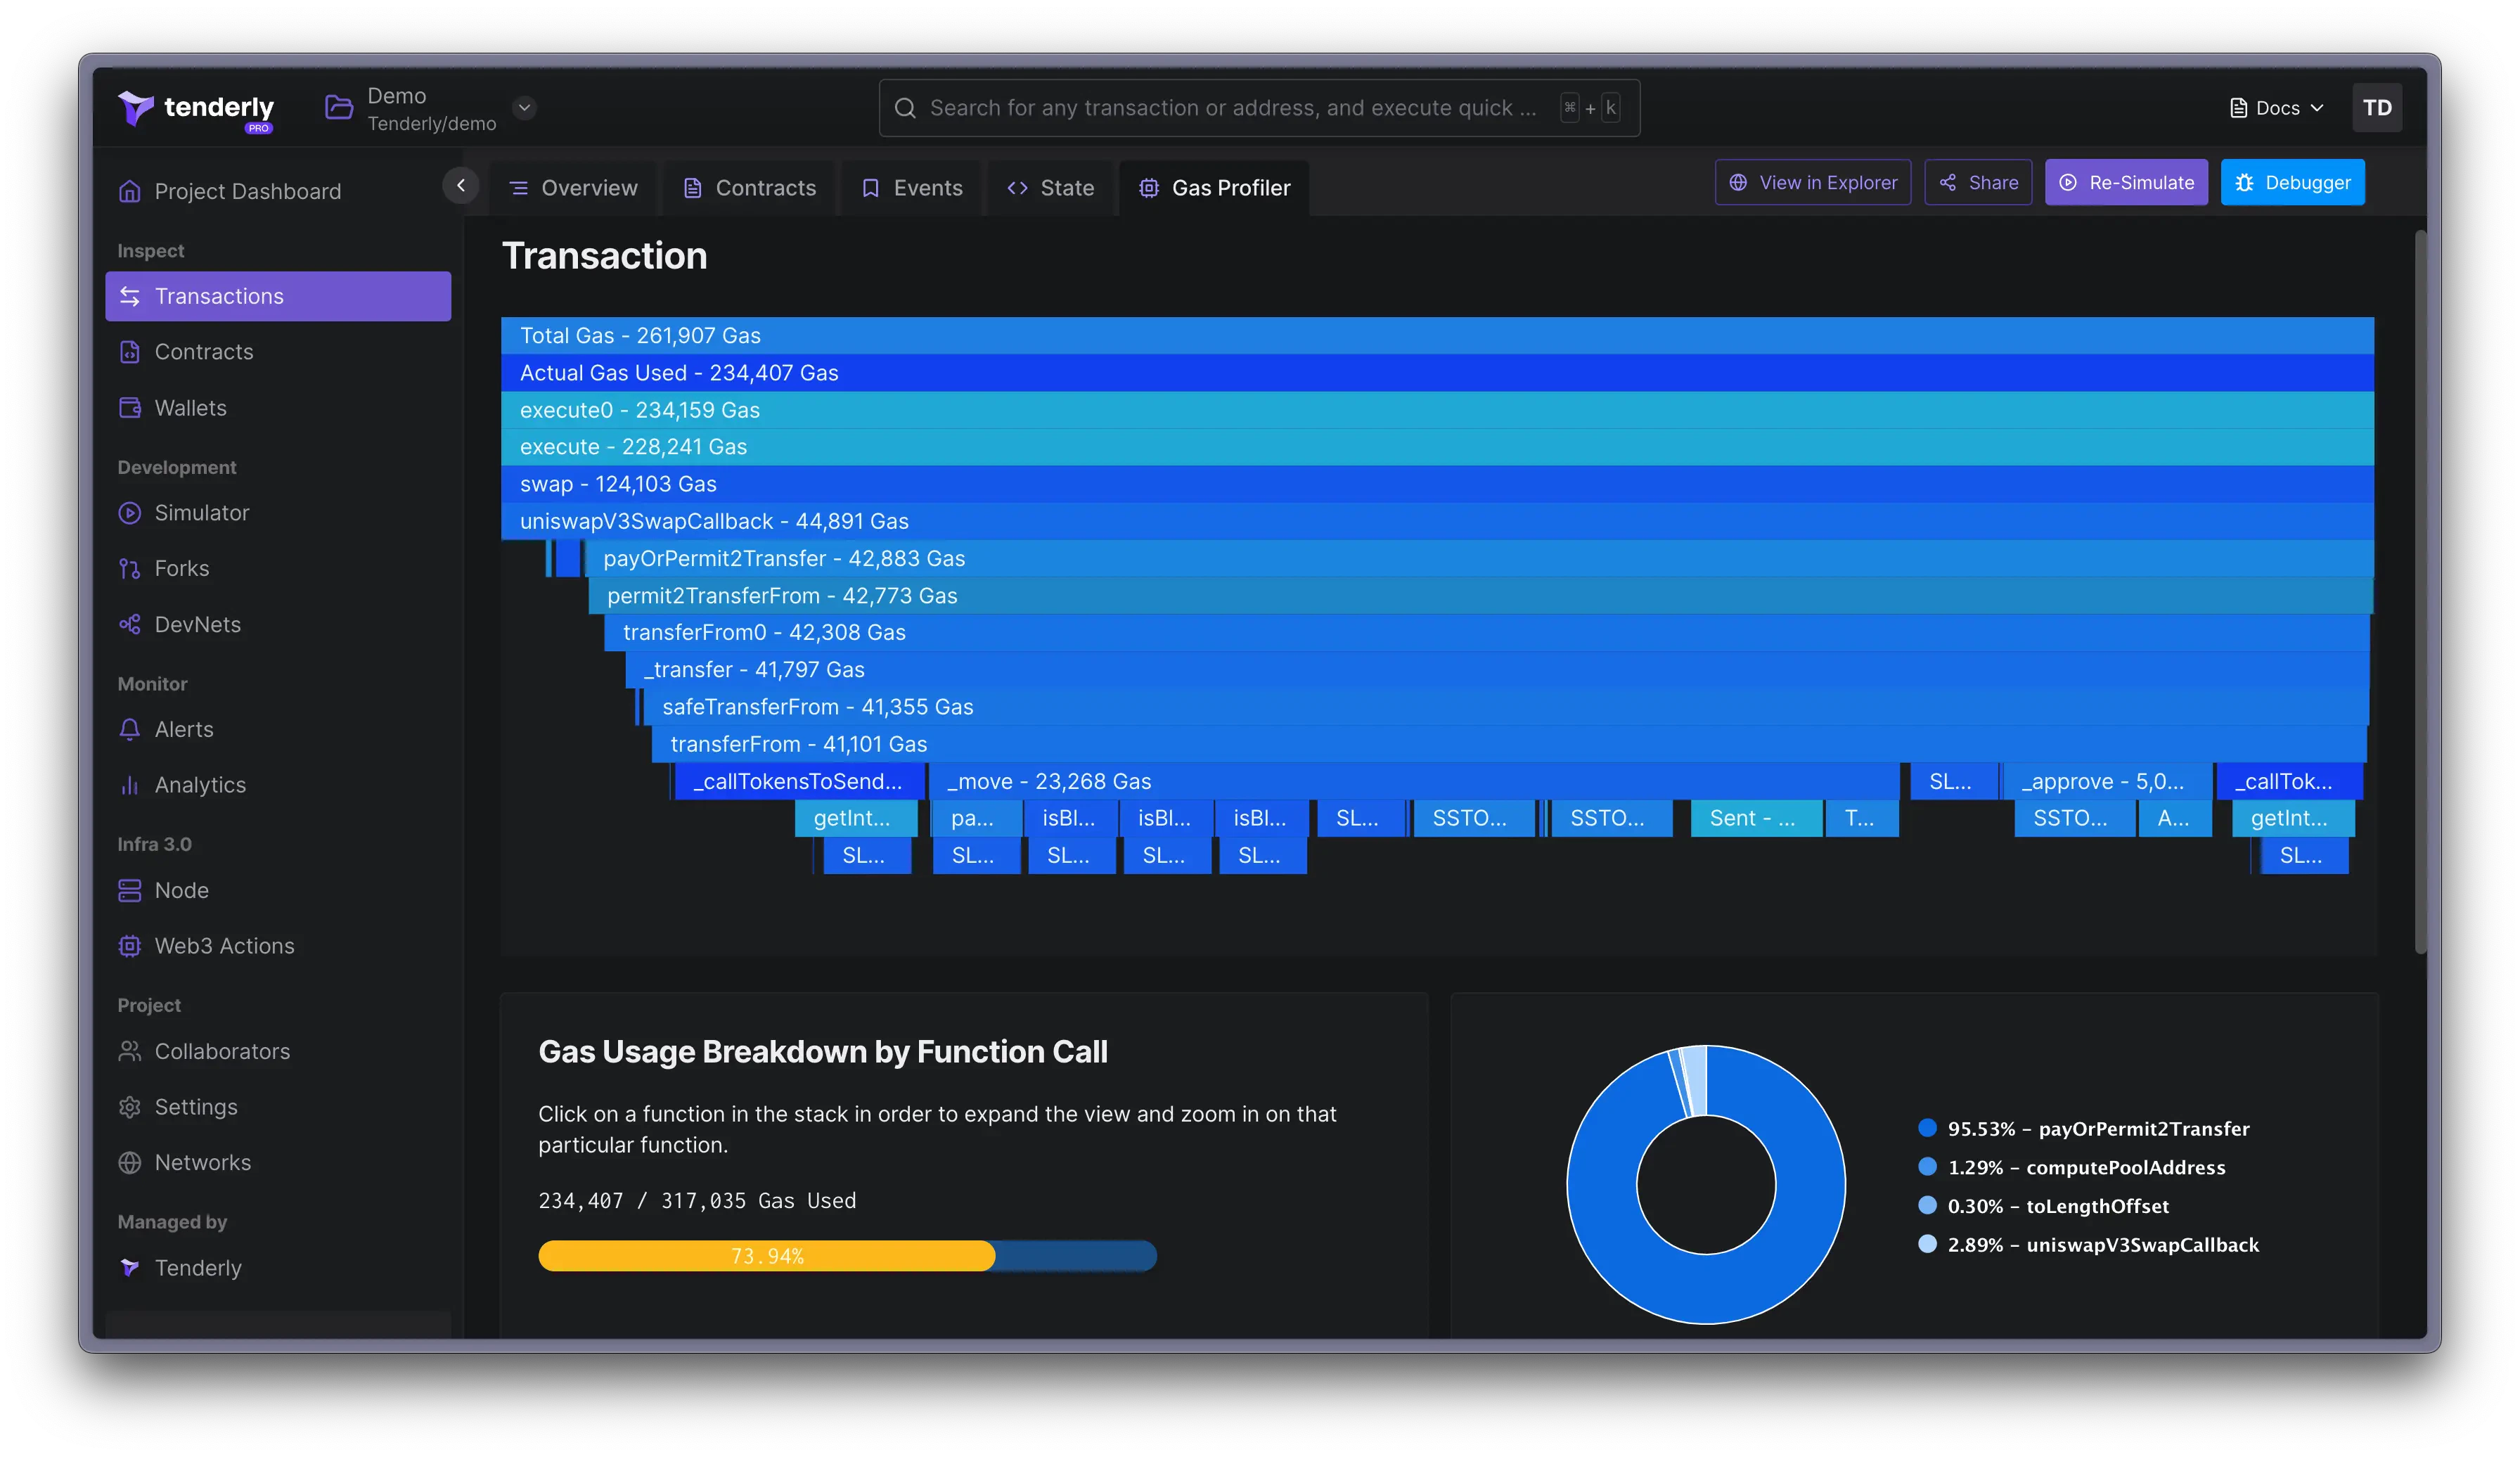 您可以点击任何函数或操作码,深入了解 gas 是如何被使用的。
当您准备好开始调试有问题的函数并优化智能合约的 gas 消耗时,点击 **View in Debugger**。Gas Profiler 为您提供有关已使用 gas 和总 gas 使用情况的洞察。
查看此详细指南以了解如何使用 Gas Profiler 以及 gas 消耗的计算方式:
您可以点击任何函数或操作码,深入了解 gas 是如何被使用的。
当您准备好开始调试有问题的函数并优化智能合约的 gas 消耗时,点击 **View in Debugger**。Gas Profiler 为您提供有关已使用 gas 和总 gas 使用情况的洞察。
查看此详细指南以了解如何使用 Gas Profiler 以及 gas 消耗的计算方式: