Debugger quickstart
To use the Debugger, you need to start from a specific transaction. Try this example transaction.- Go to the Transactions tab on the left side or search for a transaction hash in the top Explorer bar.
- Click the Debugger button located at the top right.
- Execution trace (top left): Displays the sequence of calls made during the transaction.
- Smart contract source code (top right): Shows the code of the contract being interacted with.
- Stack trace (bottom left): Lists the methods called leading up to the current function.
- Call information (bottom right): Provides detailed info about the current call.
Execution trace
The Execution Trace section lets you see every call made during a transaction’s life cycle. A handy toggle allows you to filter the view between the full trace or just theCALLs and DELEGATECALLs.
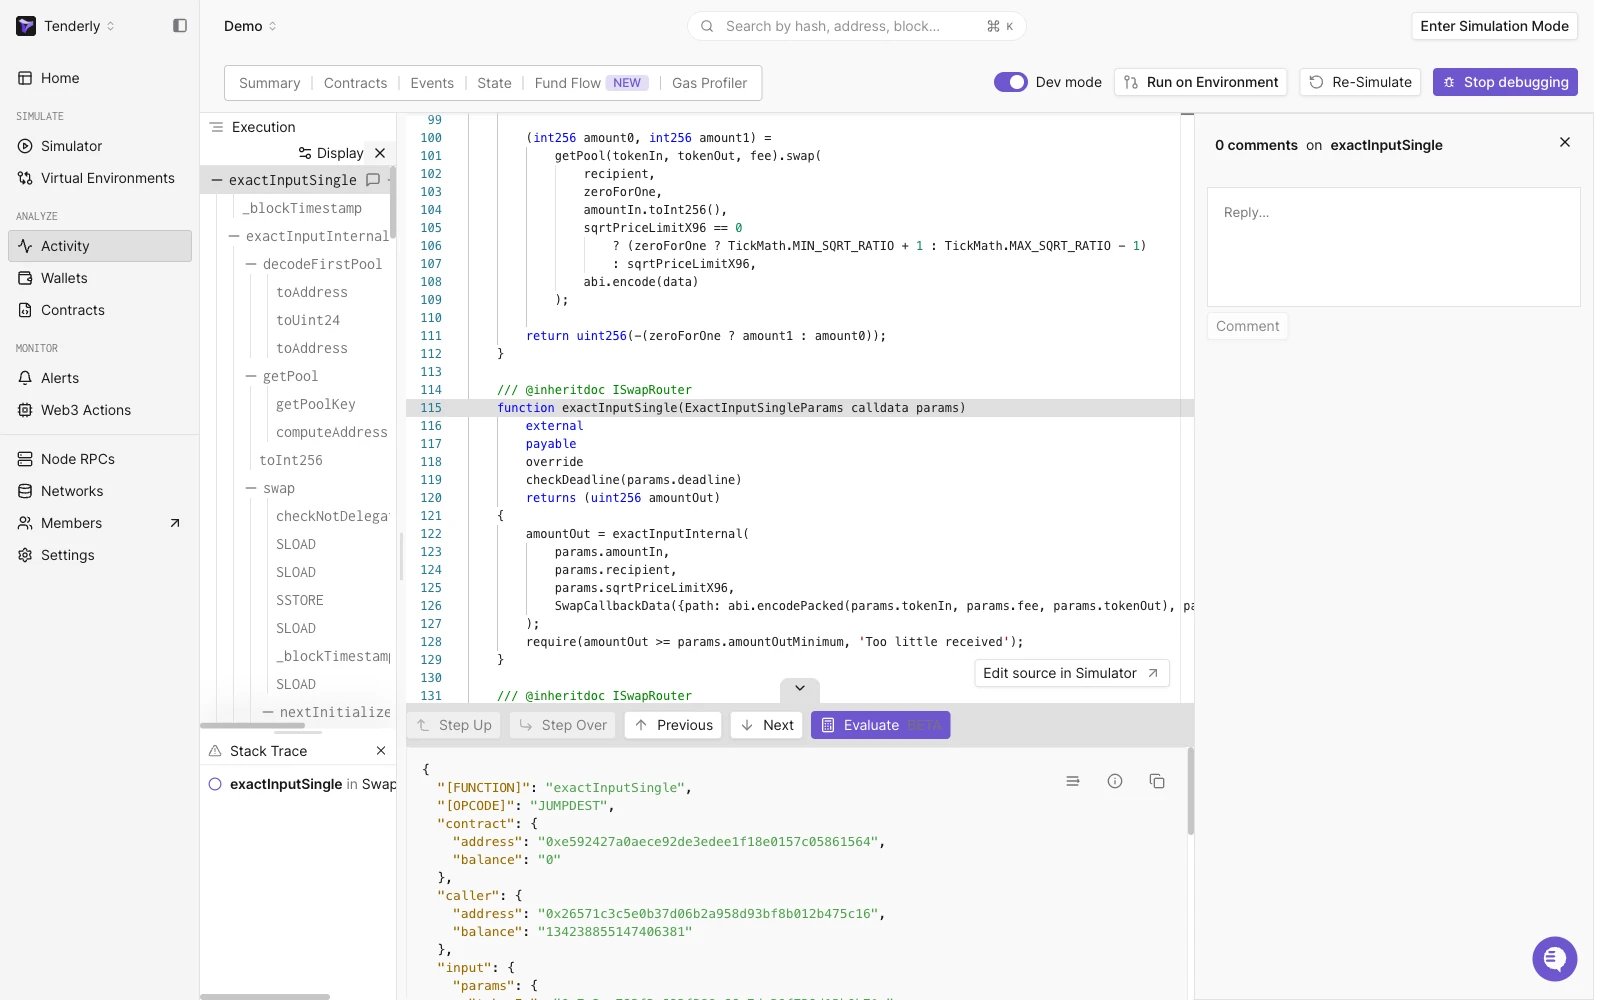
You can also leave comments directly on any part of the trace, useful for collaboration or personal notes.
Stack trace
The Stack Trace offers a look at the methods that have been invoked leading up to the active function call, giving you a clearer picture of the transaction’s flow.Decoding call information
Here, you get decoded details about the current call in the transaction’s execution trace in JSON format. This includes:- Invoked function’s name
- Opcodes (
JUMP,CALL,DELEGATECALL,STATICCALL,CREATE2,CREATE,REVERT,JUMPDEST) - Contract and caller addresses, plus the caller’s balance
- Decoded inputs and outputs
- Gas usage stats, showing total gas used, gas consumed by the current function, and remaining gas
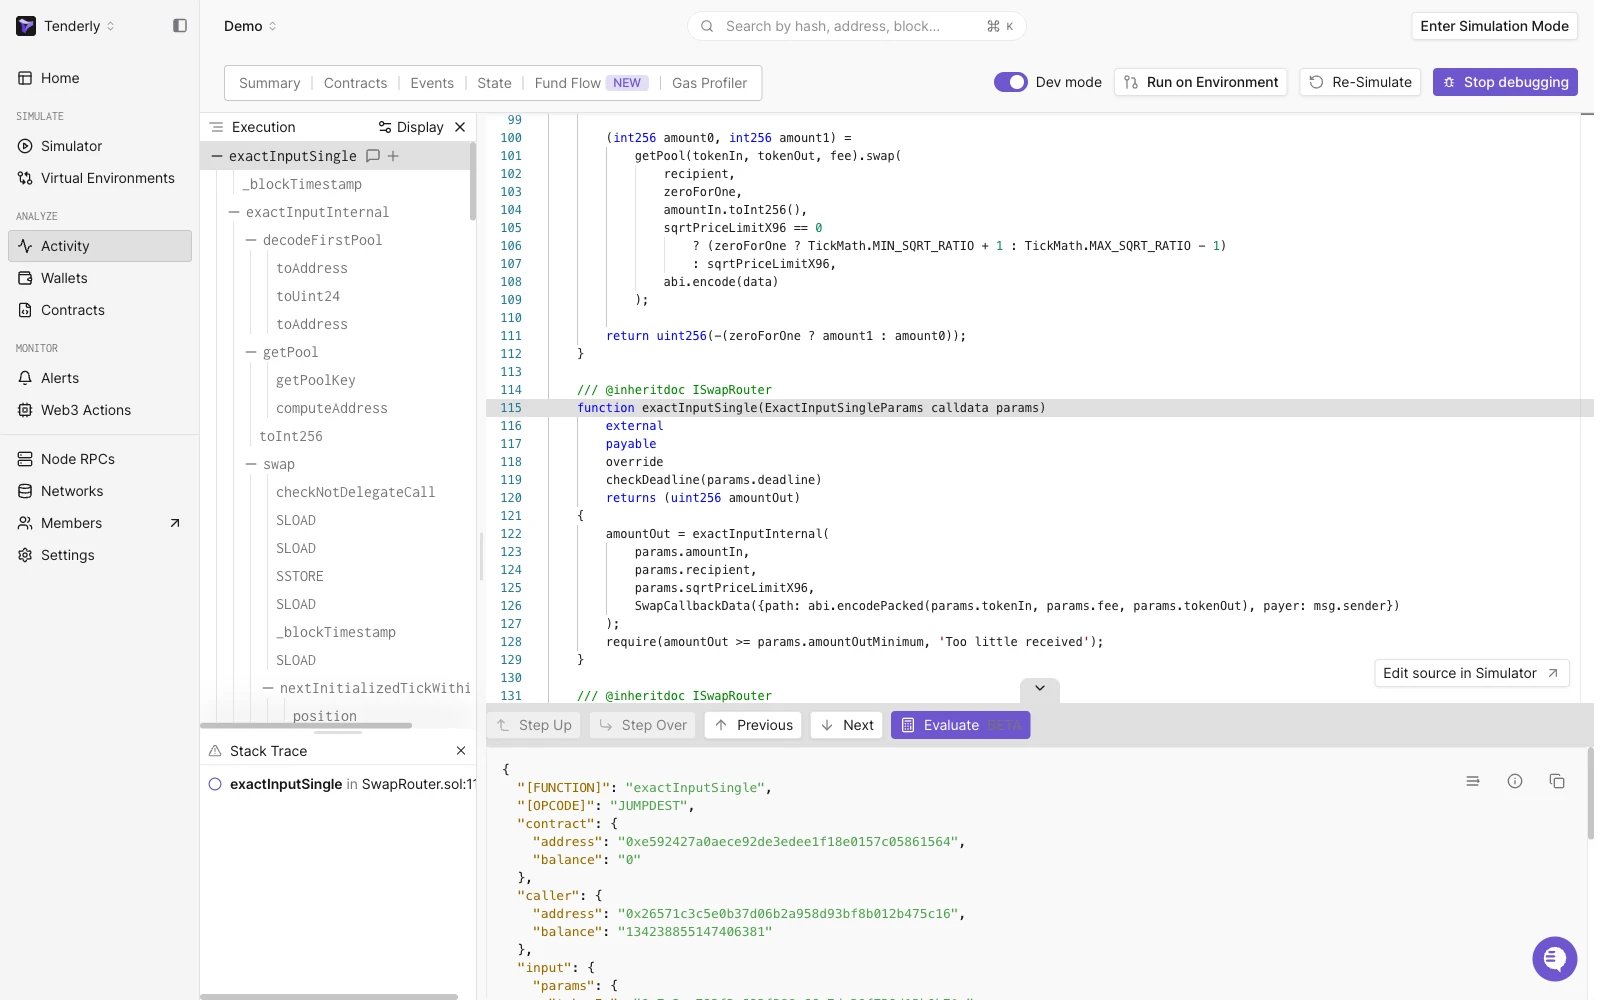
Navigating through the call trace
Jumping through the call trace and code lines is straightforward with the Debugger’s navigation buttons. Next/Previous moves you through the call trace, while Step Up and Step Over help you navigate the stack trace and call levels.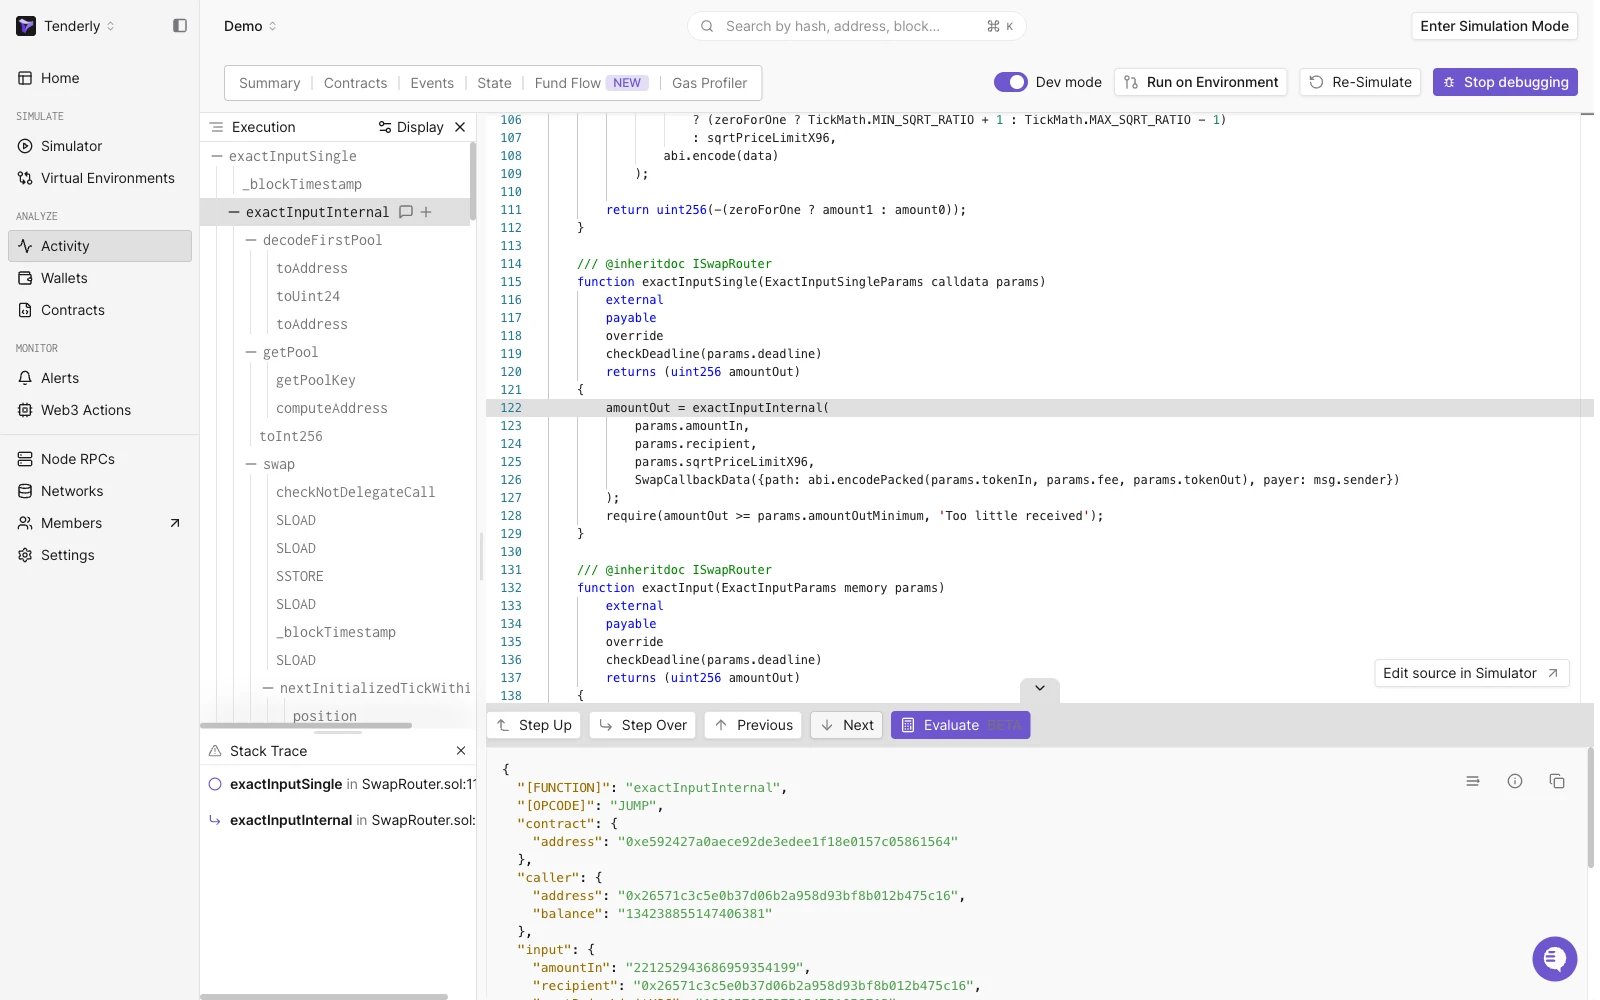
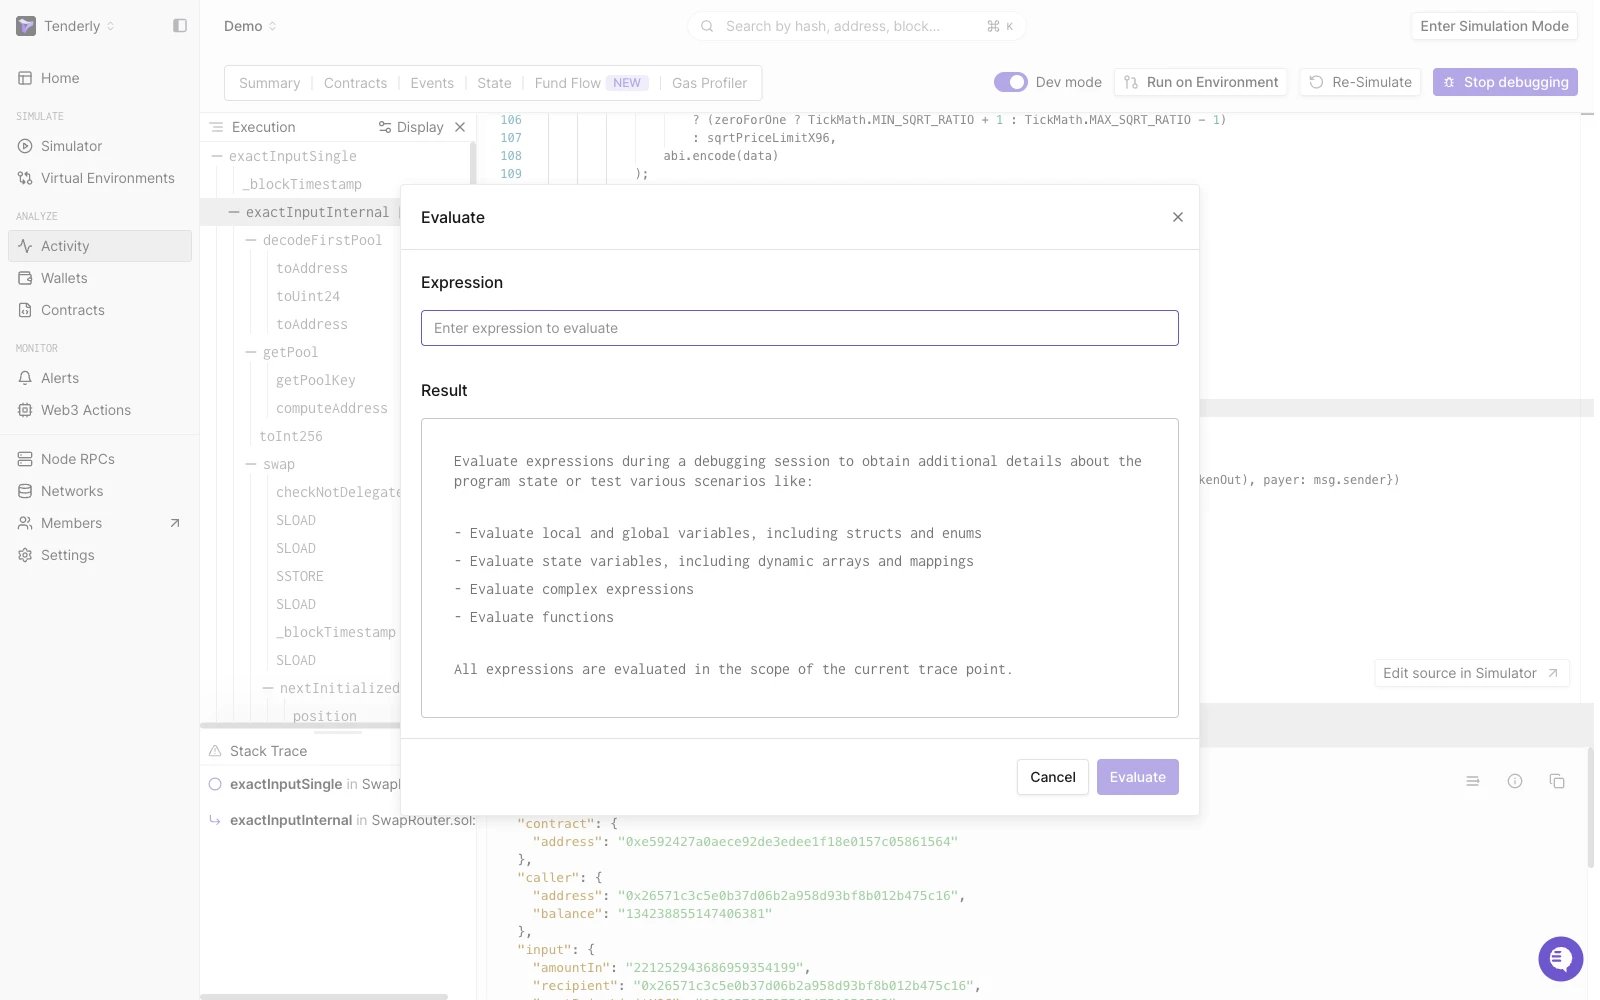
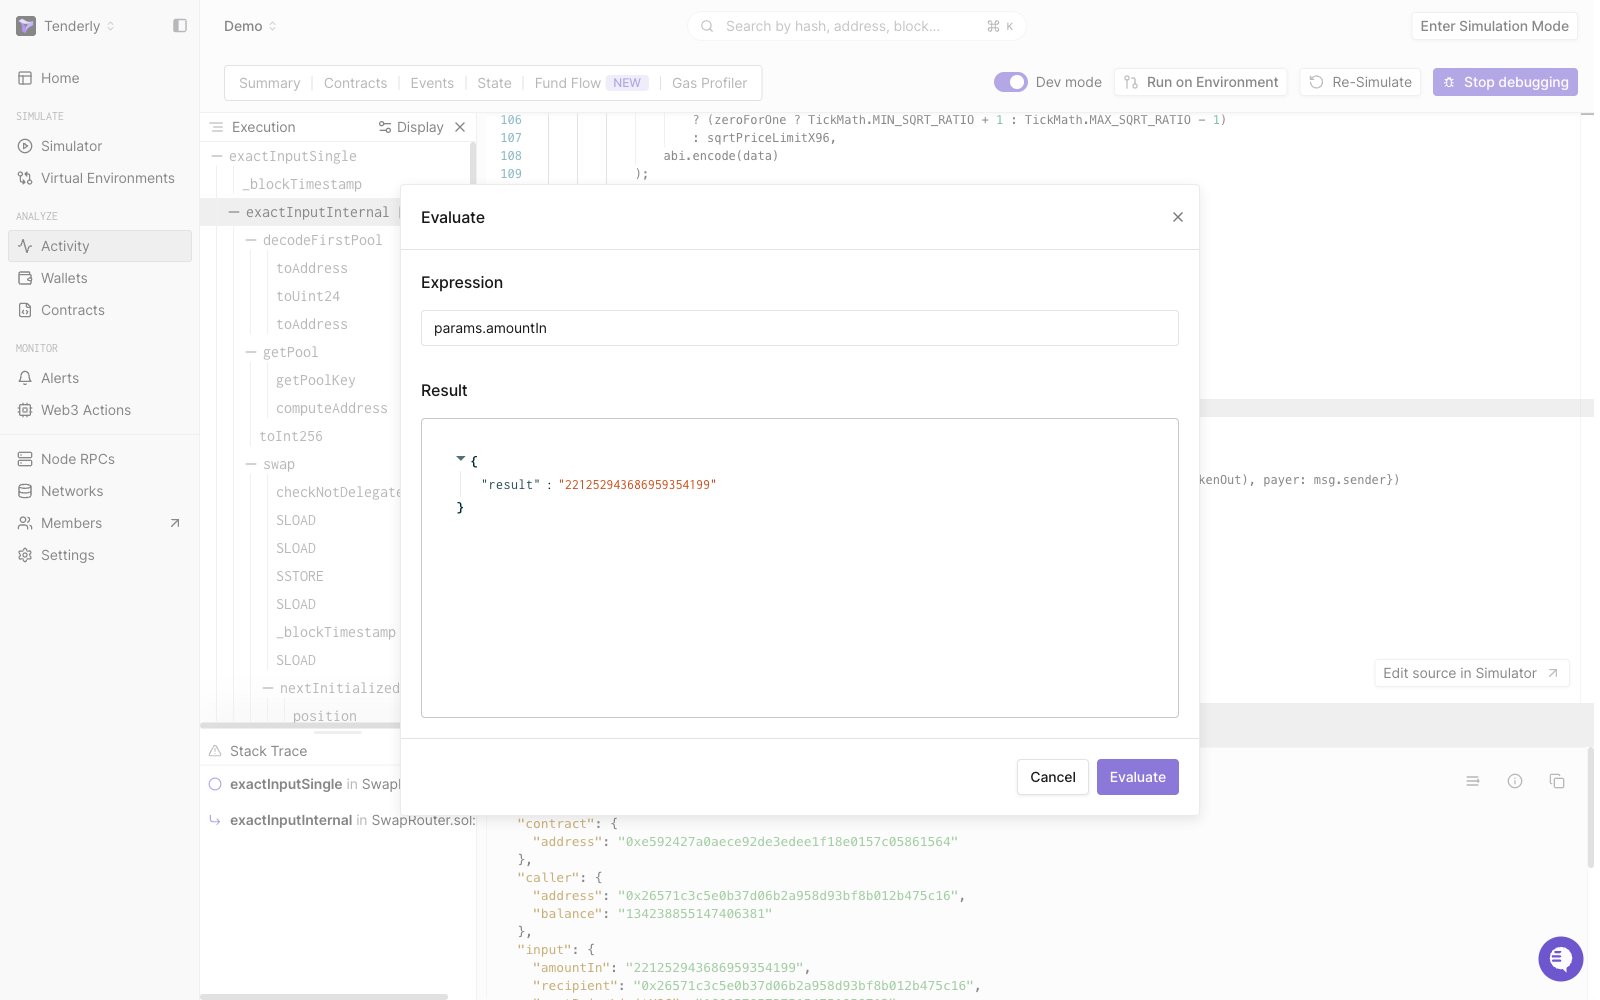
Evaluating expressions
The Evaluate feature allows you to test out expressions directly within the Debugger. This is perfect for checking global variables, contract variables, function arguments, and local variables.