.webp?fit=max&auto=format&n=XsEZlaGXYskrtN68&q=85&s=556893b48138dd1e6381df0c638afcbf)
.gif?s=a0d62baa5fb34537882b14b439bfef4d)
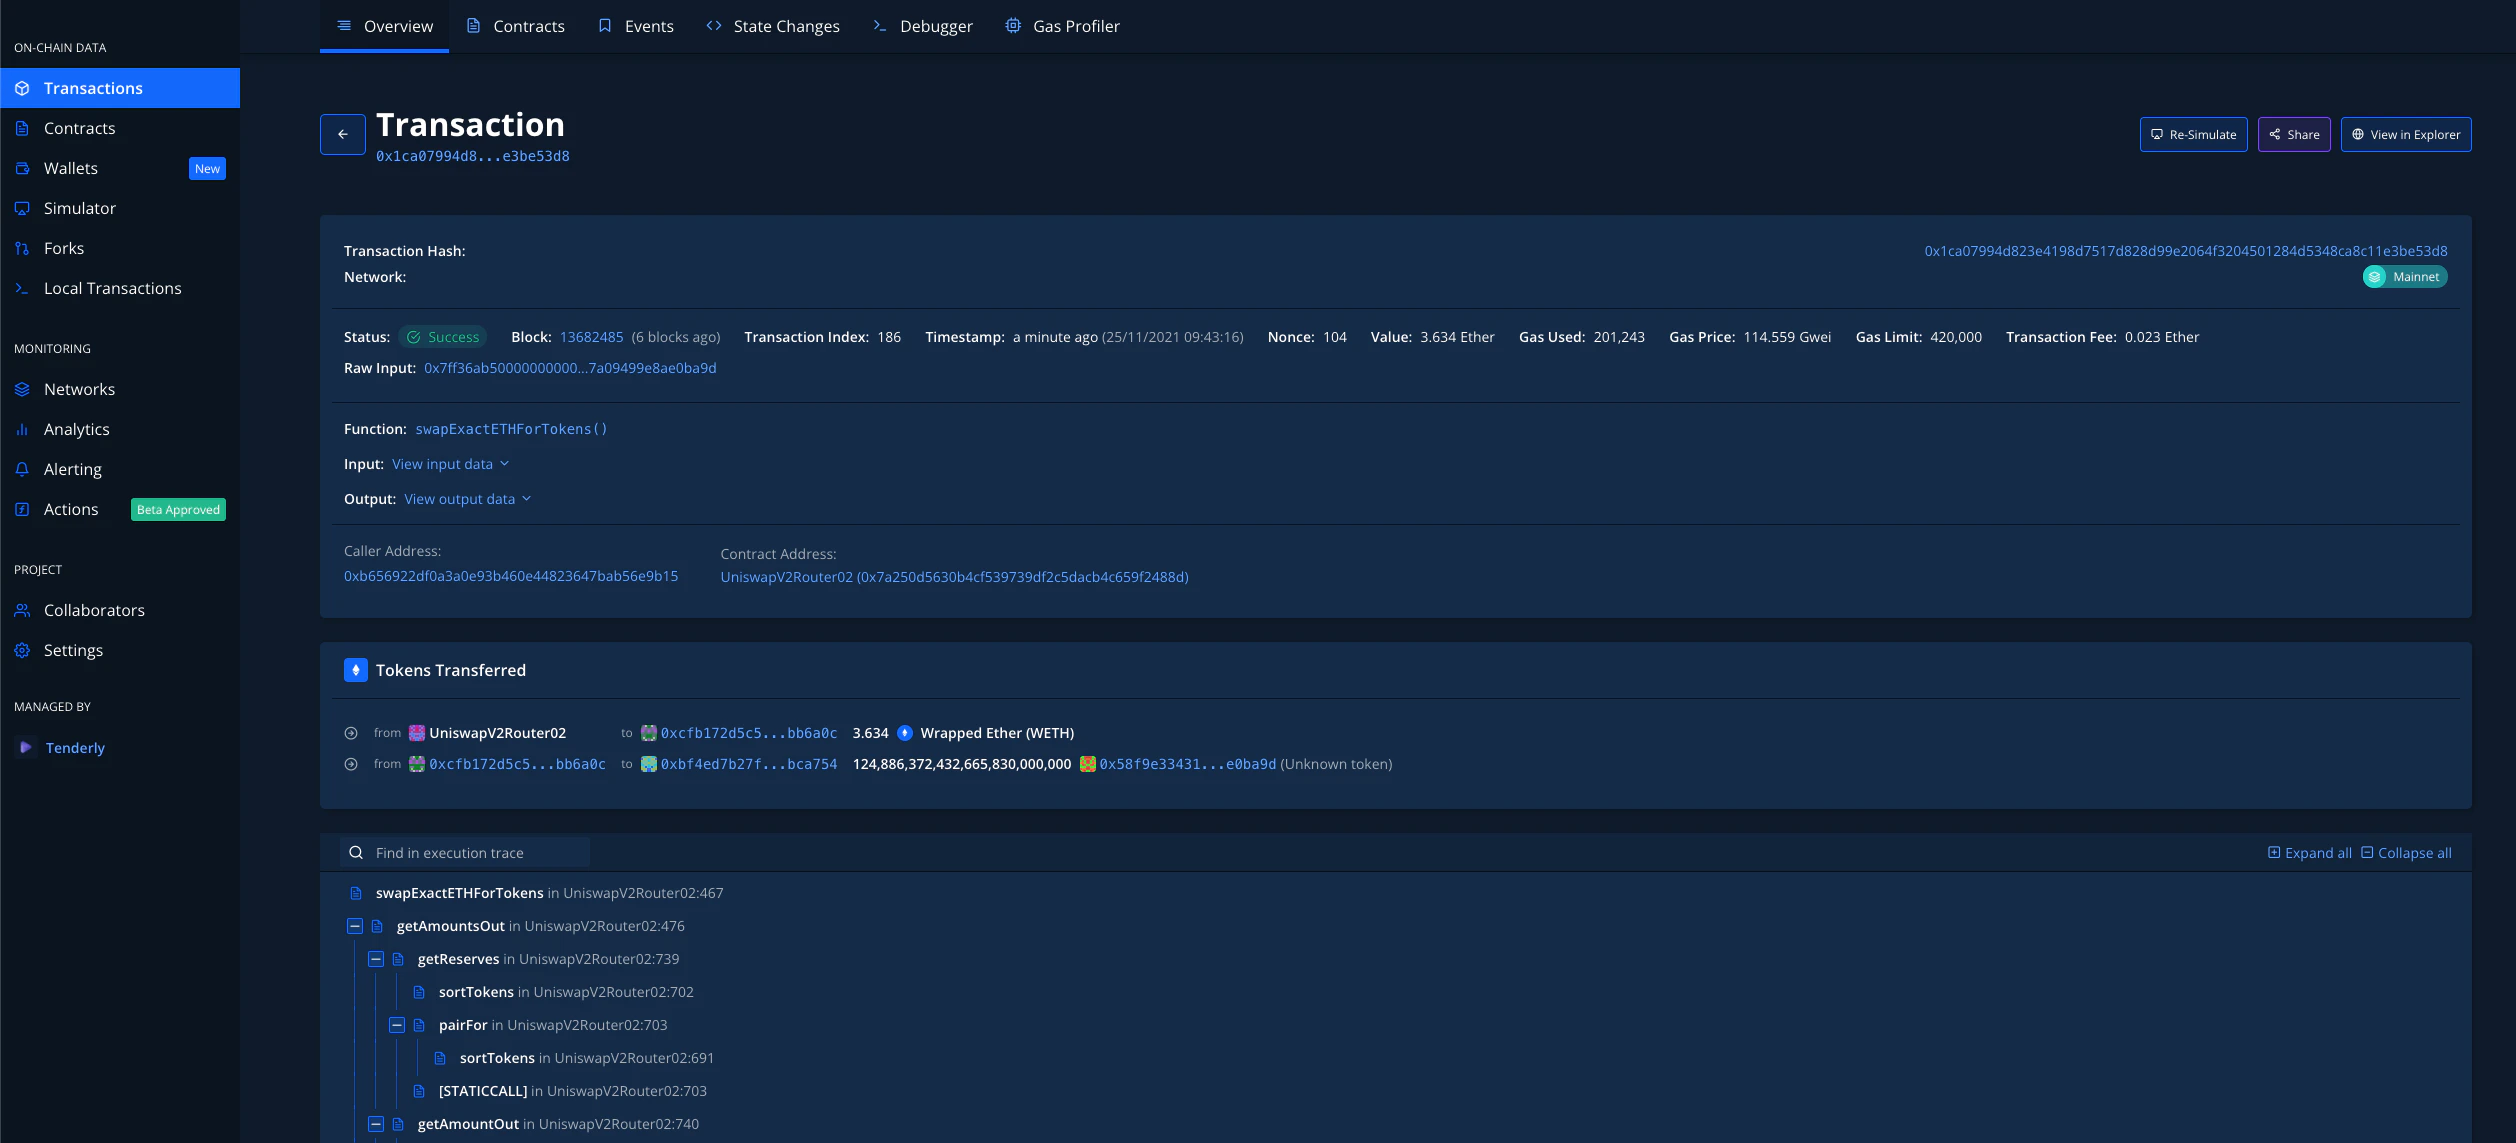
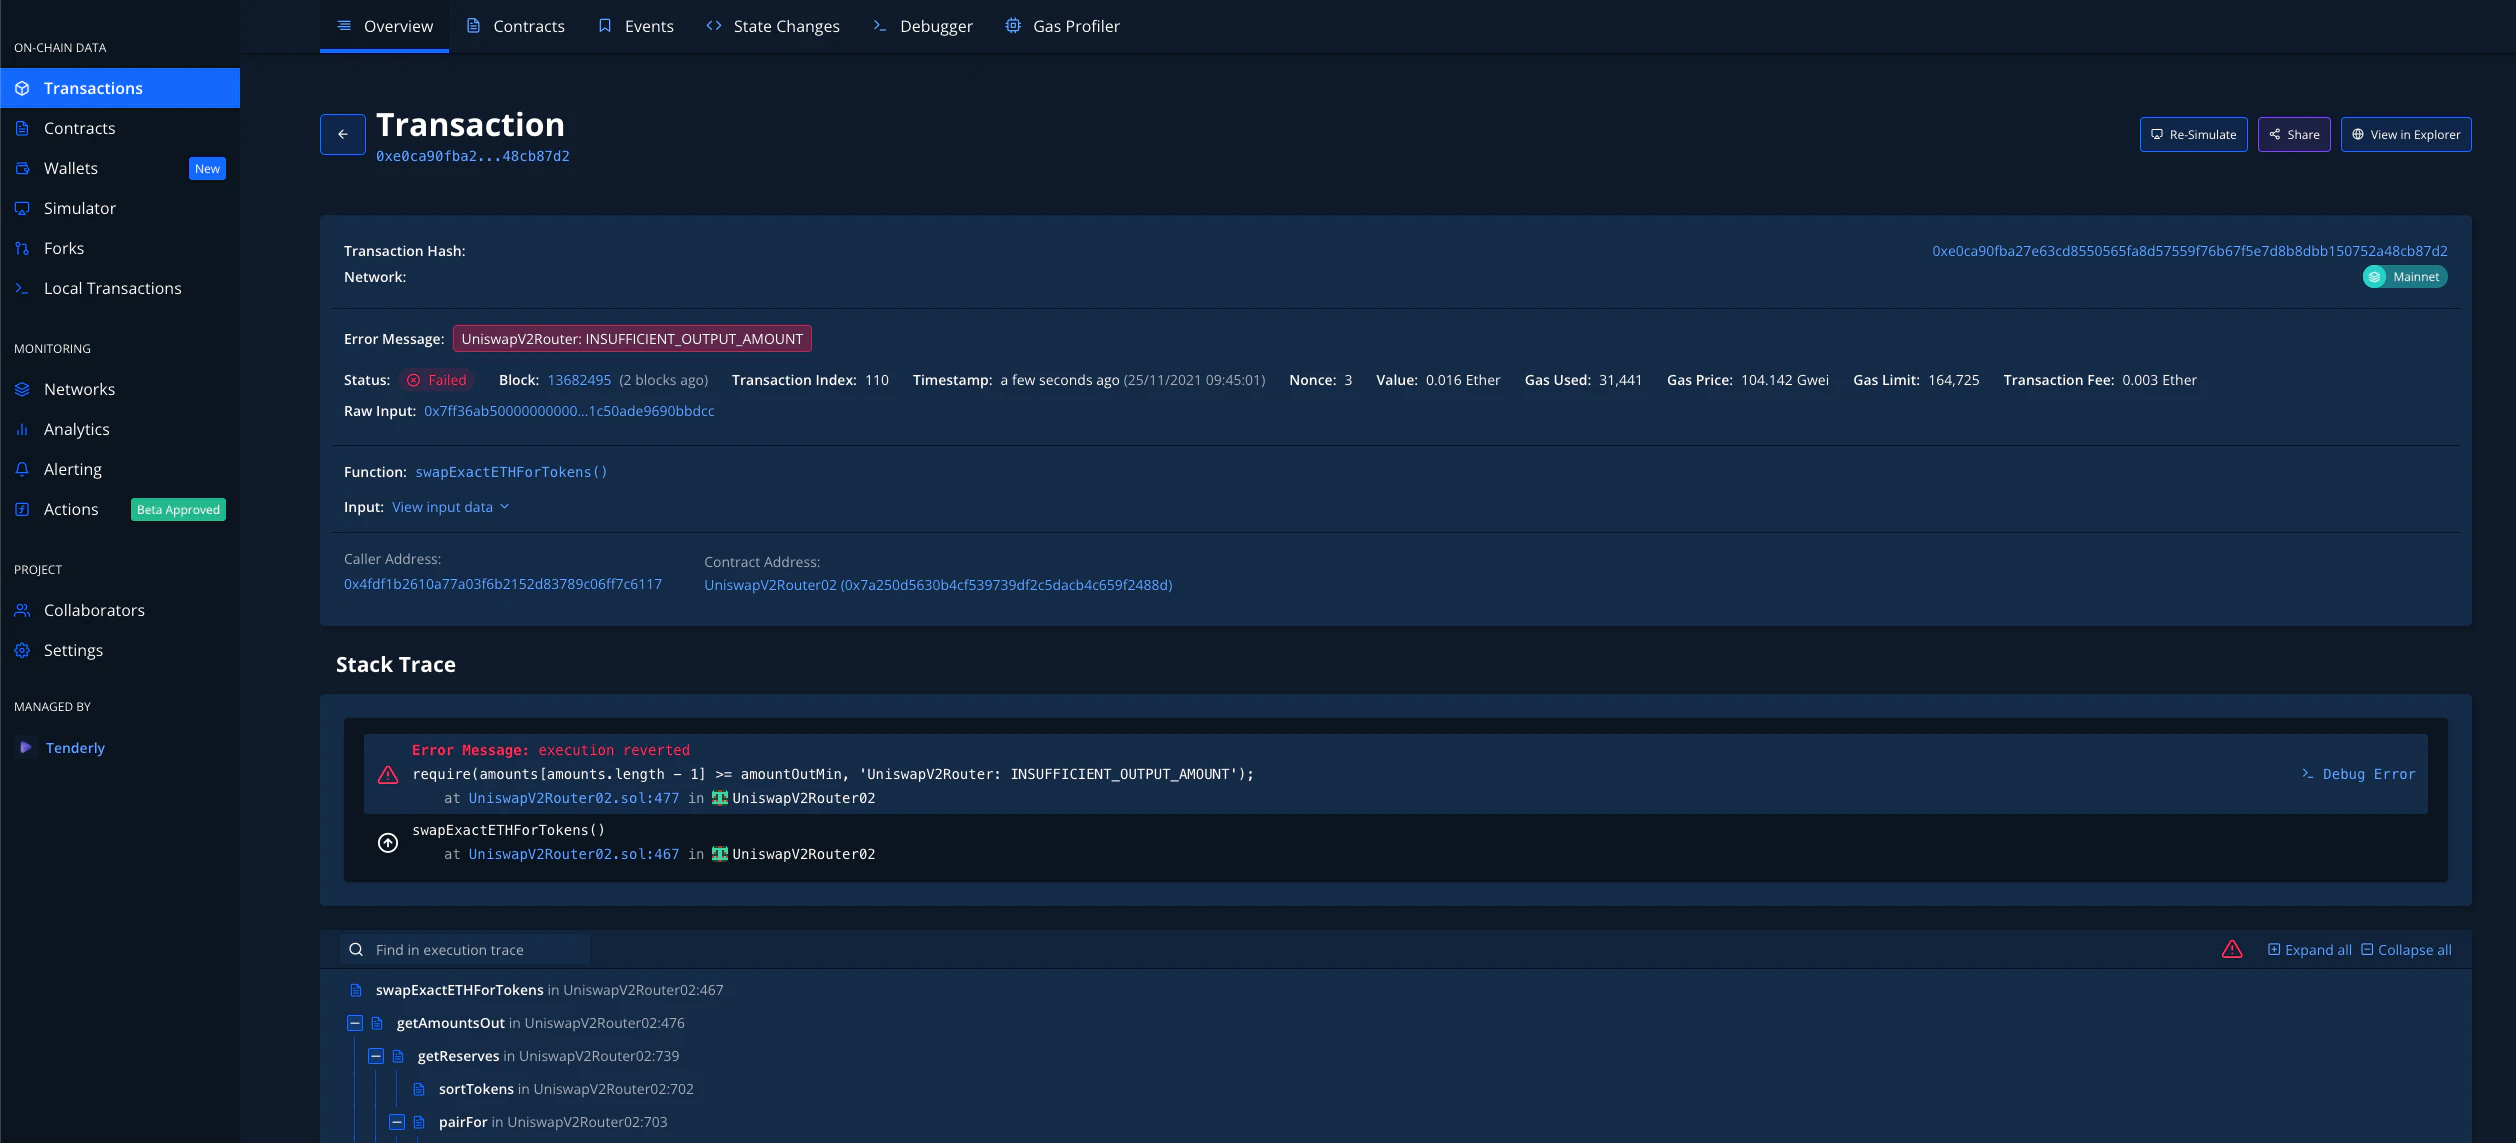
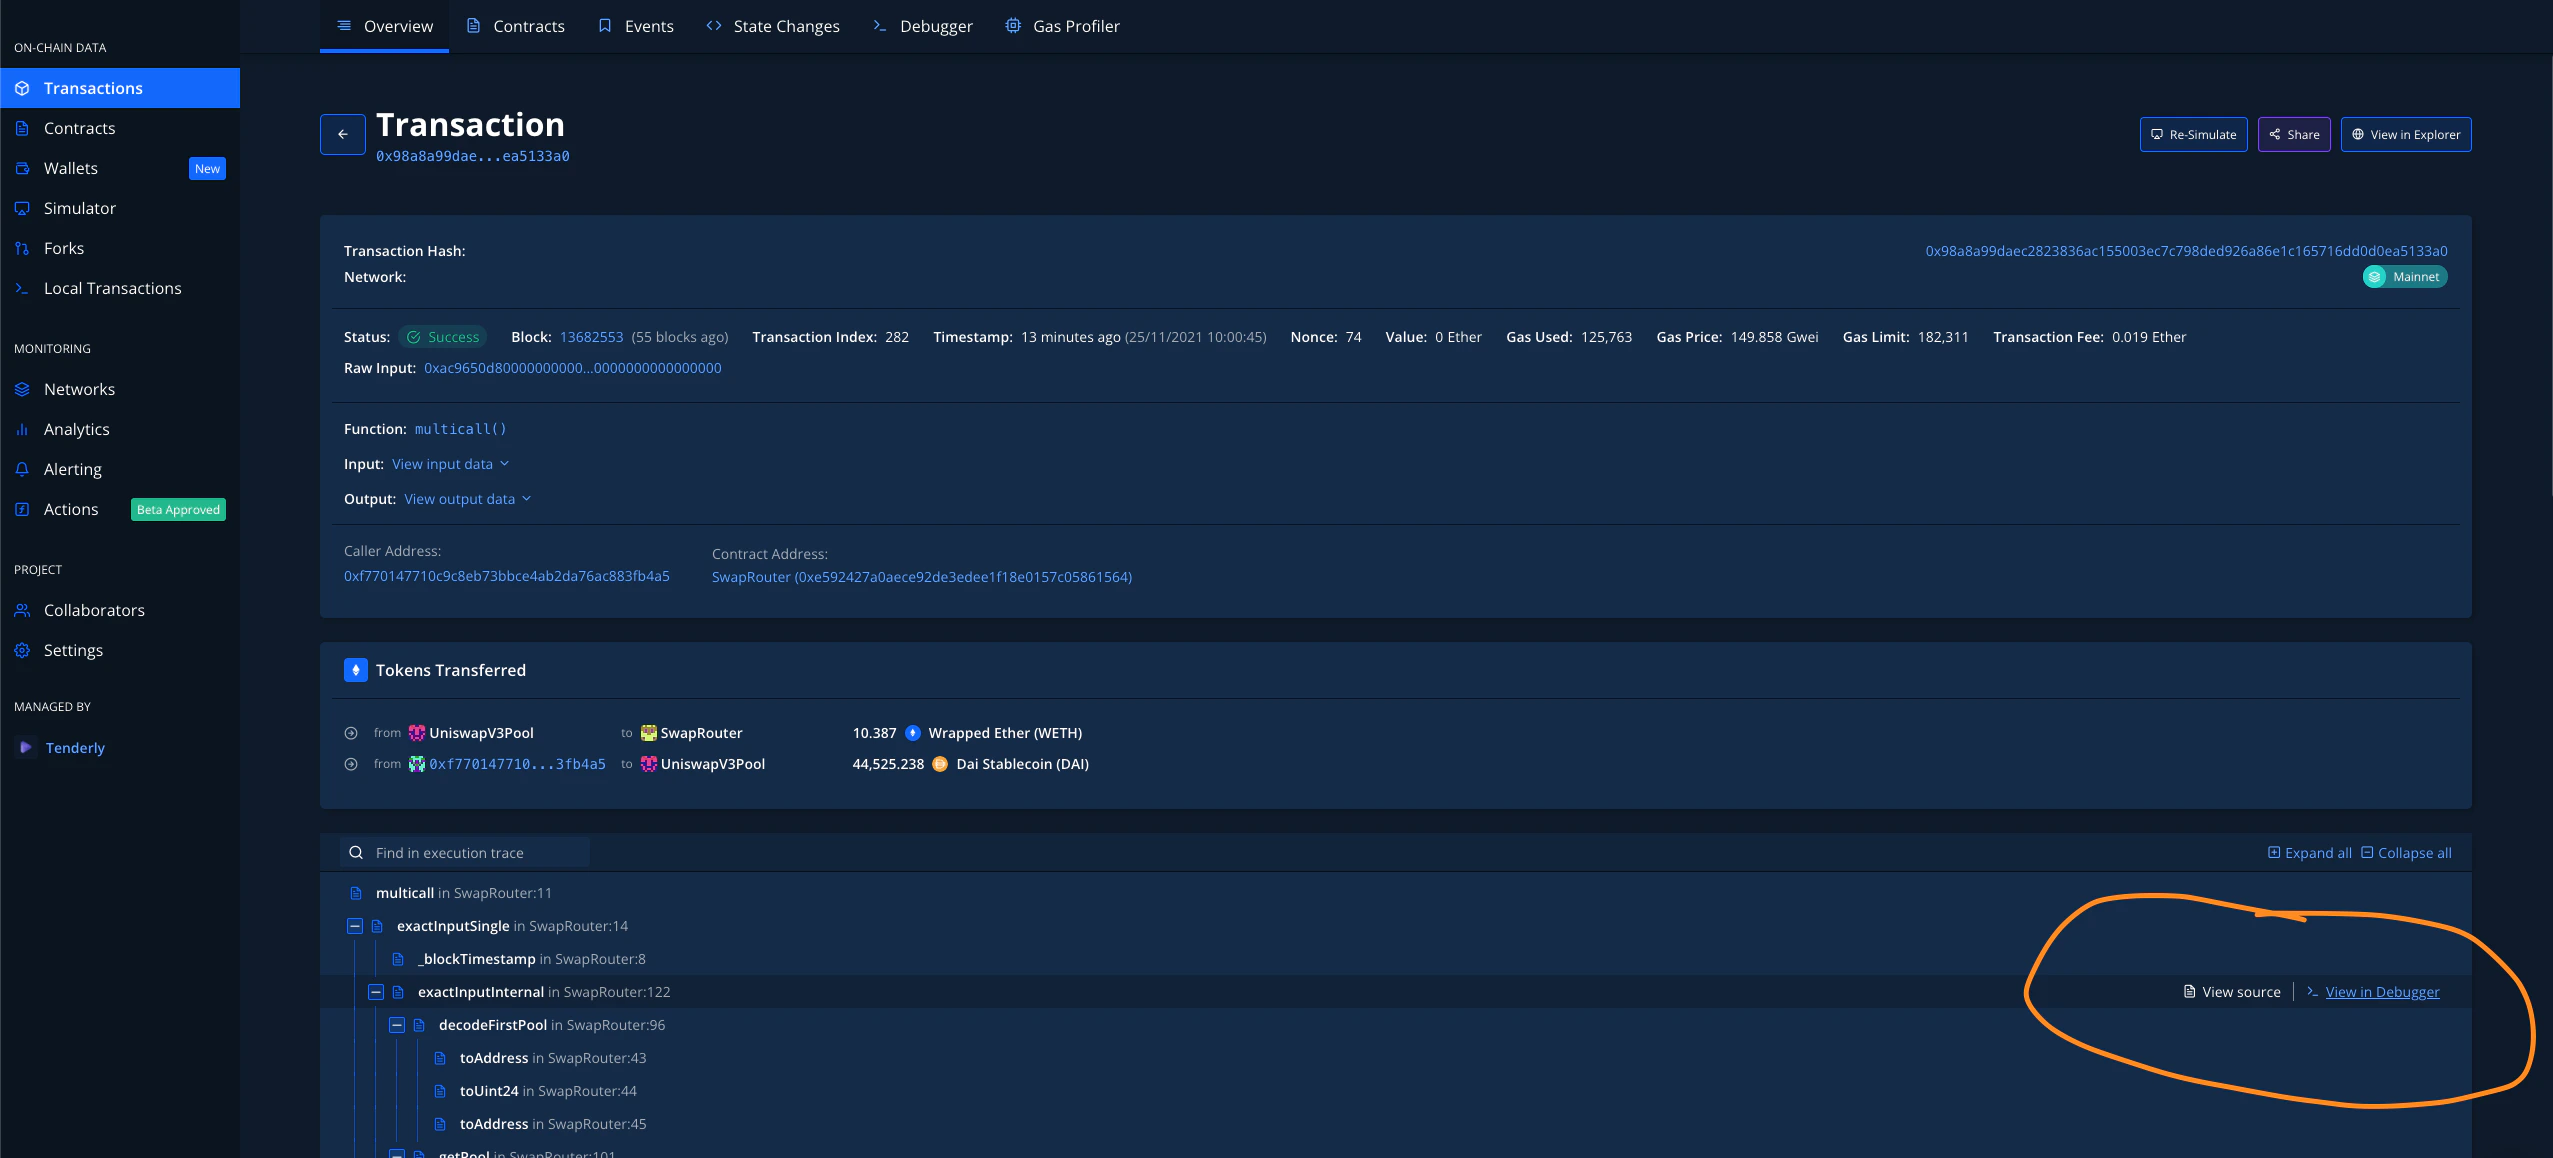
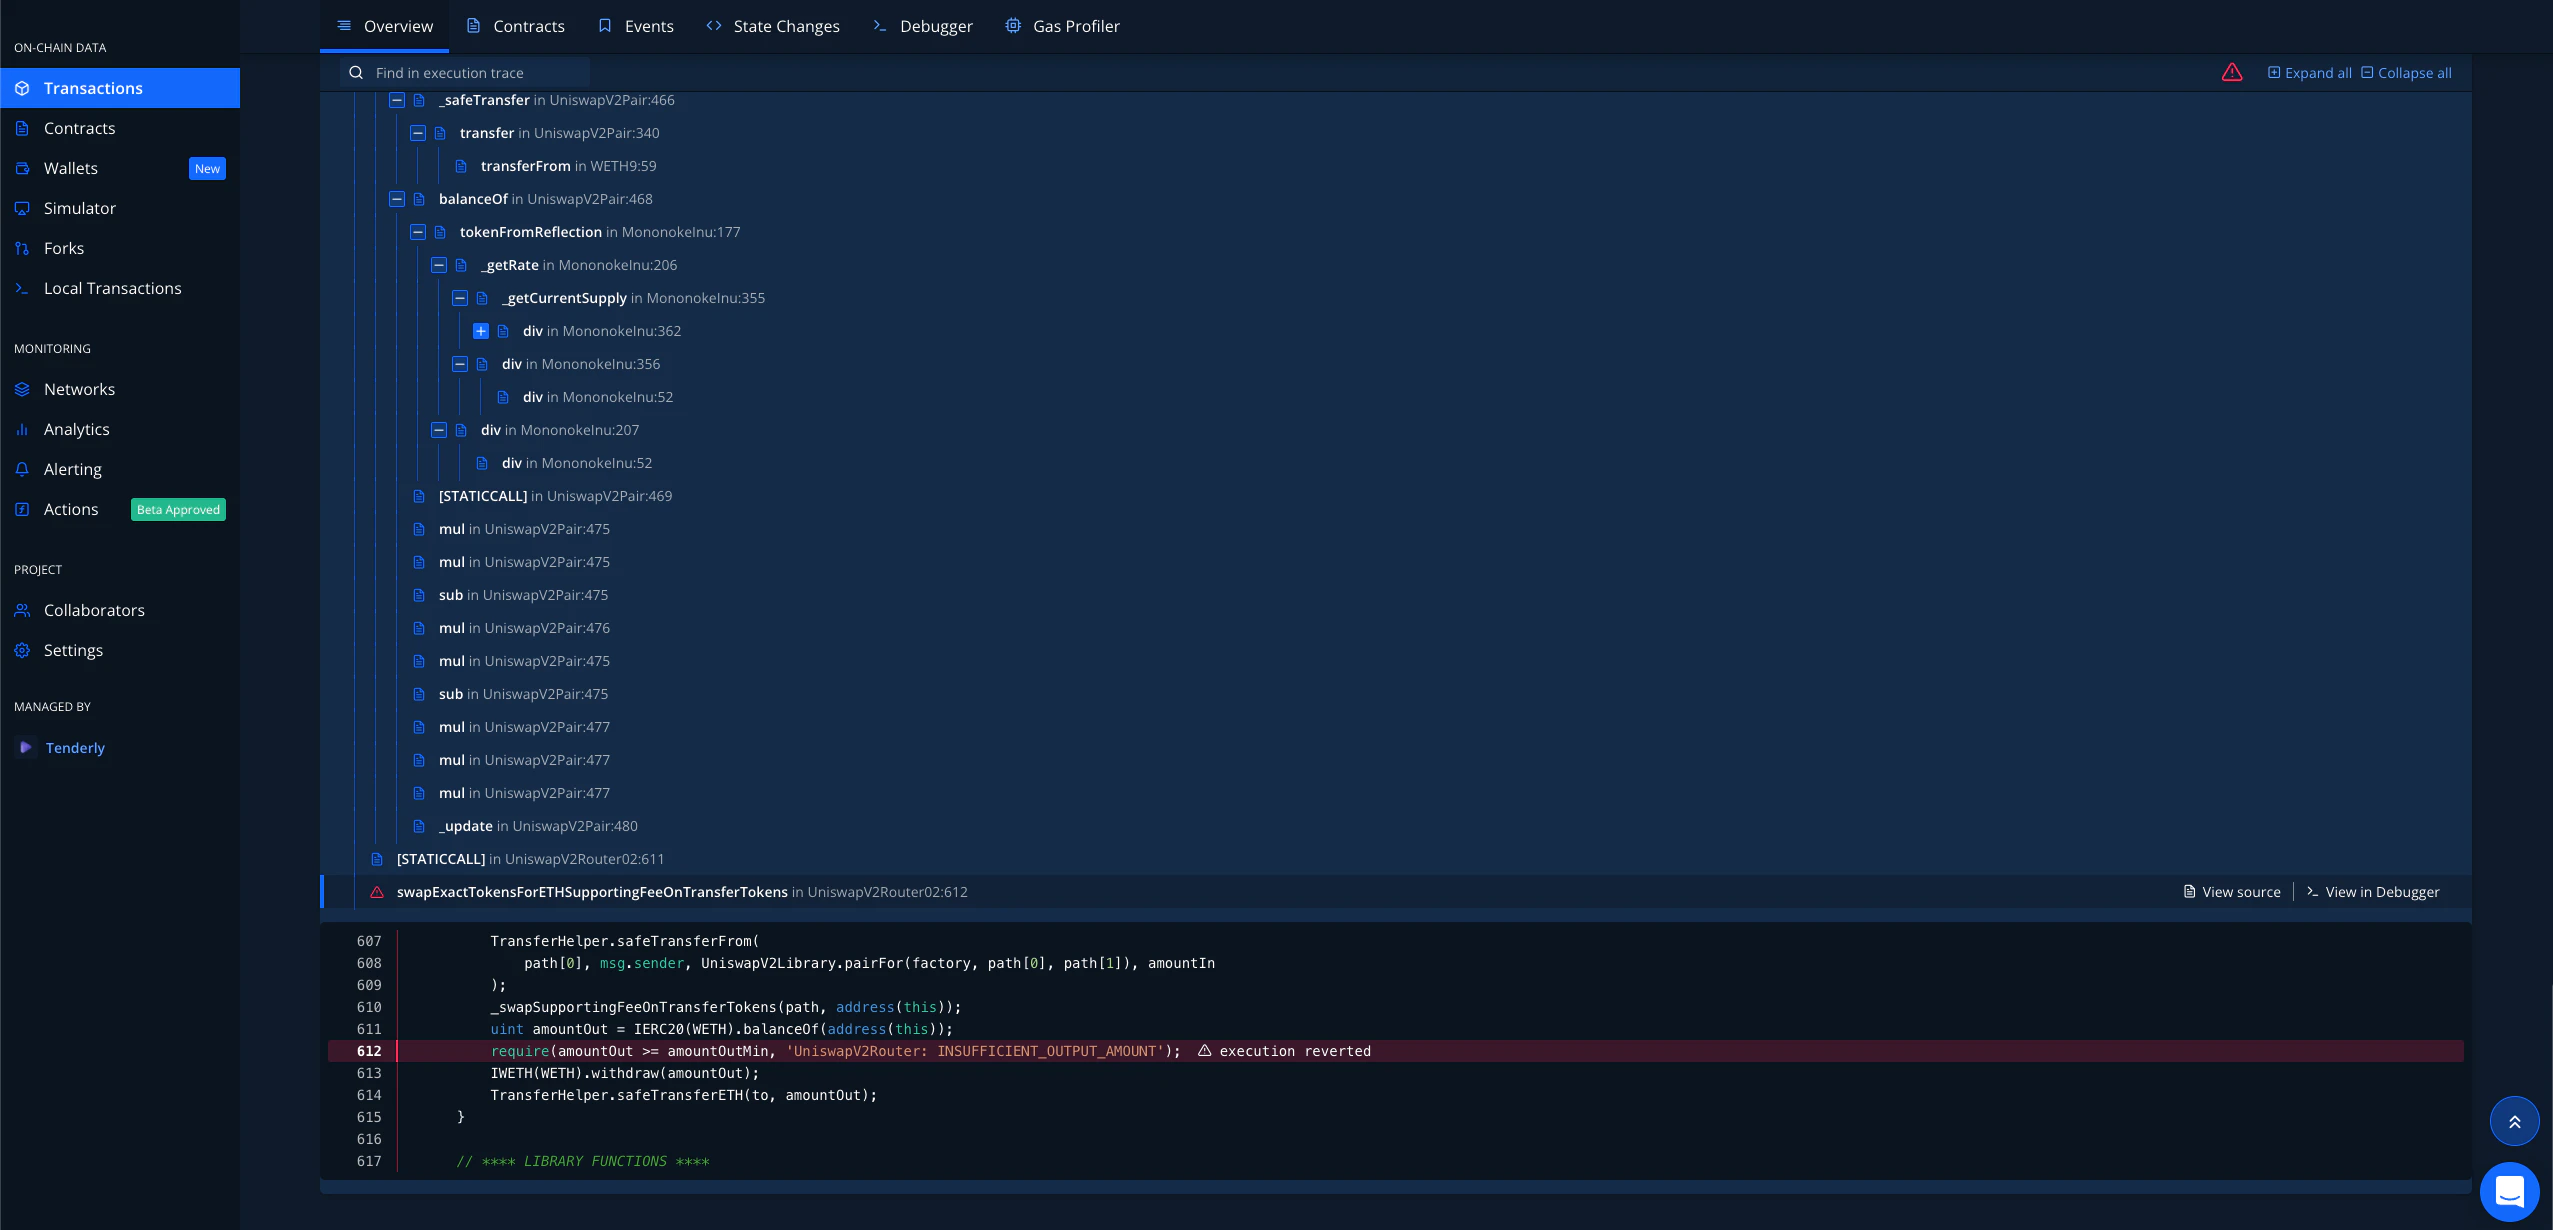
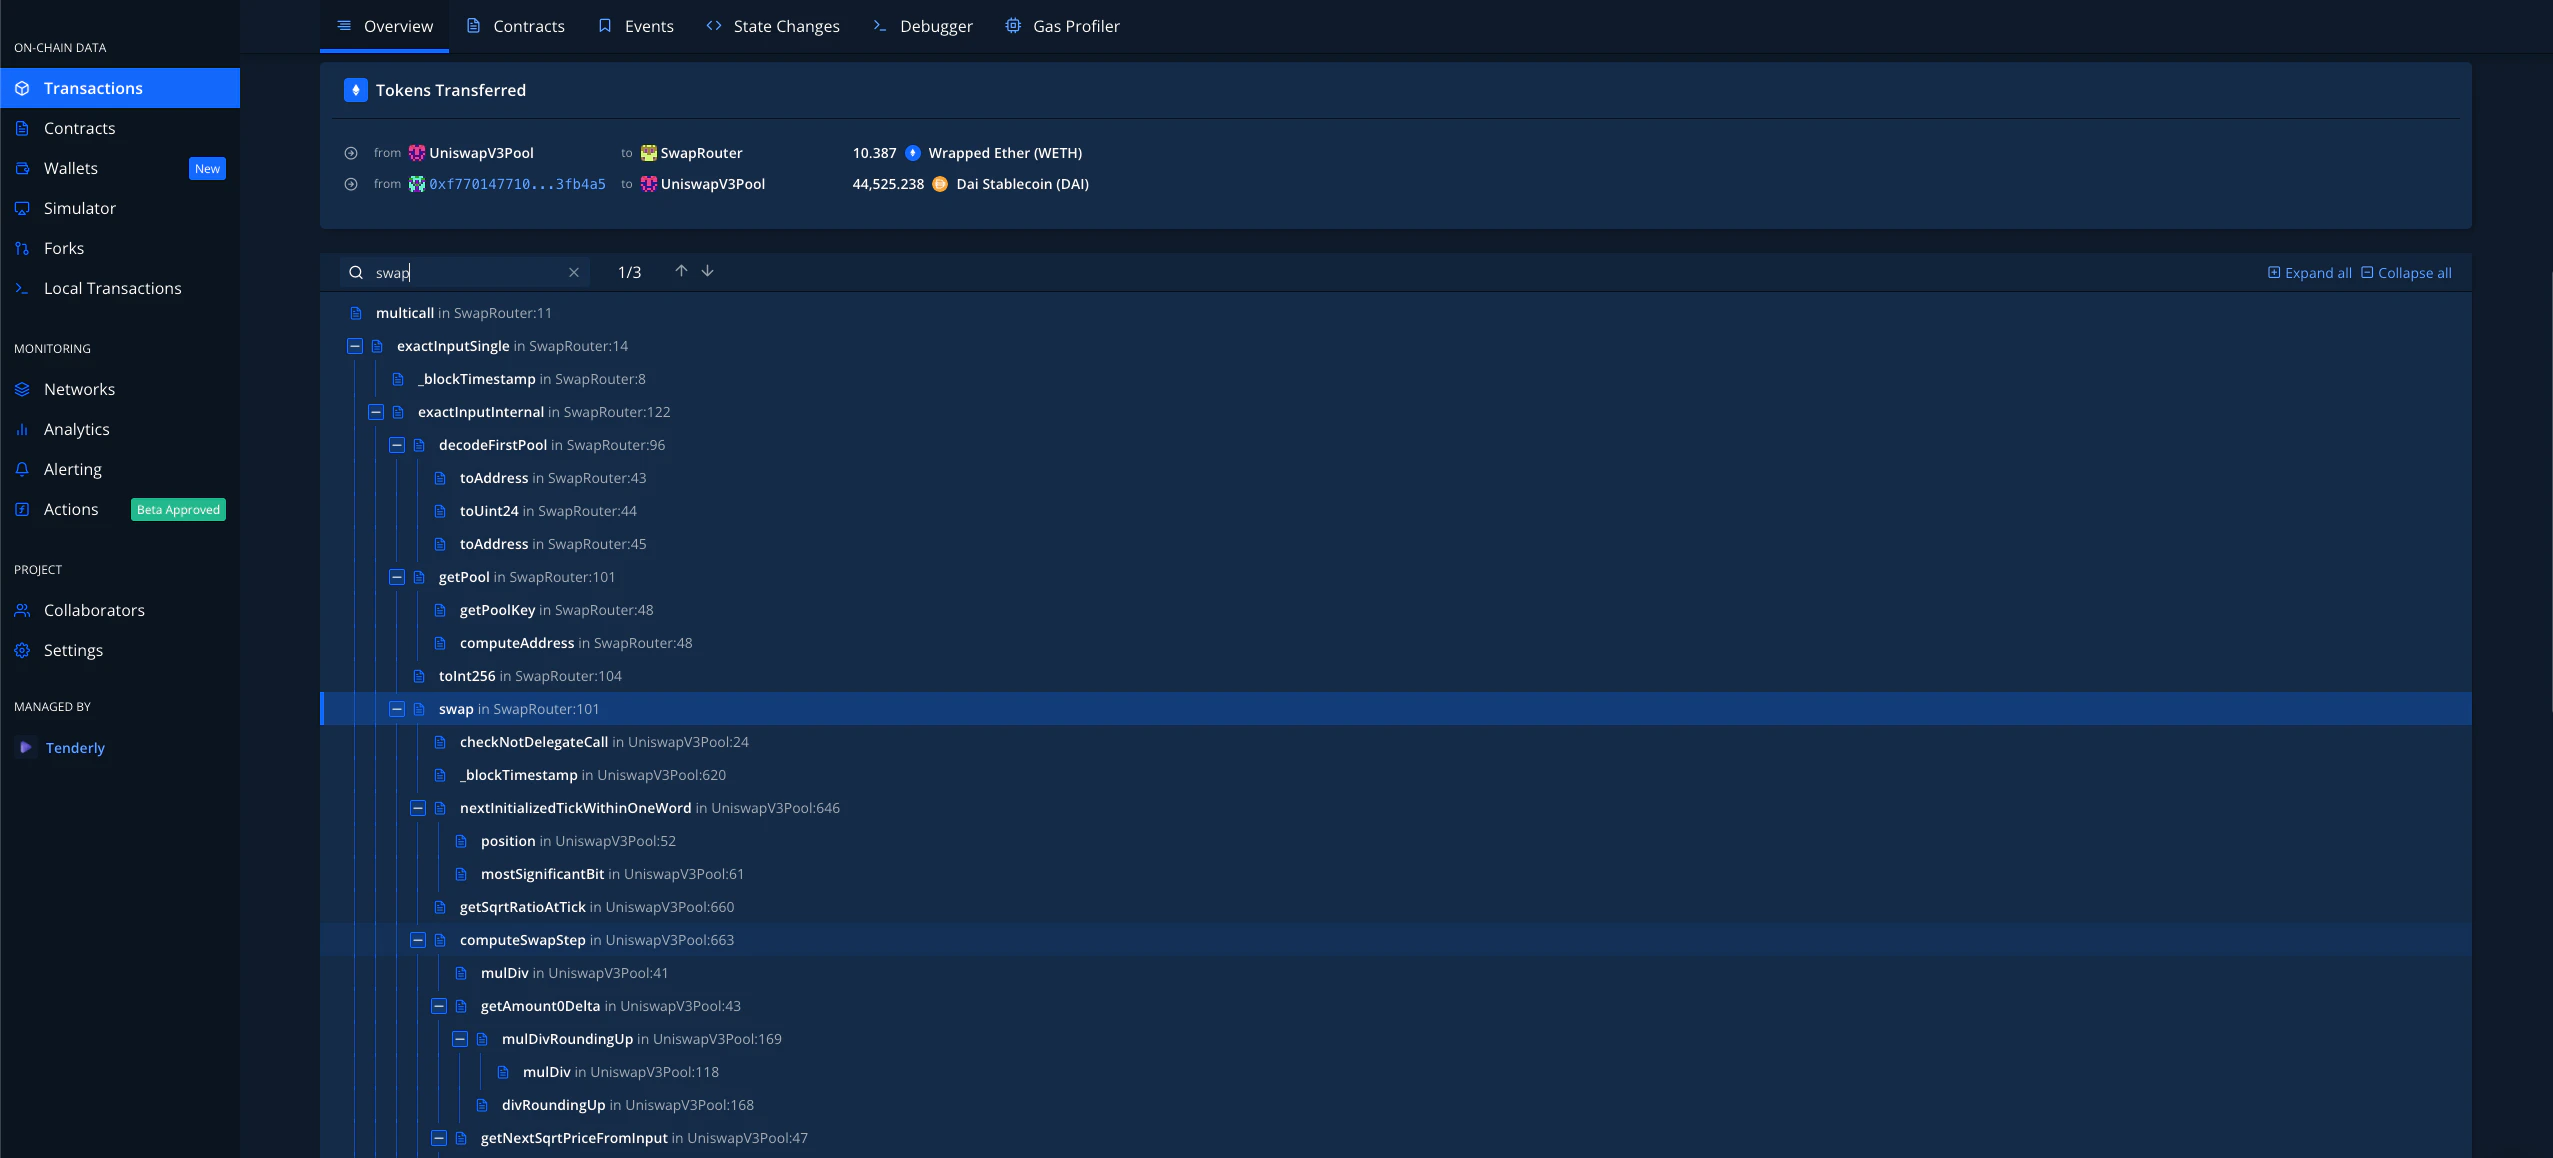
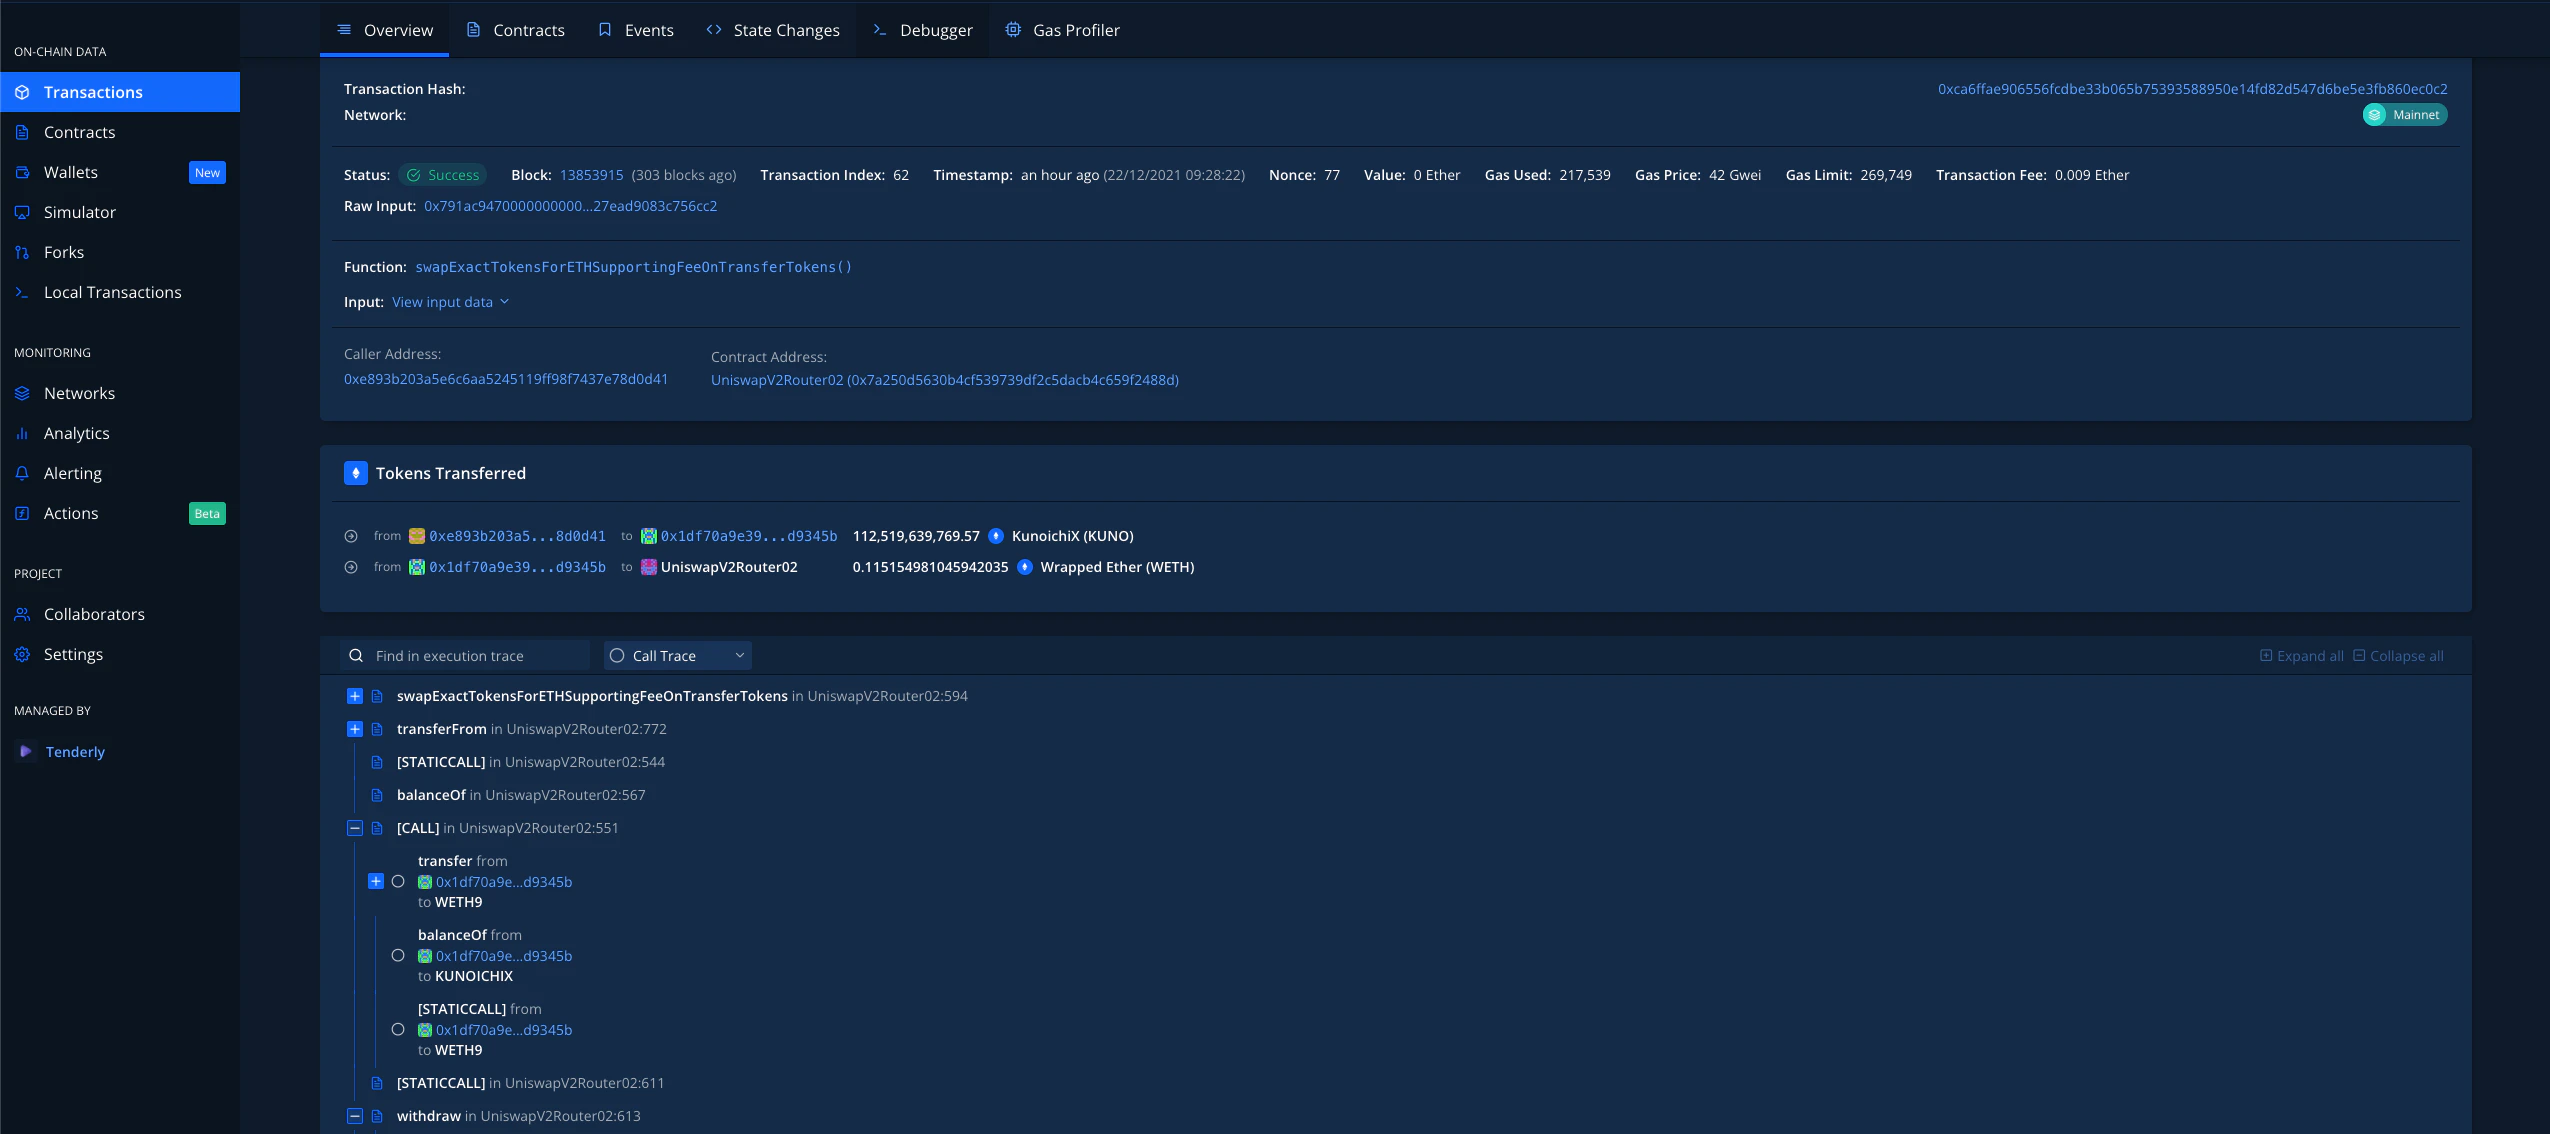
Call and Function Trace
In the Execution Trace section, you’ll find a dropdown menu right next to the search field. By default, it’s set to Function Trace, which means it will show all external and internal calls that happened in this transaction.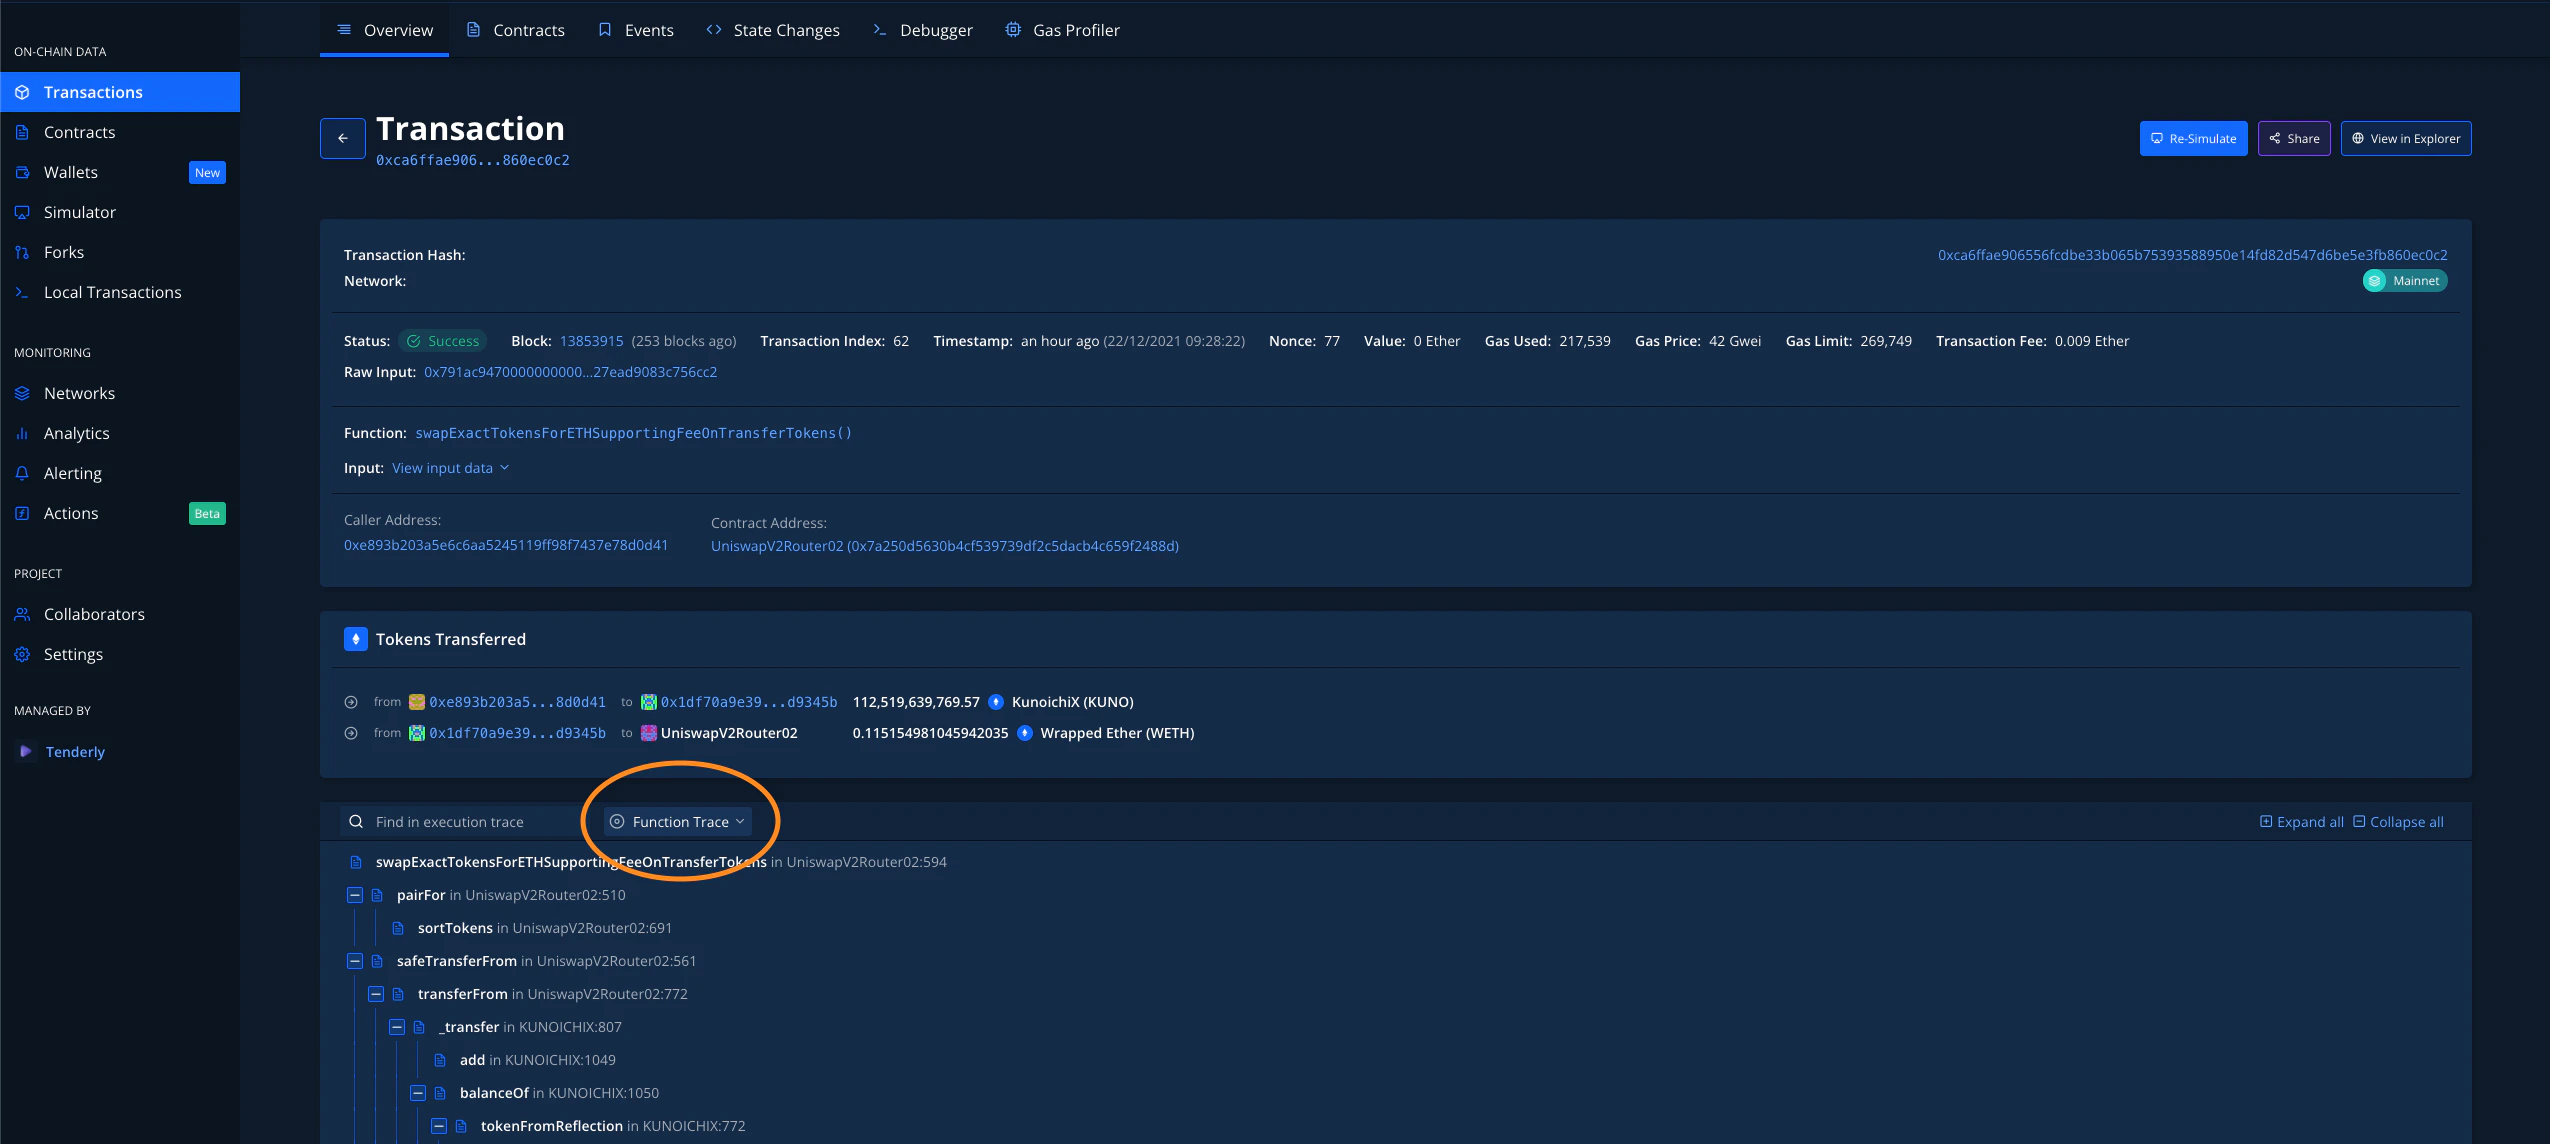
You can comment and prioritize any trace you want, either for yourself or to make
collaboration in the project easier. You can read more about it
here.
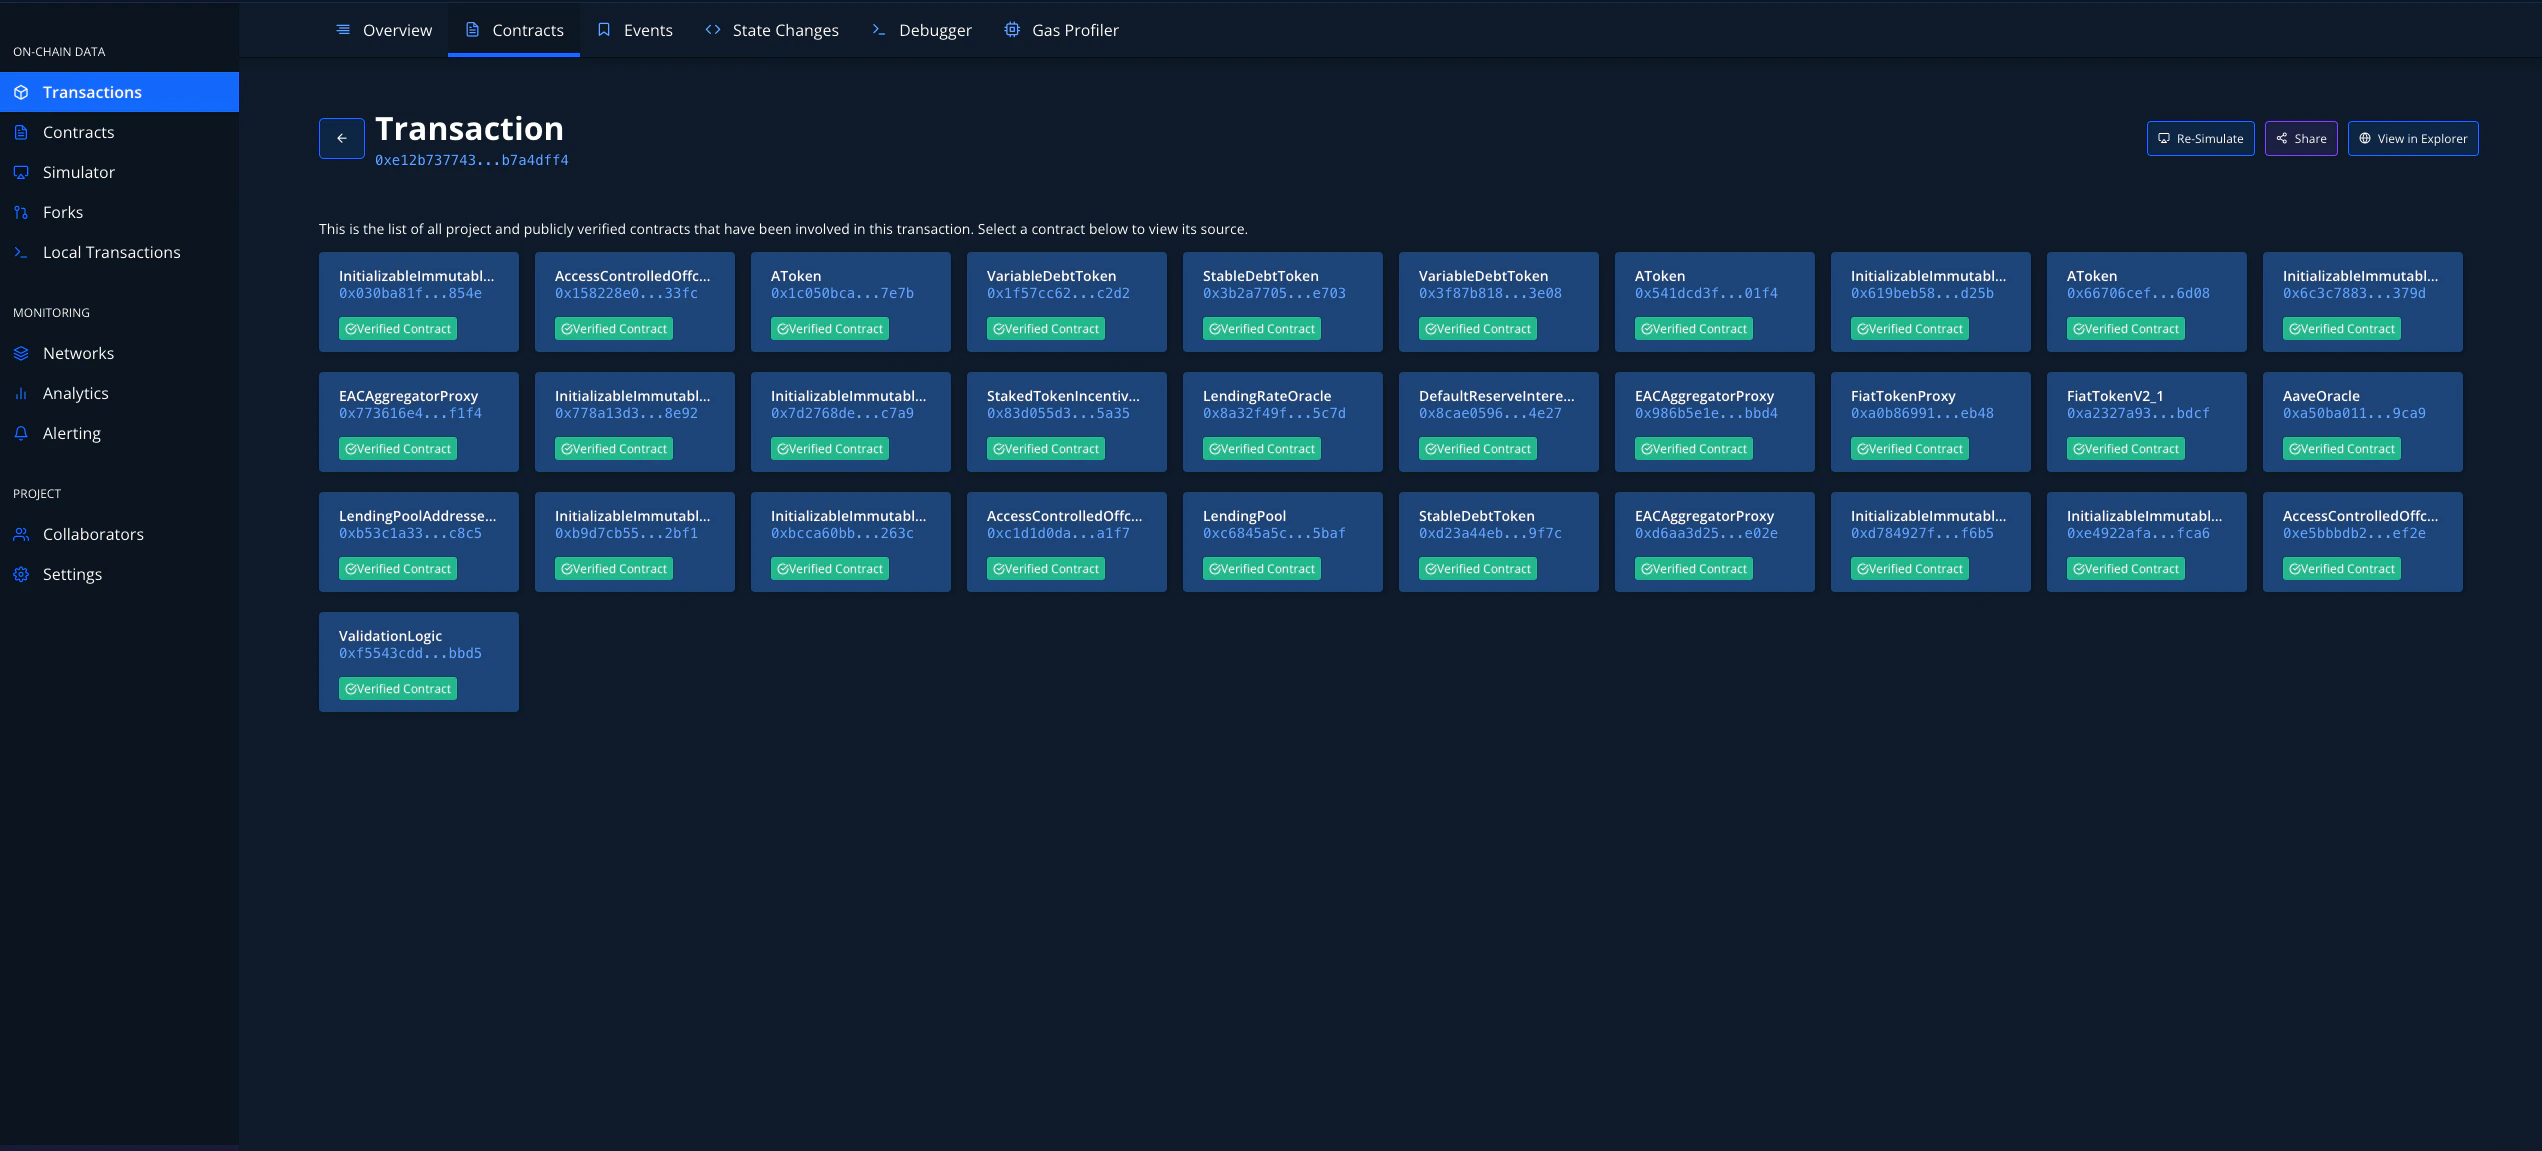
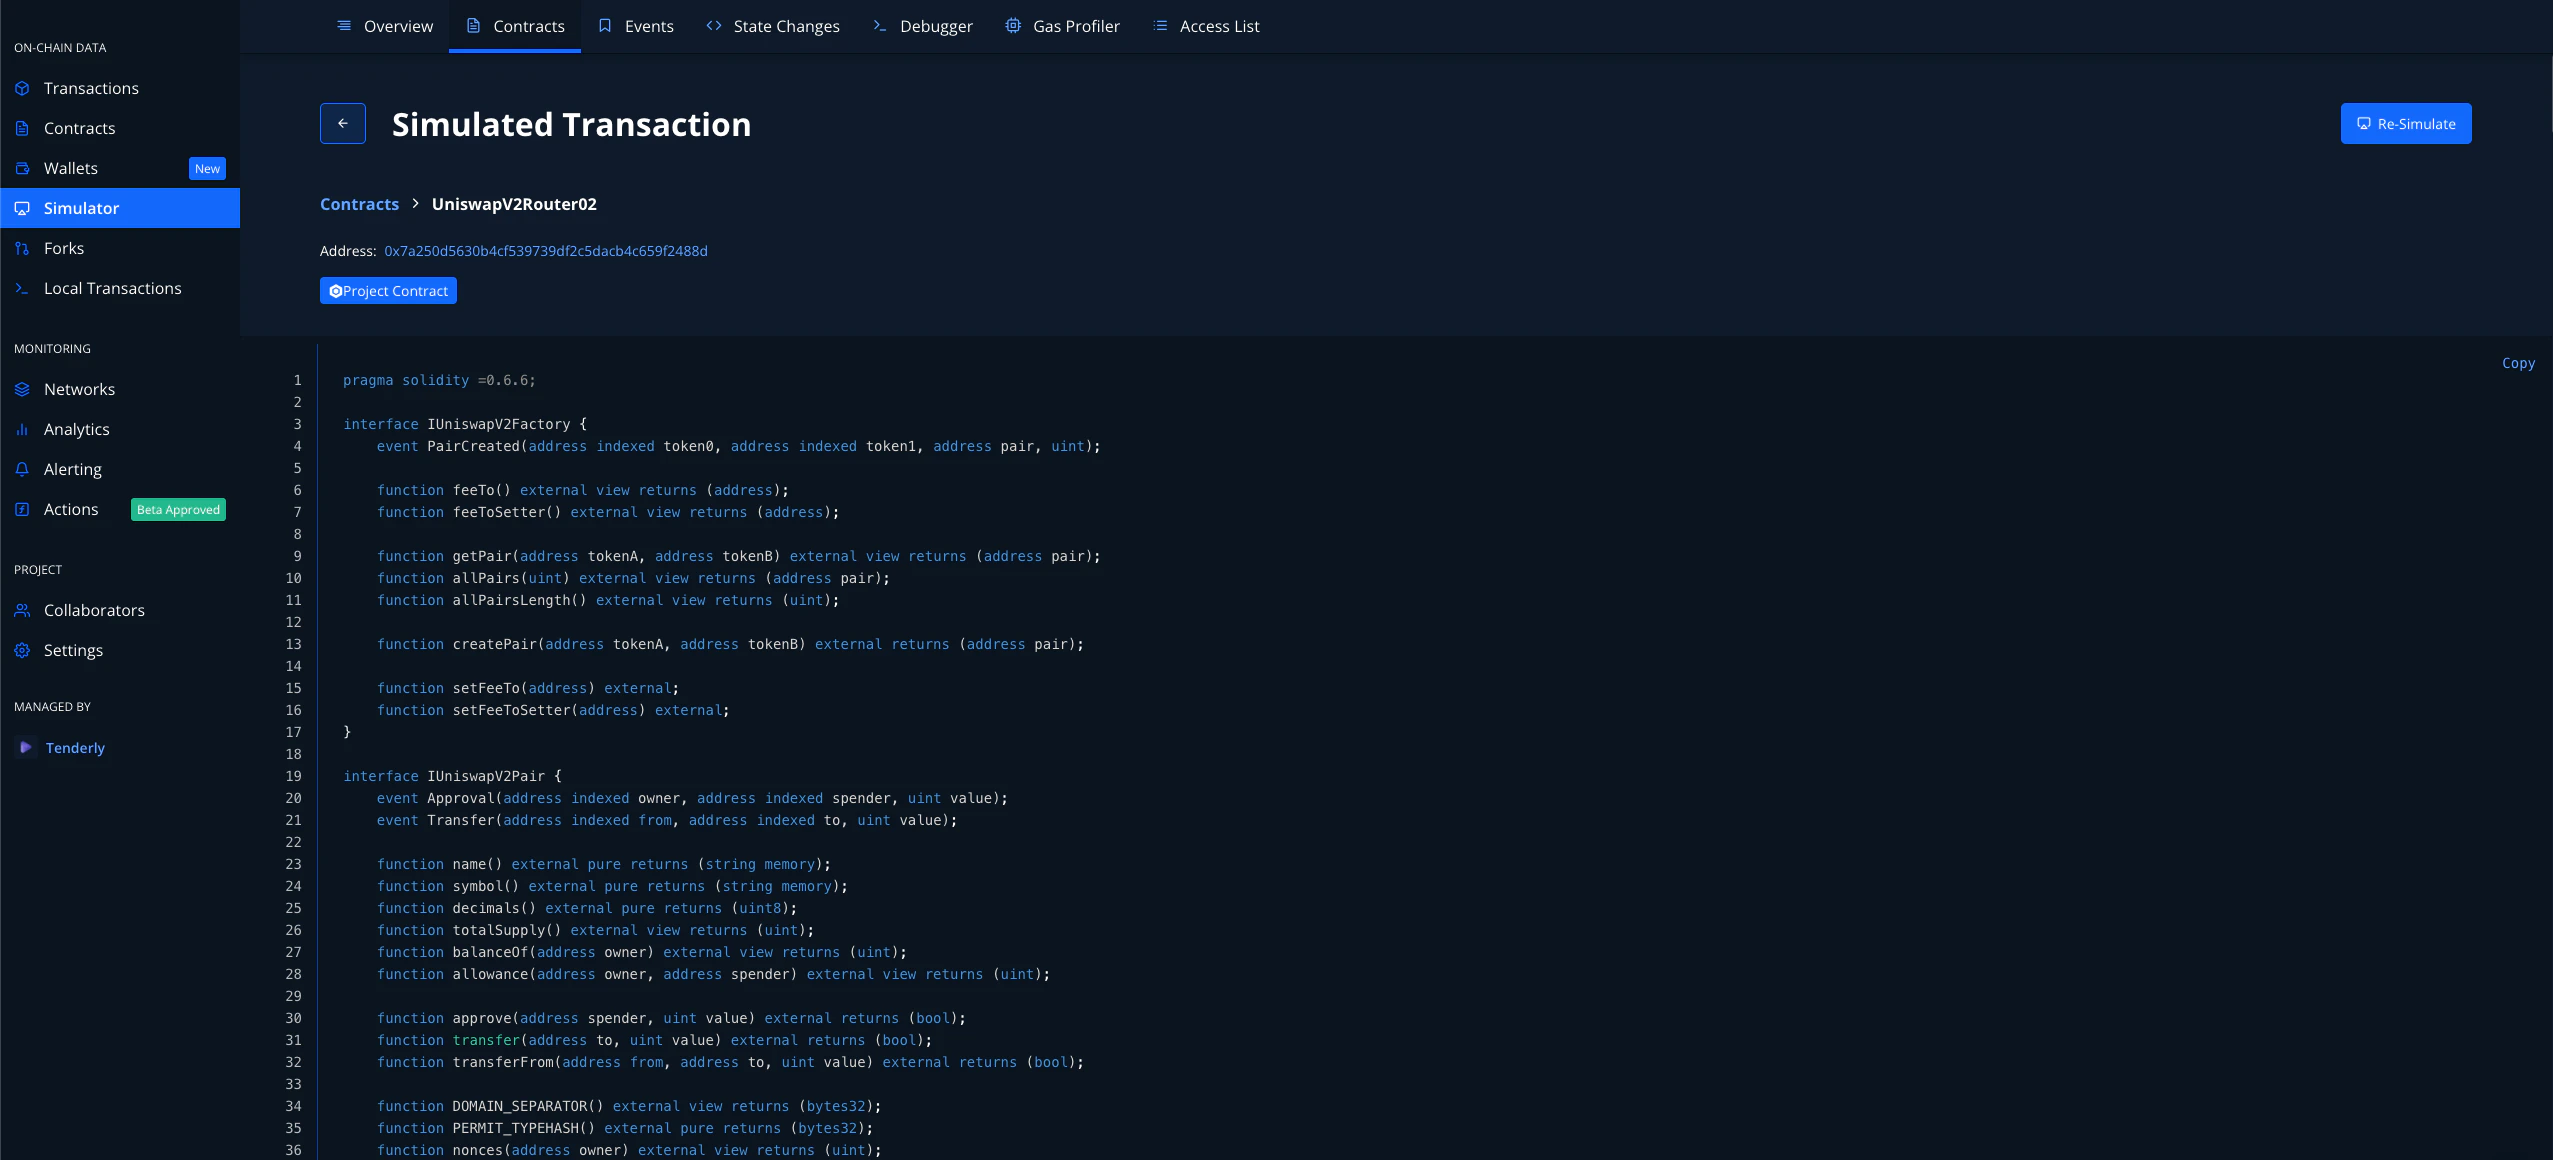
Contracts
When you’re in the Transaction Overview tab, in the upper navigation, you can click Contracts (or Addresses) to see all of the contracts that have been involved in a certain transaction:
Events
Smart Contract Events are the de-facto way of notifying interested parties that some event has occurred. The Logs themselves also contain valuable information in addition to the information that a particular event has occurred.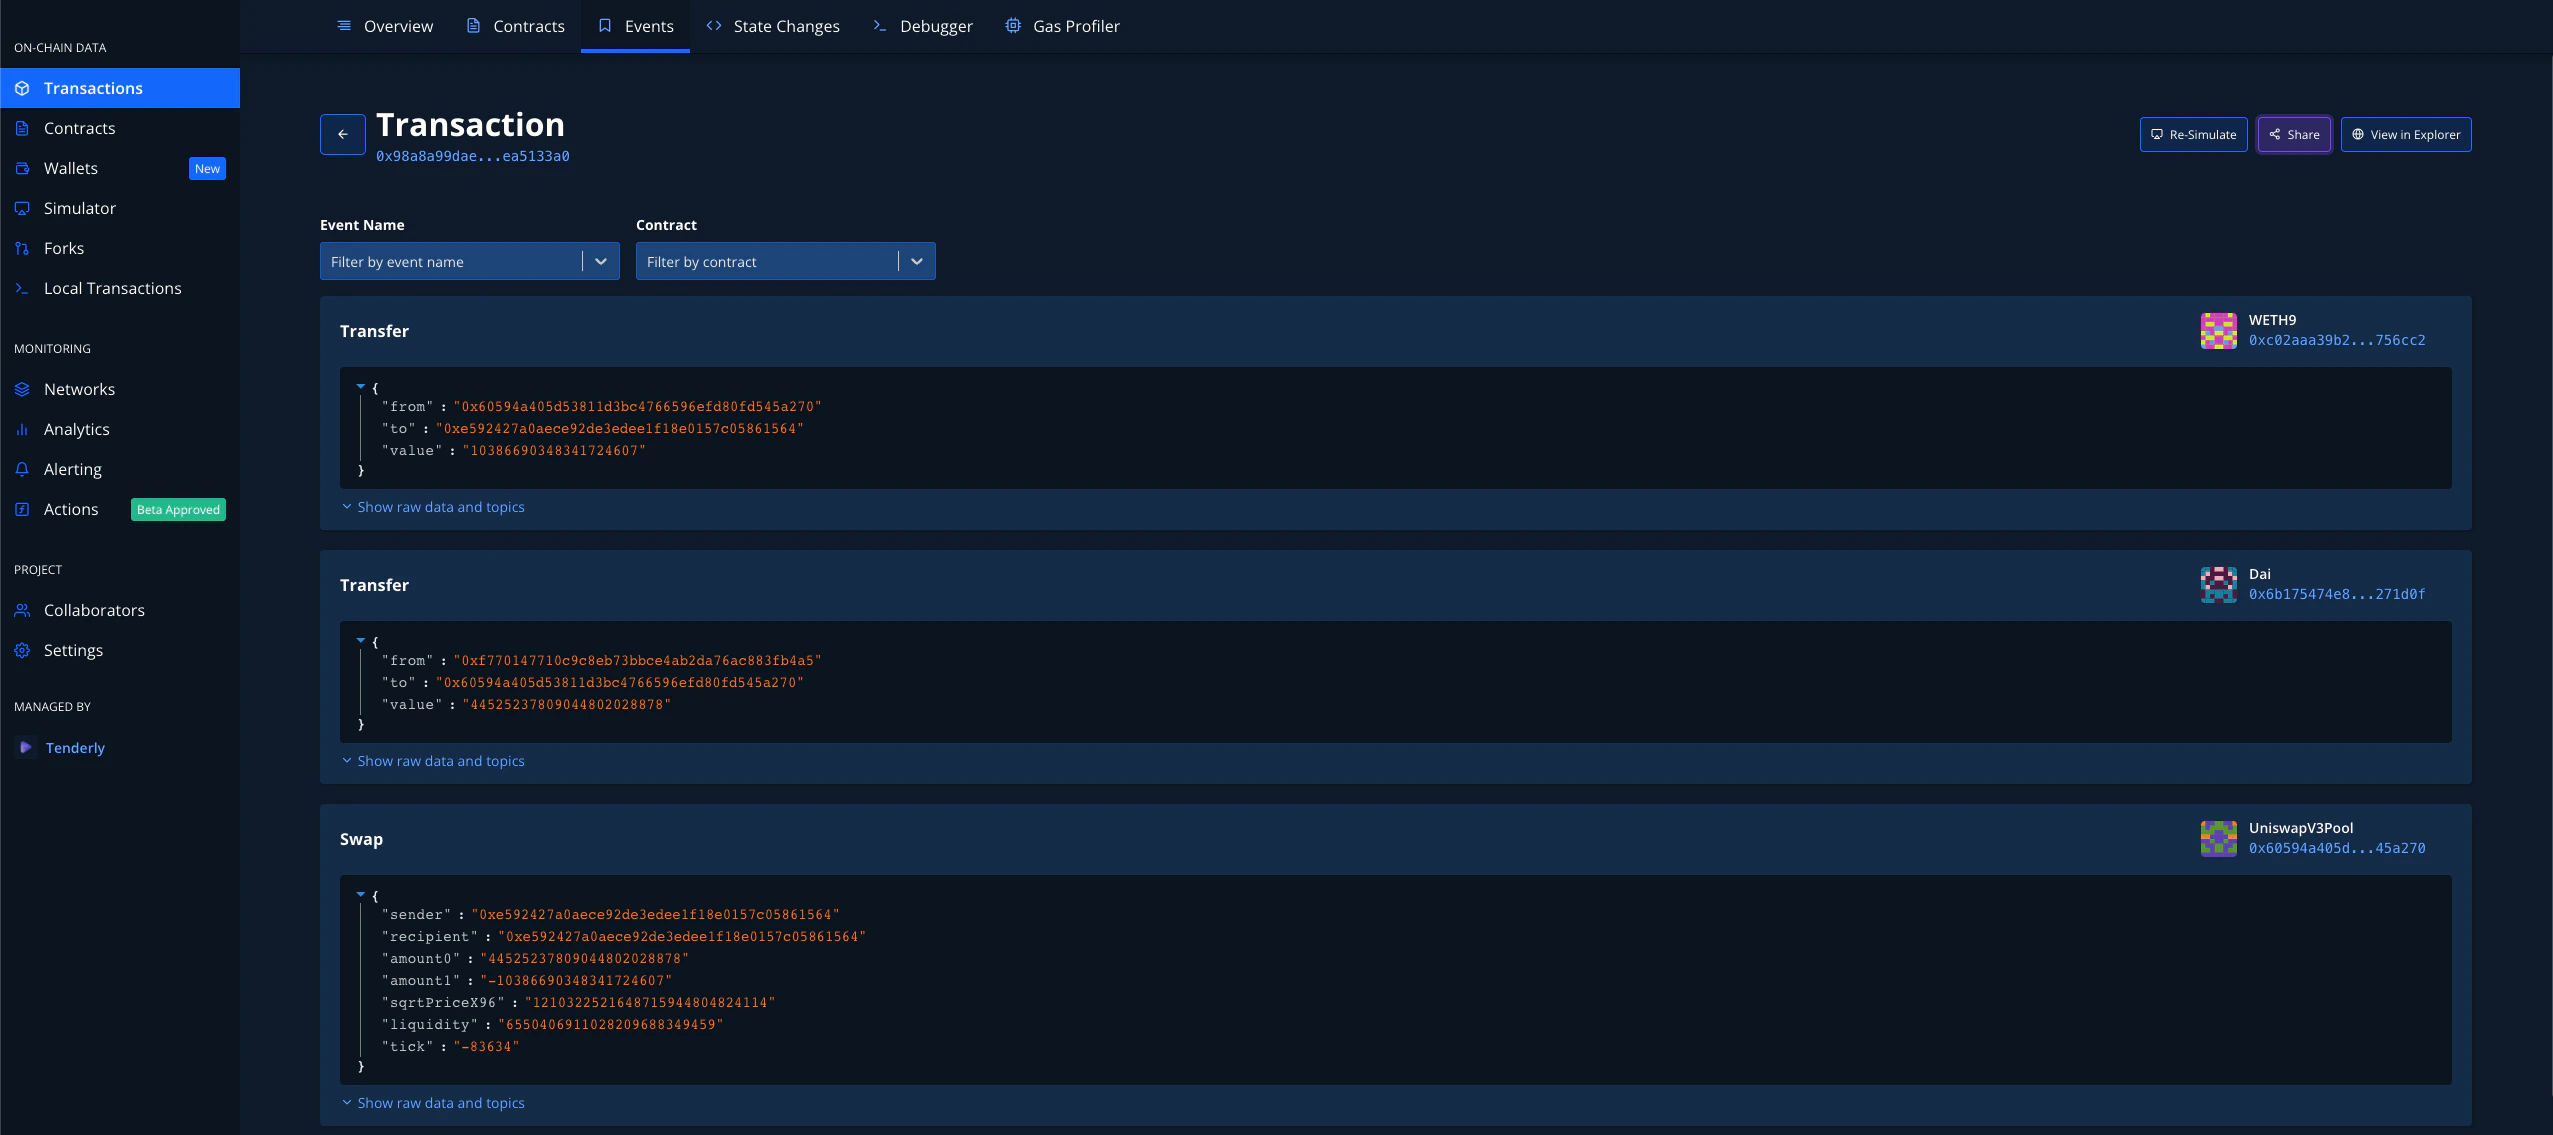
State Changes
As Smart Contracts are getting more and more complex, the states of those smart contracts are getting more complex as well.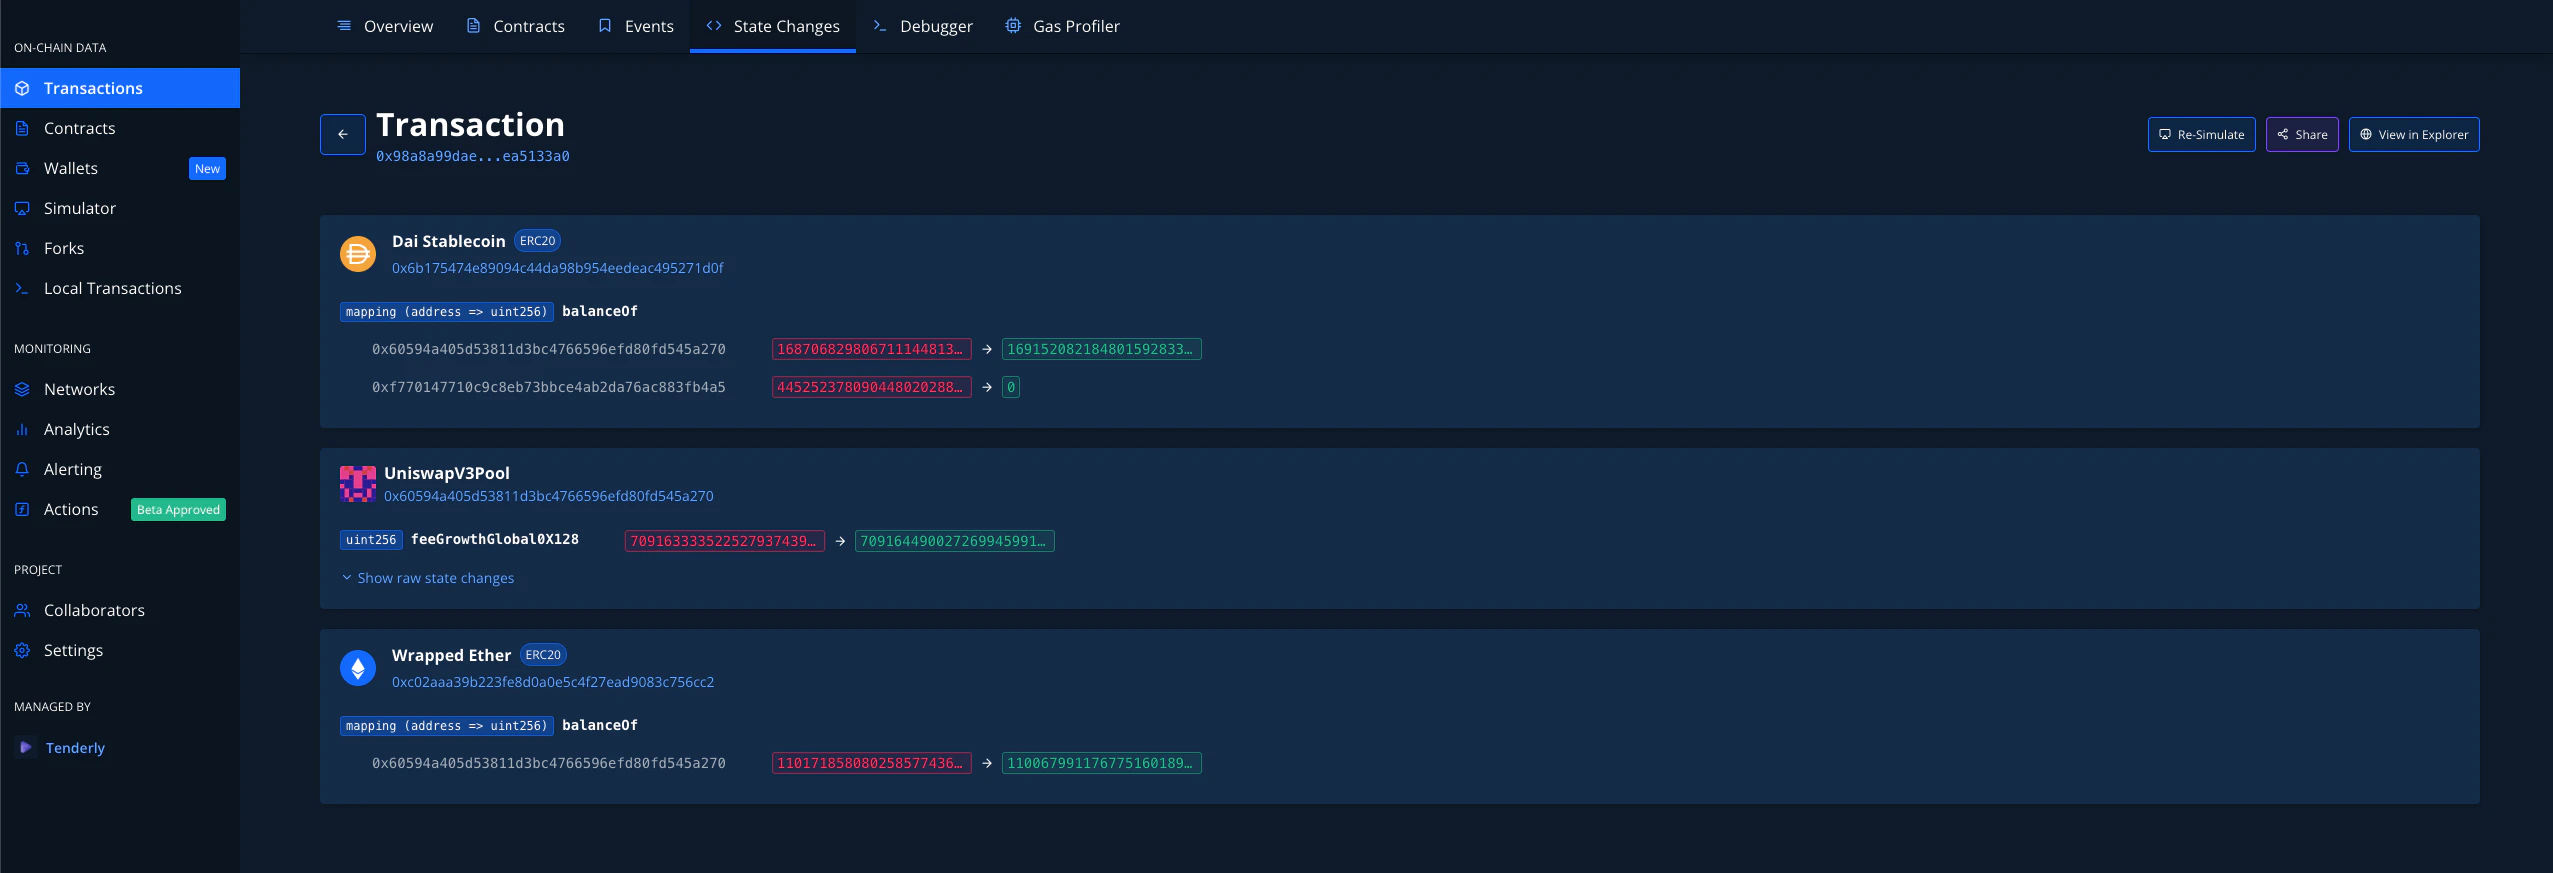
Debugger
Debugging stack traces is an important part of any developer’s workflow both locally and in production. By clicking on the Debugger tab, you’ll be able to deep-dive into everything that happened with your (or any other) transaction.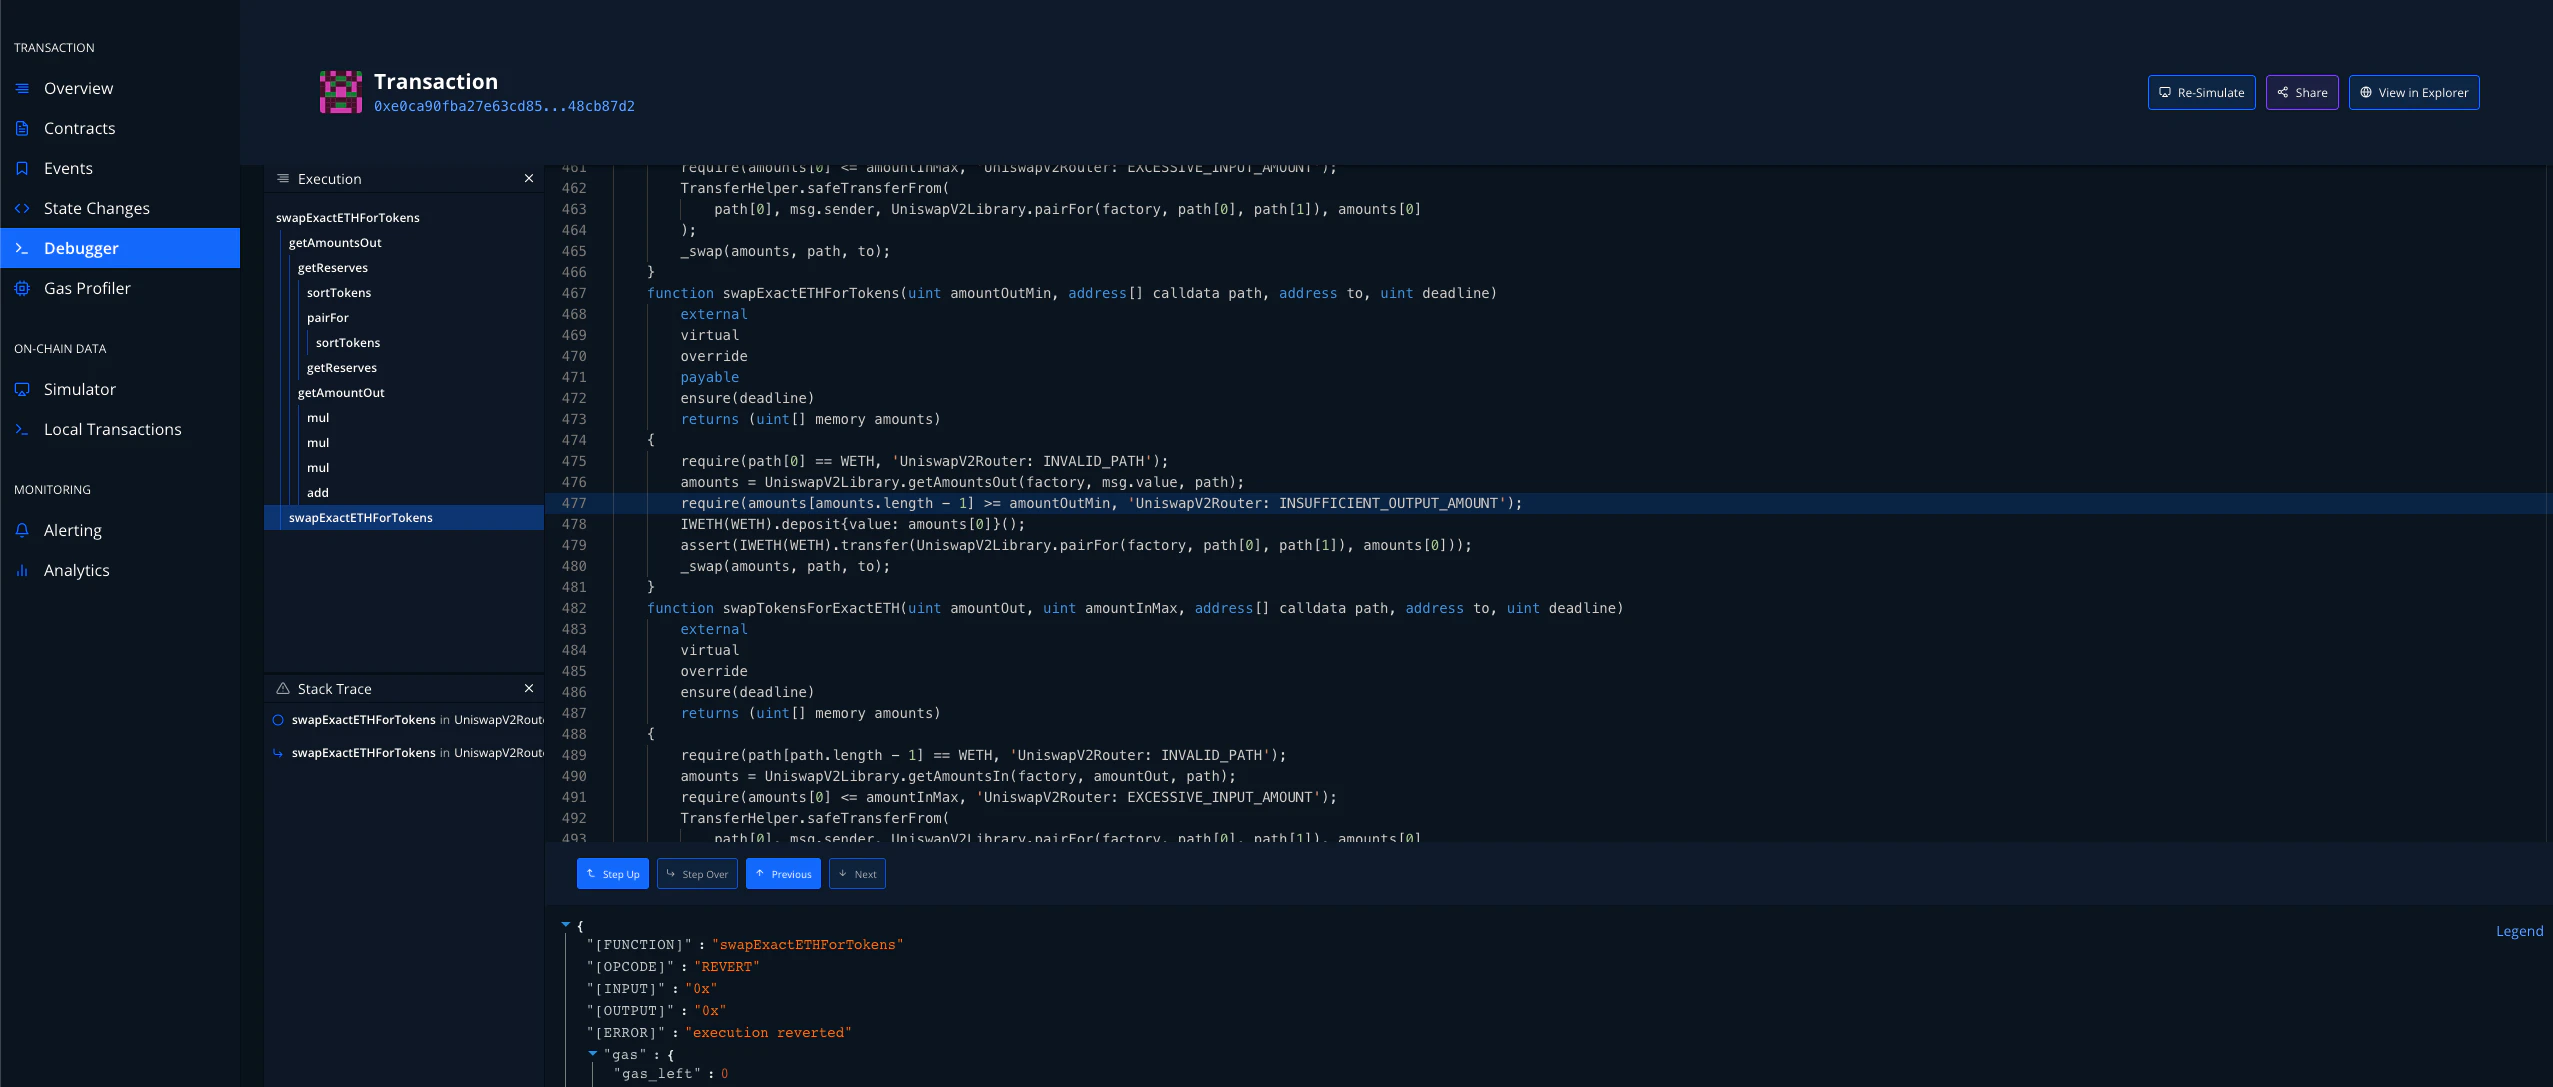
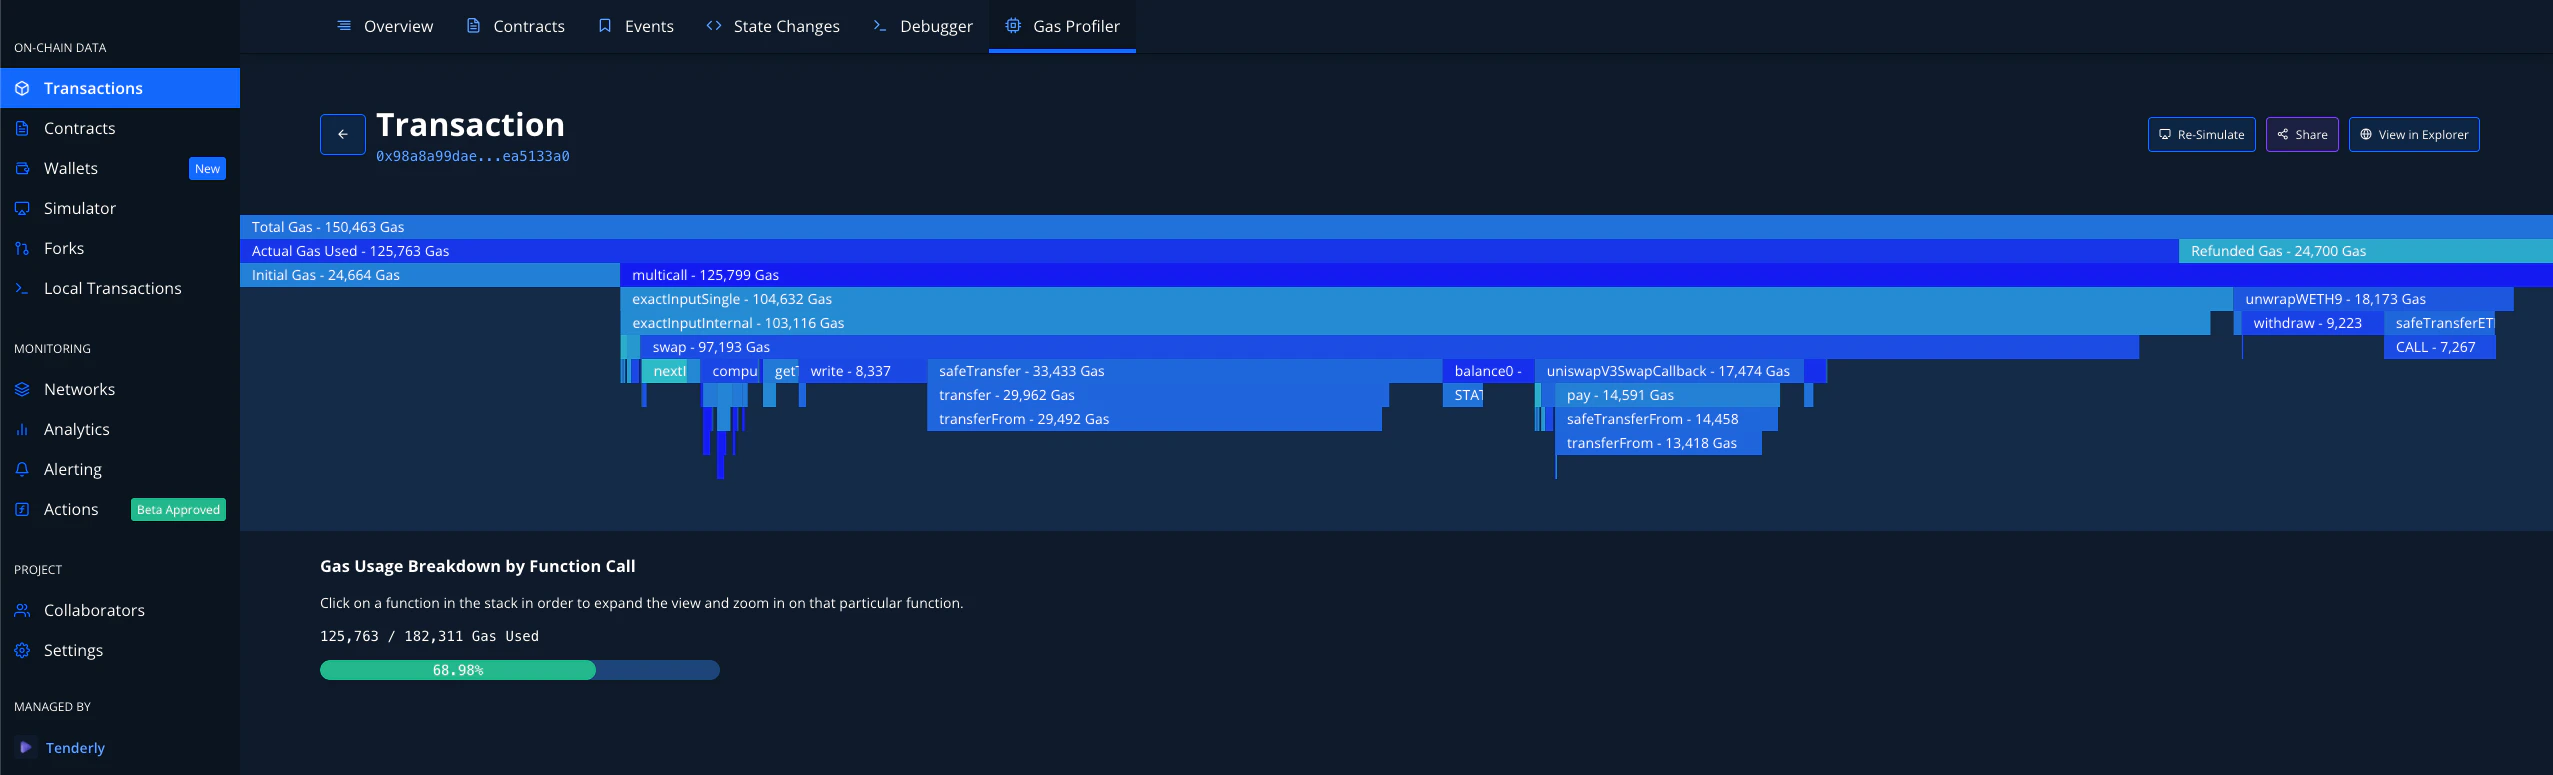
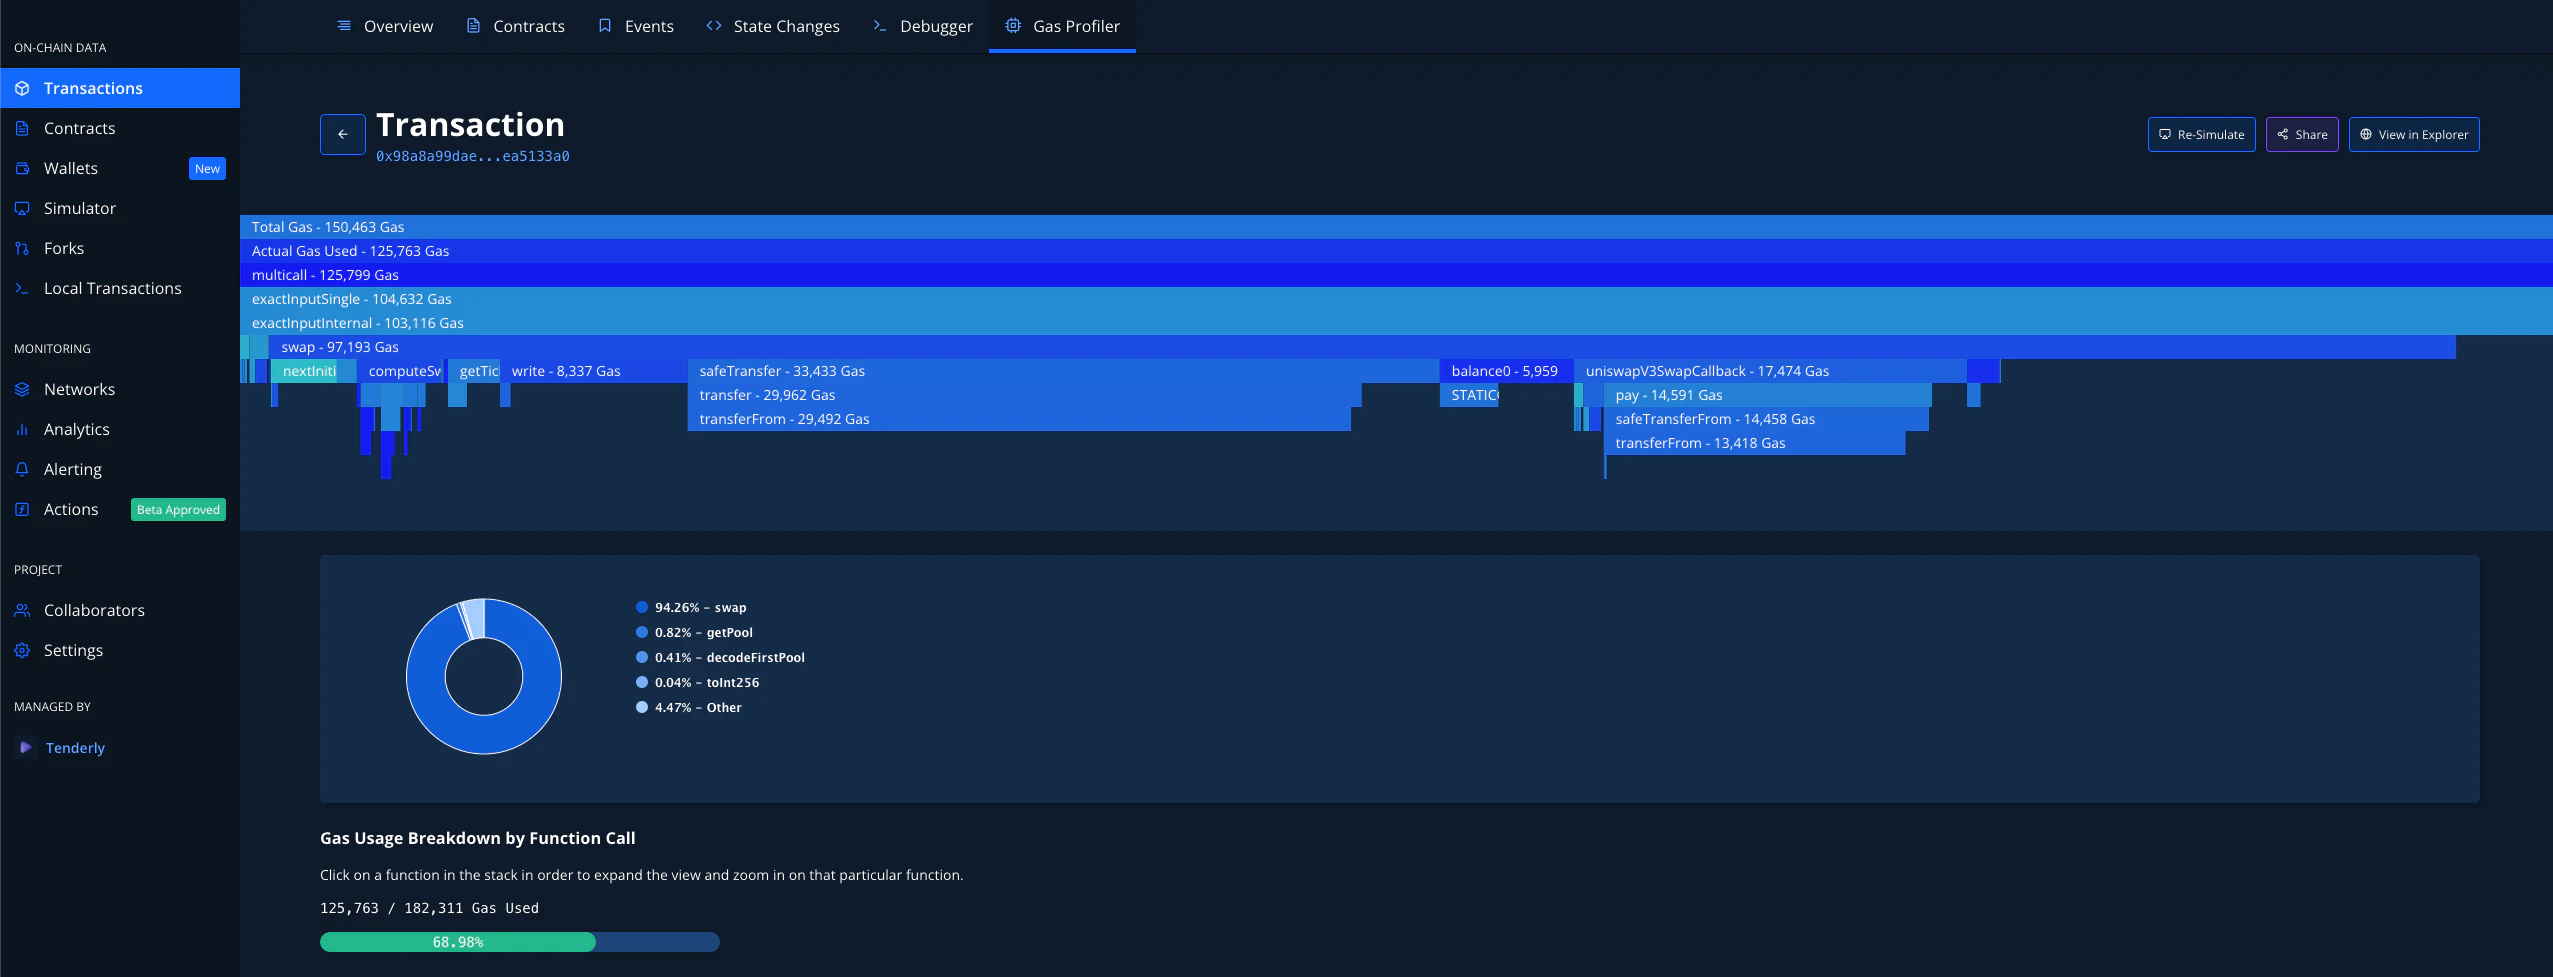
Gas Profiler