Inspect Transaction
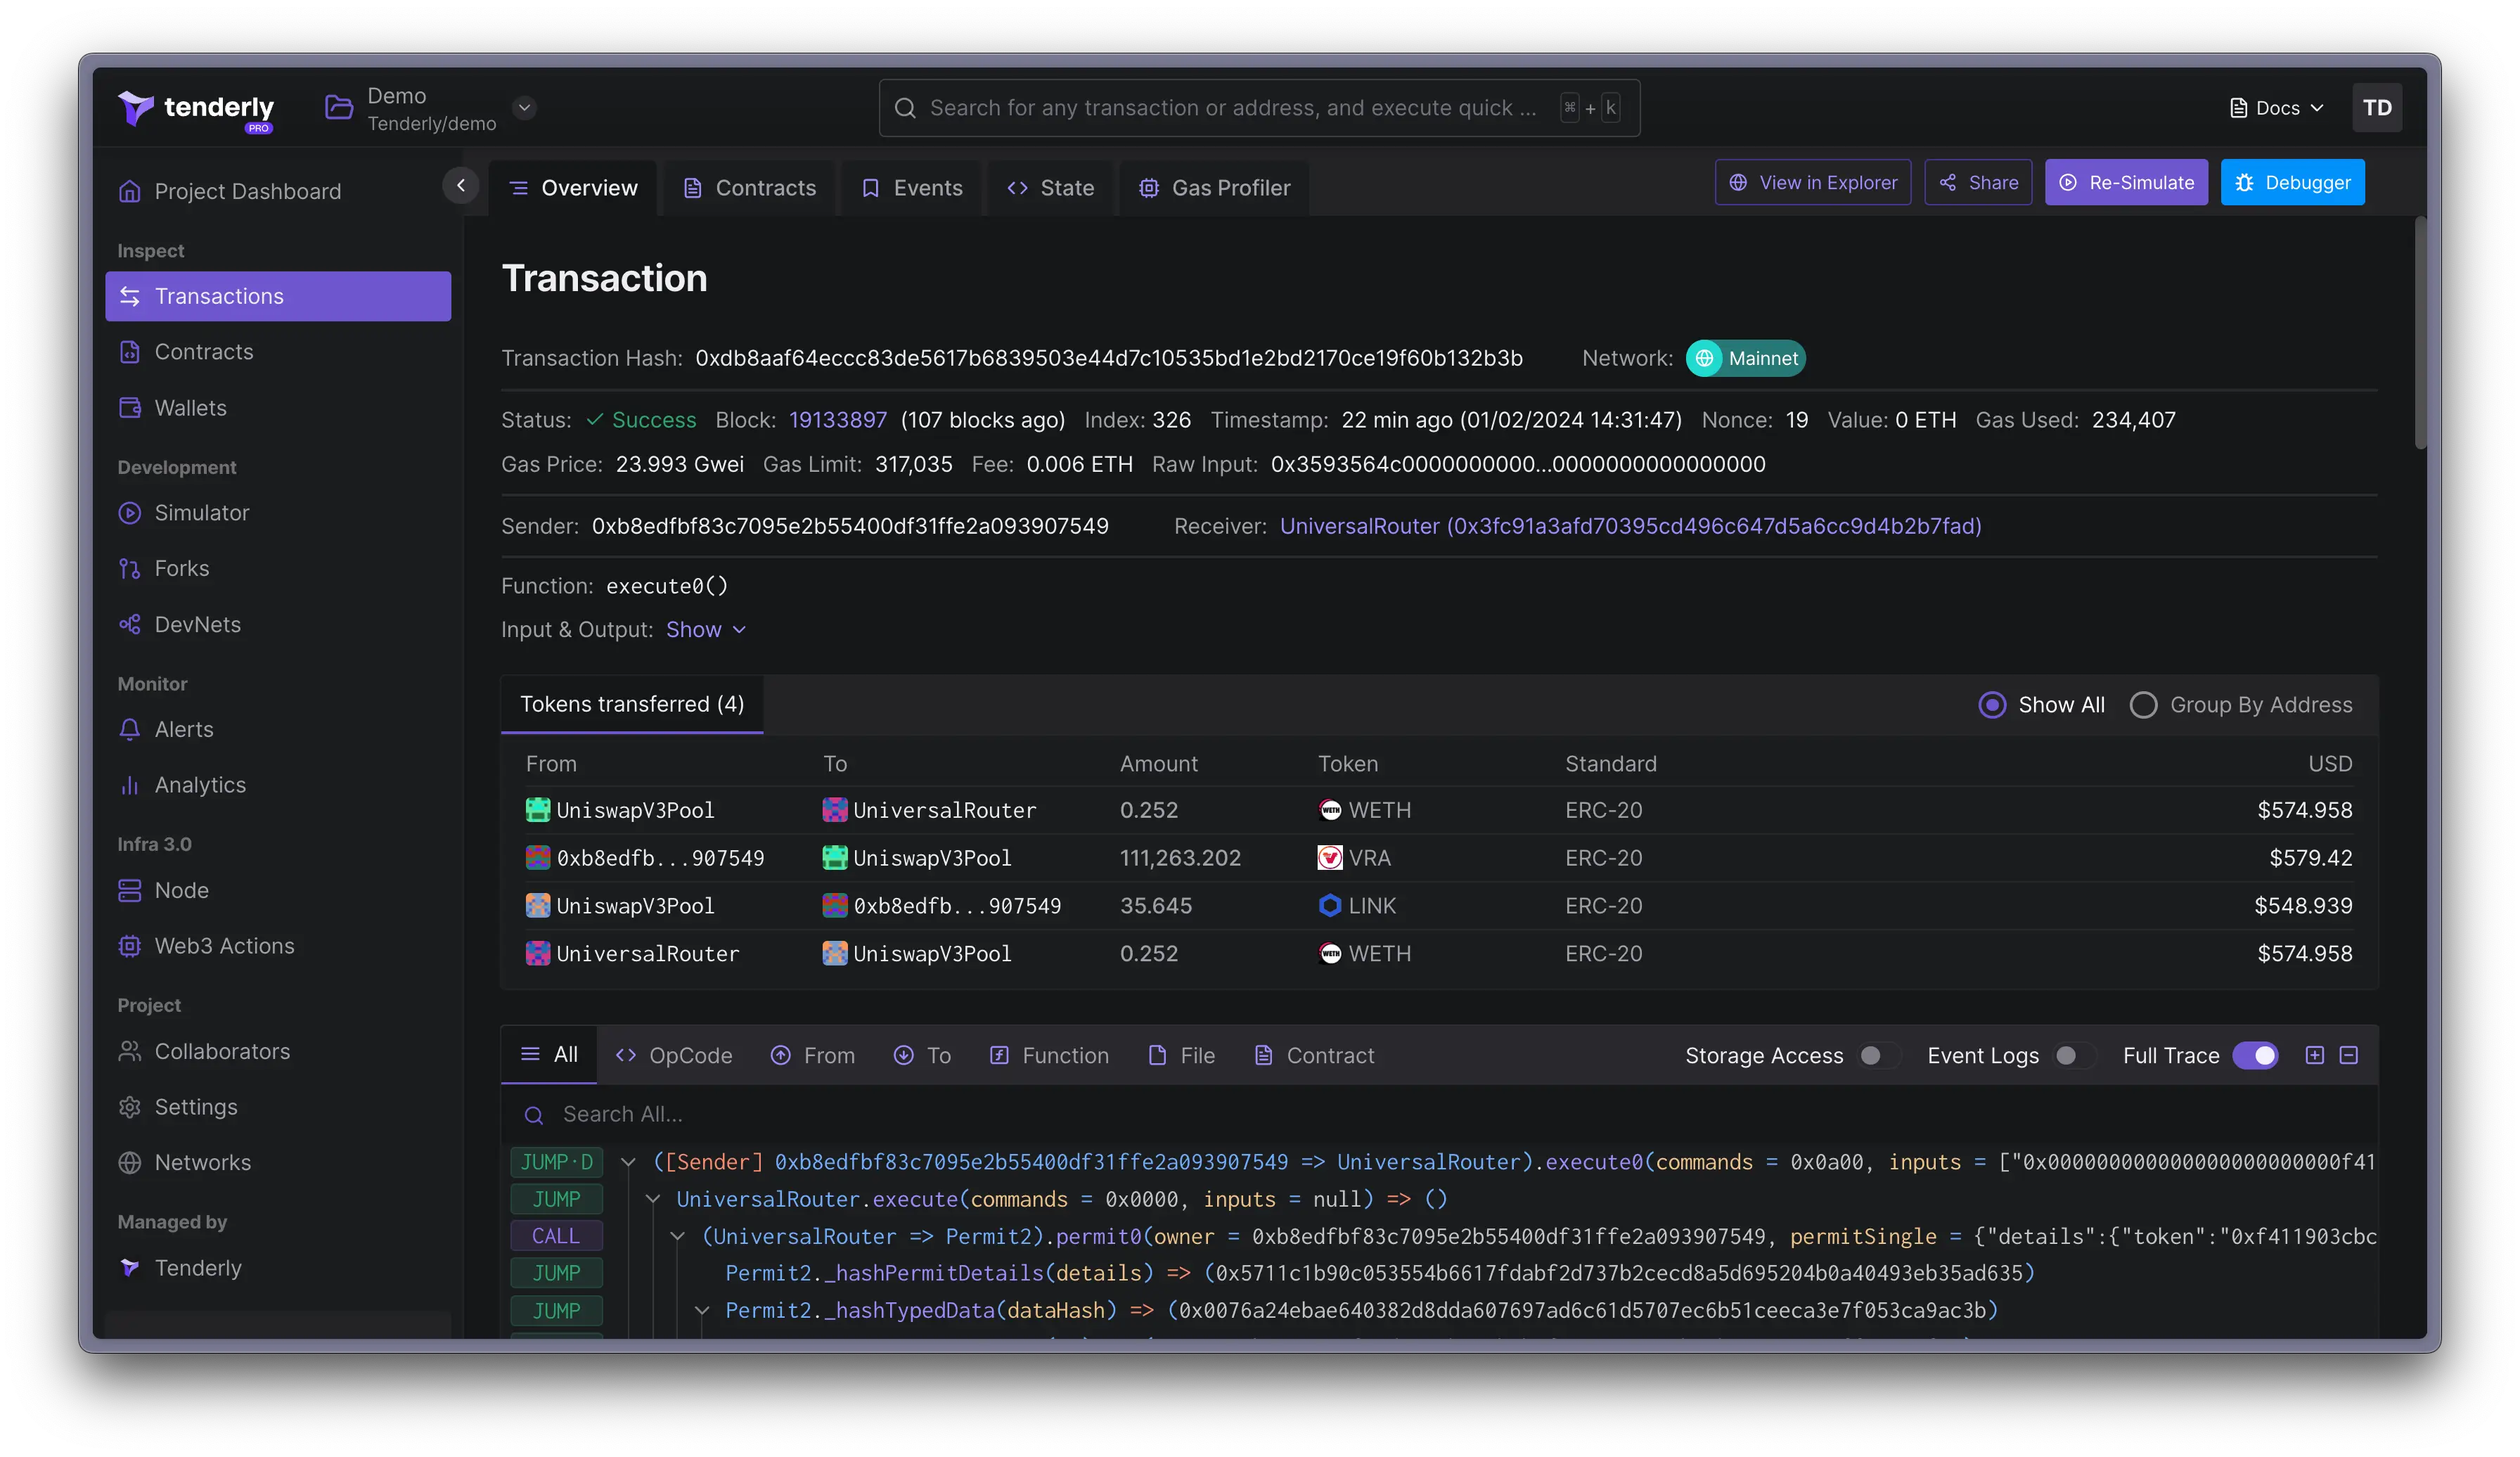
Tenderly gives you the most detailed overview of the transaction execution details. For each transaction, Tenderly extracts the following data and more: General information, Decoded call trace, Tokens transferred, Contracts involved, State changes, Emitted events, Gas used, and more.
From the transaction overview page, you can also access Debugger to dig deeper into the stack trace and smart contract source code. You can also use the Simulator to modify the numerous transaction parameters and simulate the outcomes against the latest state of the network.
Decoded call trace
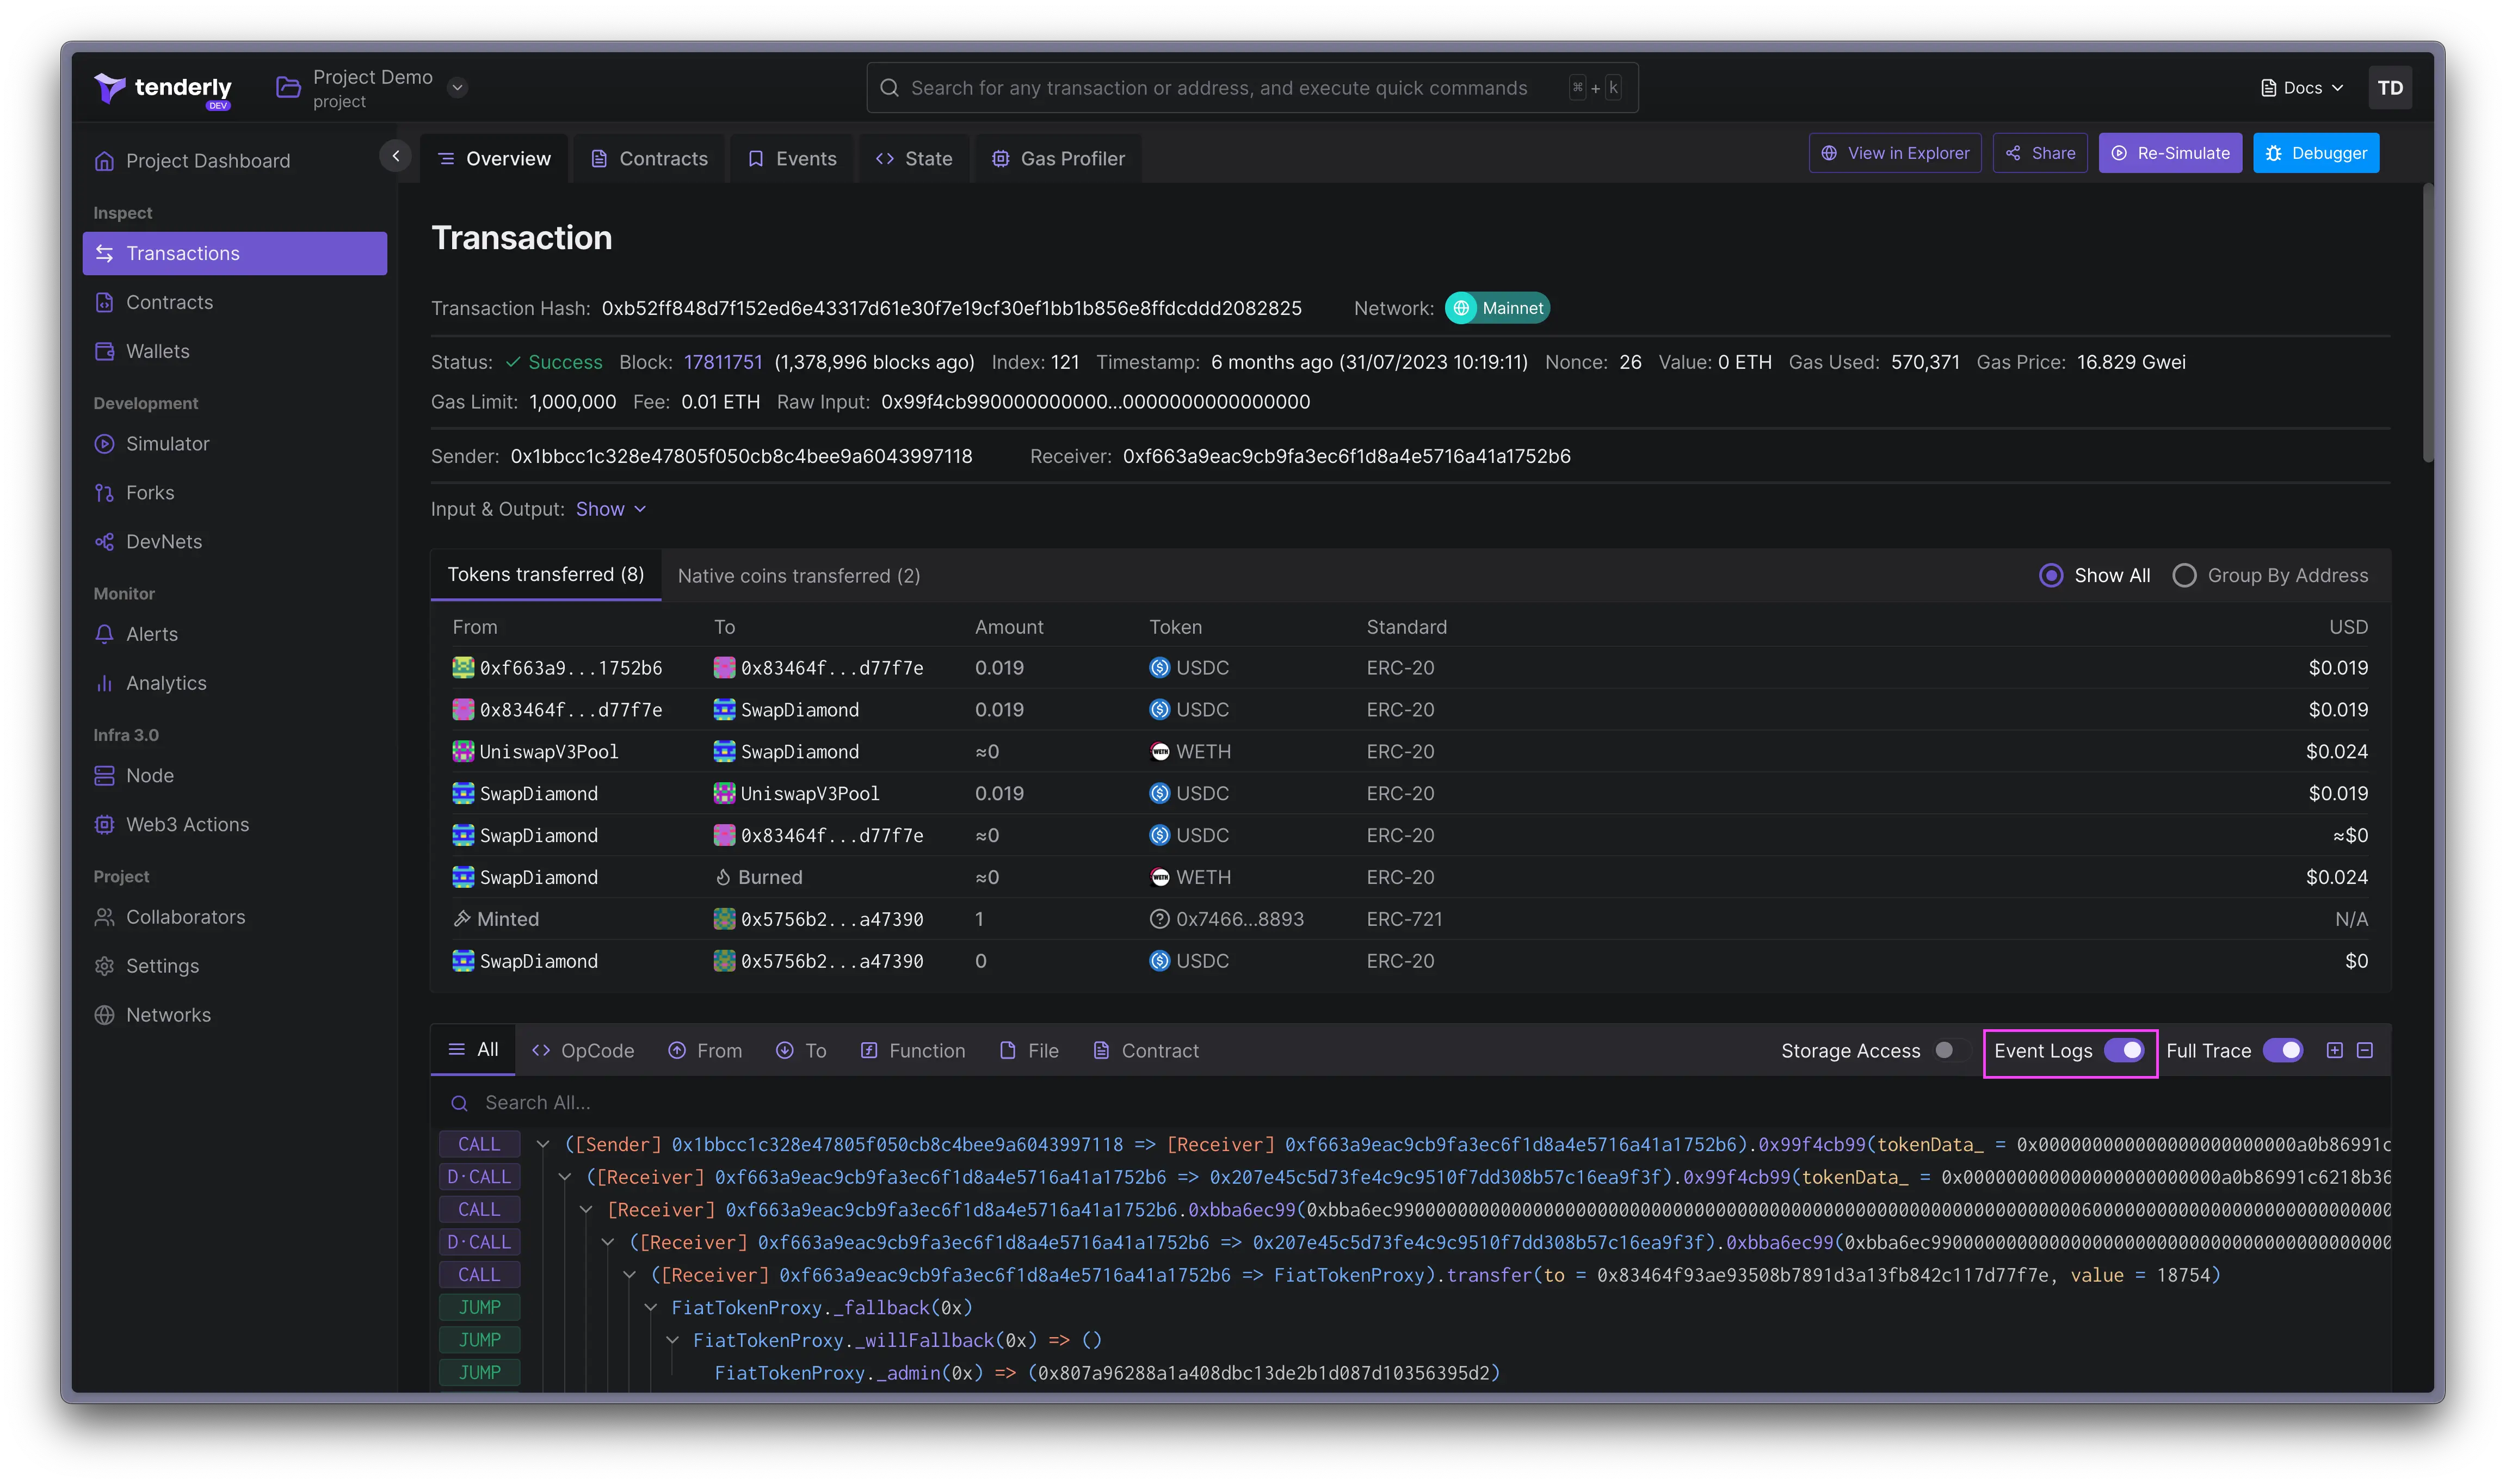
The decoded call trace panel allows you to inspect the various opcodes, including inputs and outputs: JUMP, CALL, DELEGATECALL, STATICCALL, CREATE2, CREATE, REVERT, JUMPDEST, SLOAD, and SSTORE. Learn more about EVM opcodes here.
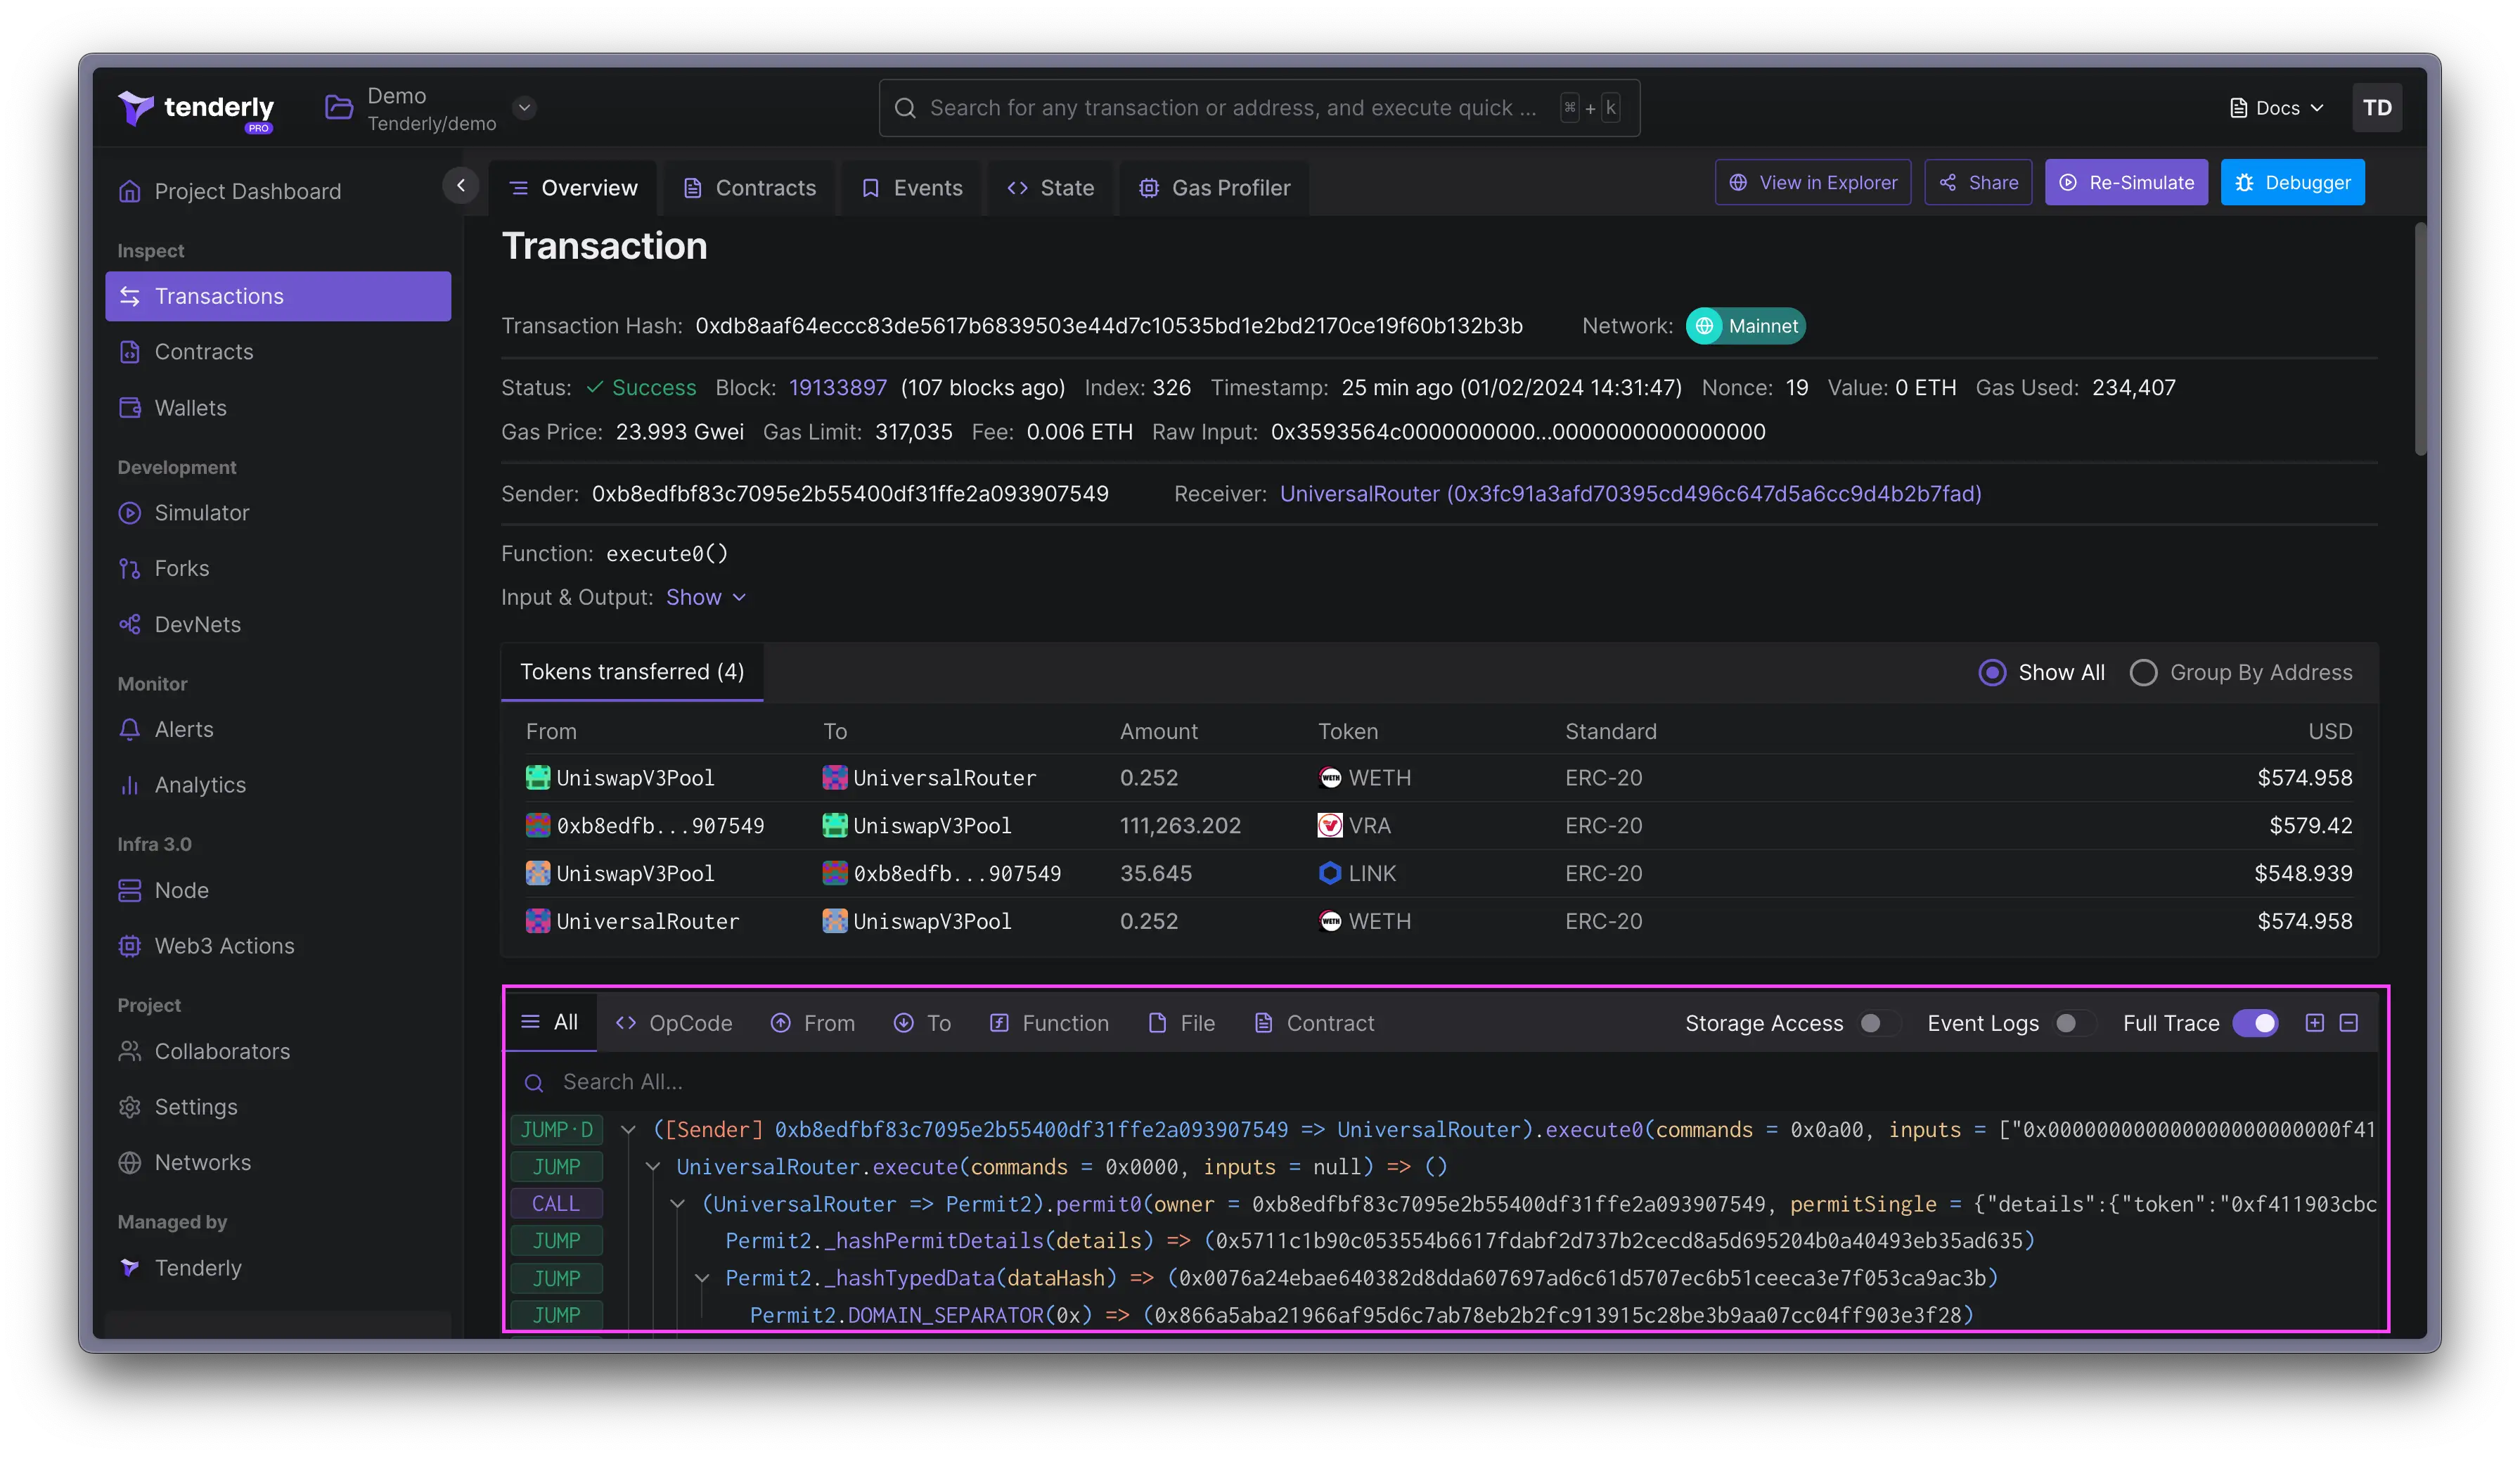
You also have control over how much data about the call trace is displayed in the Dashboard. Toggle the Full Trace, Storage Access, and Event Logs to include and exclude information from the call trace.
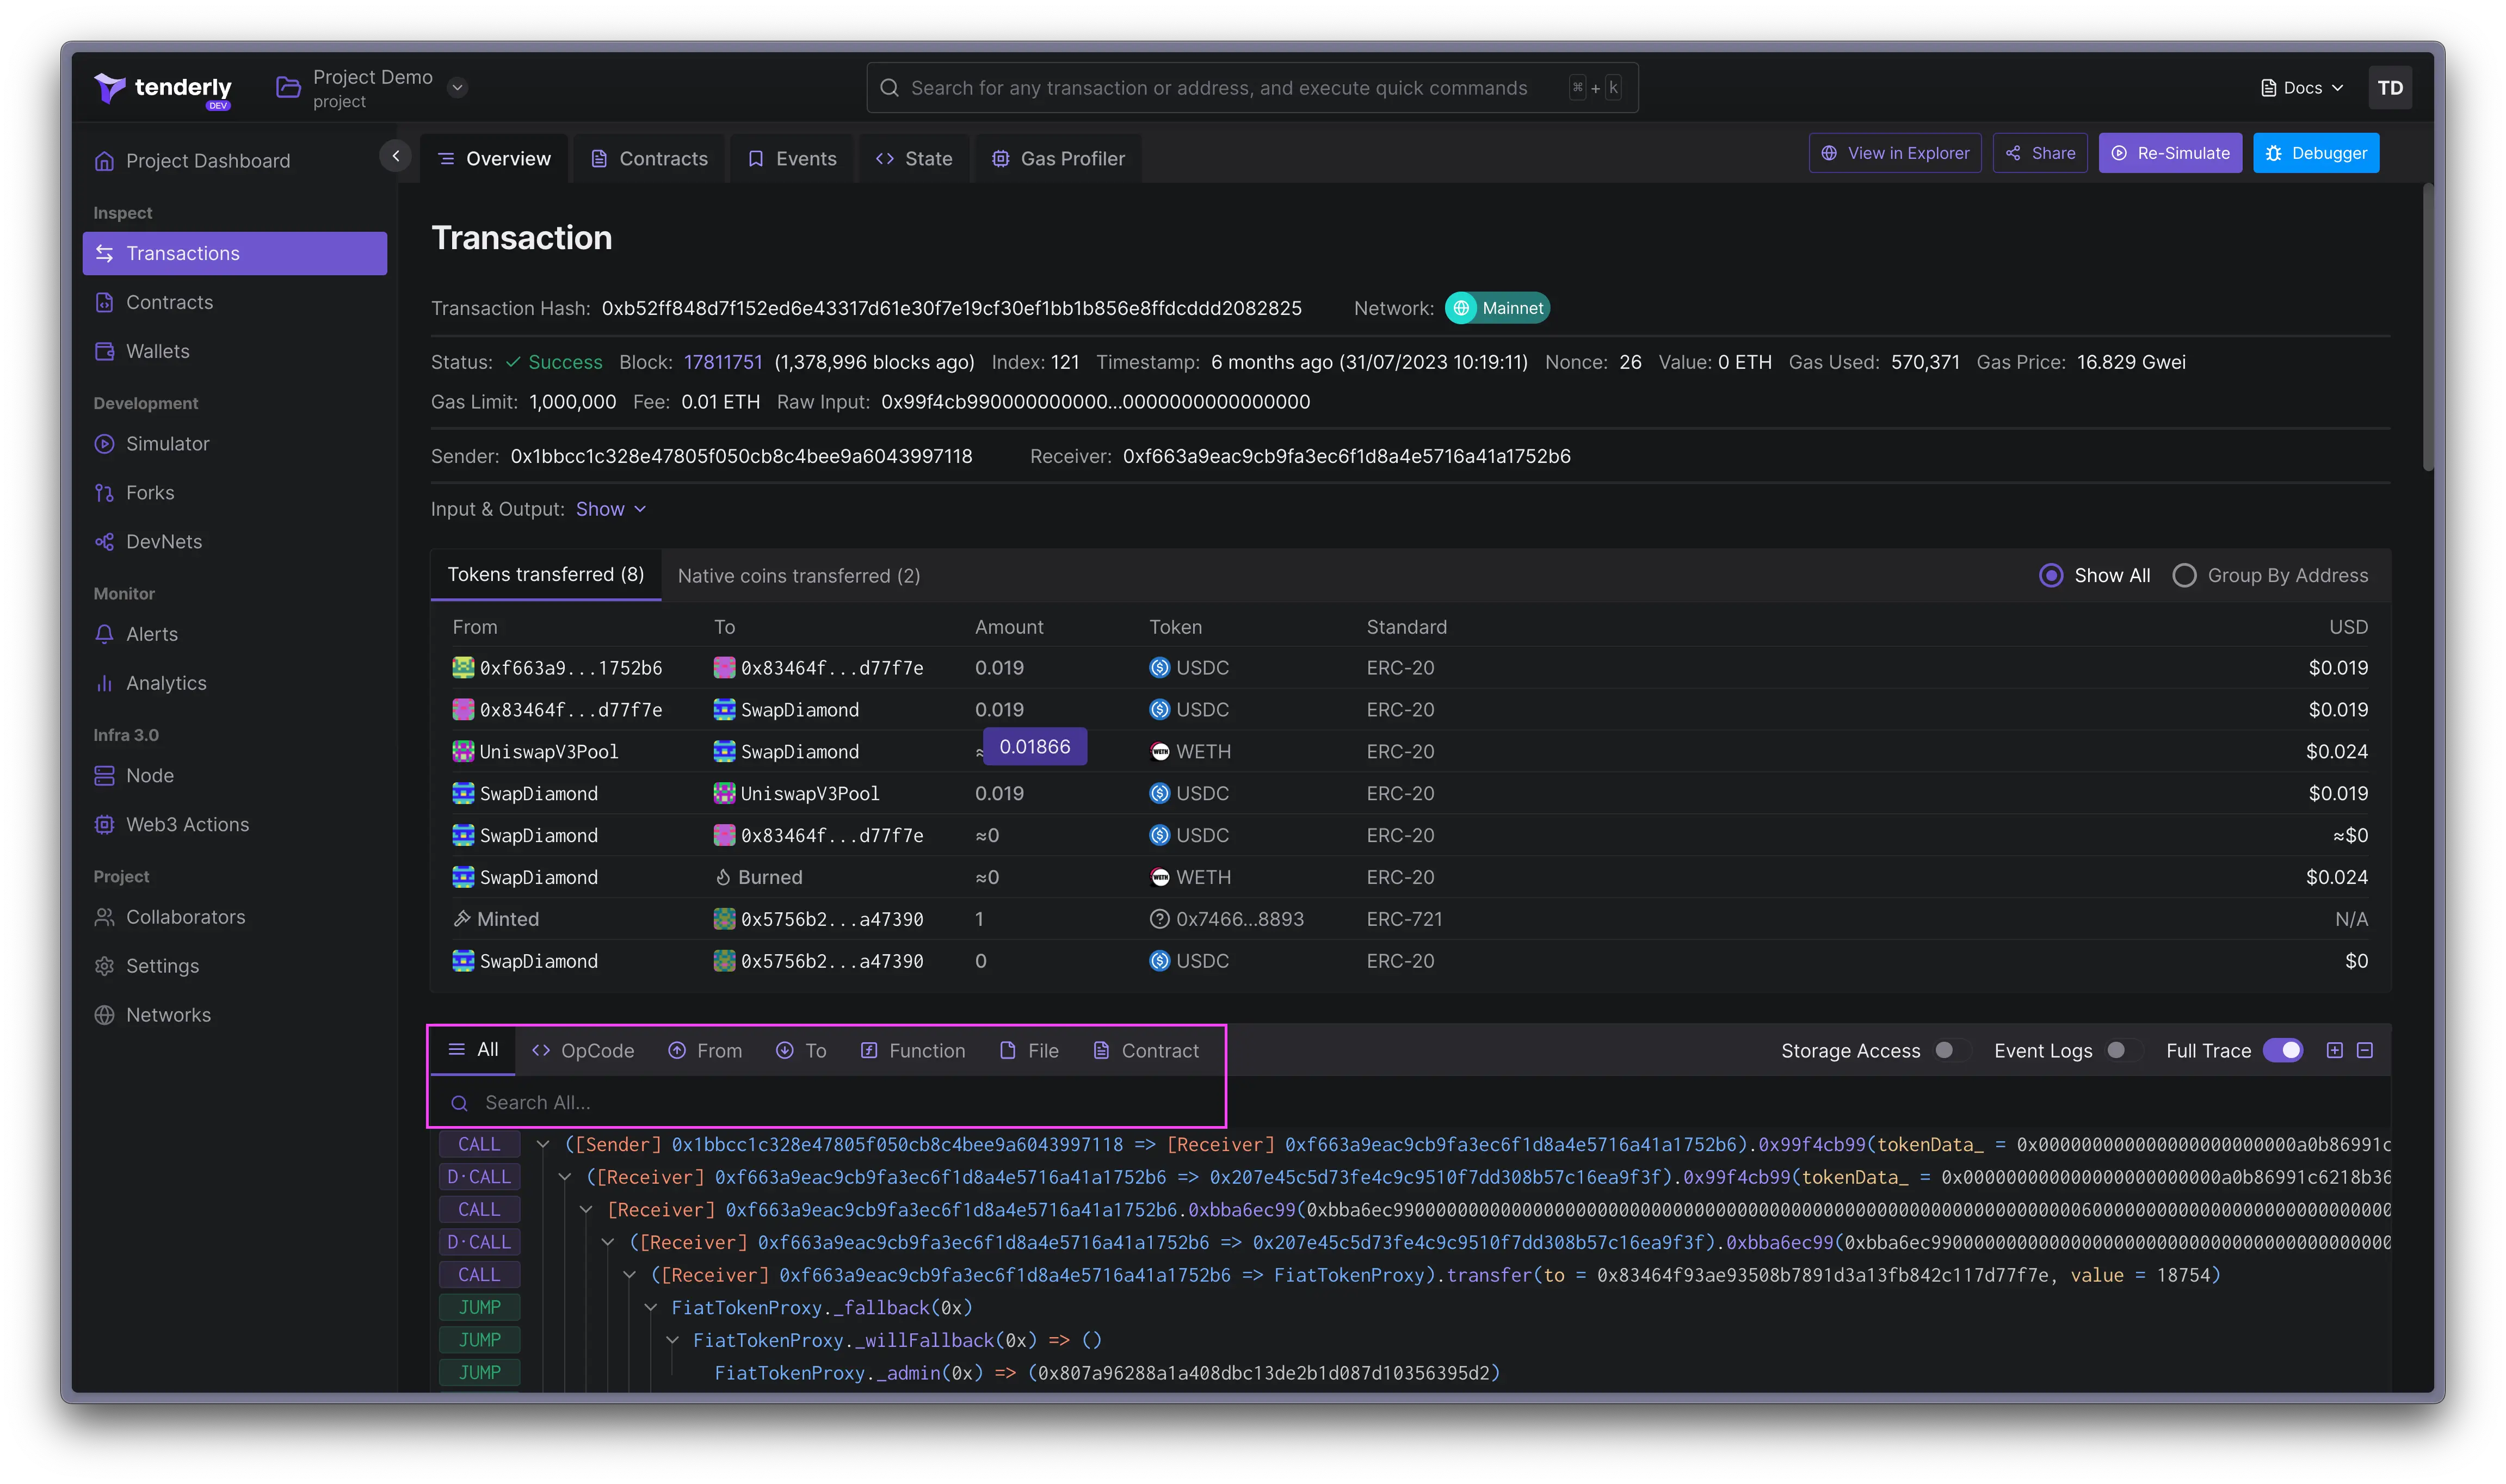
Search the call trace
You can search through the entire call trace to quickly find specific opcodes, functions, and variables. The search option also works if you need to find send and receiver addresses, Solidity files, and contracts.
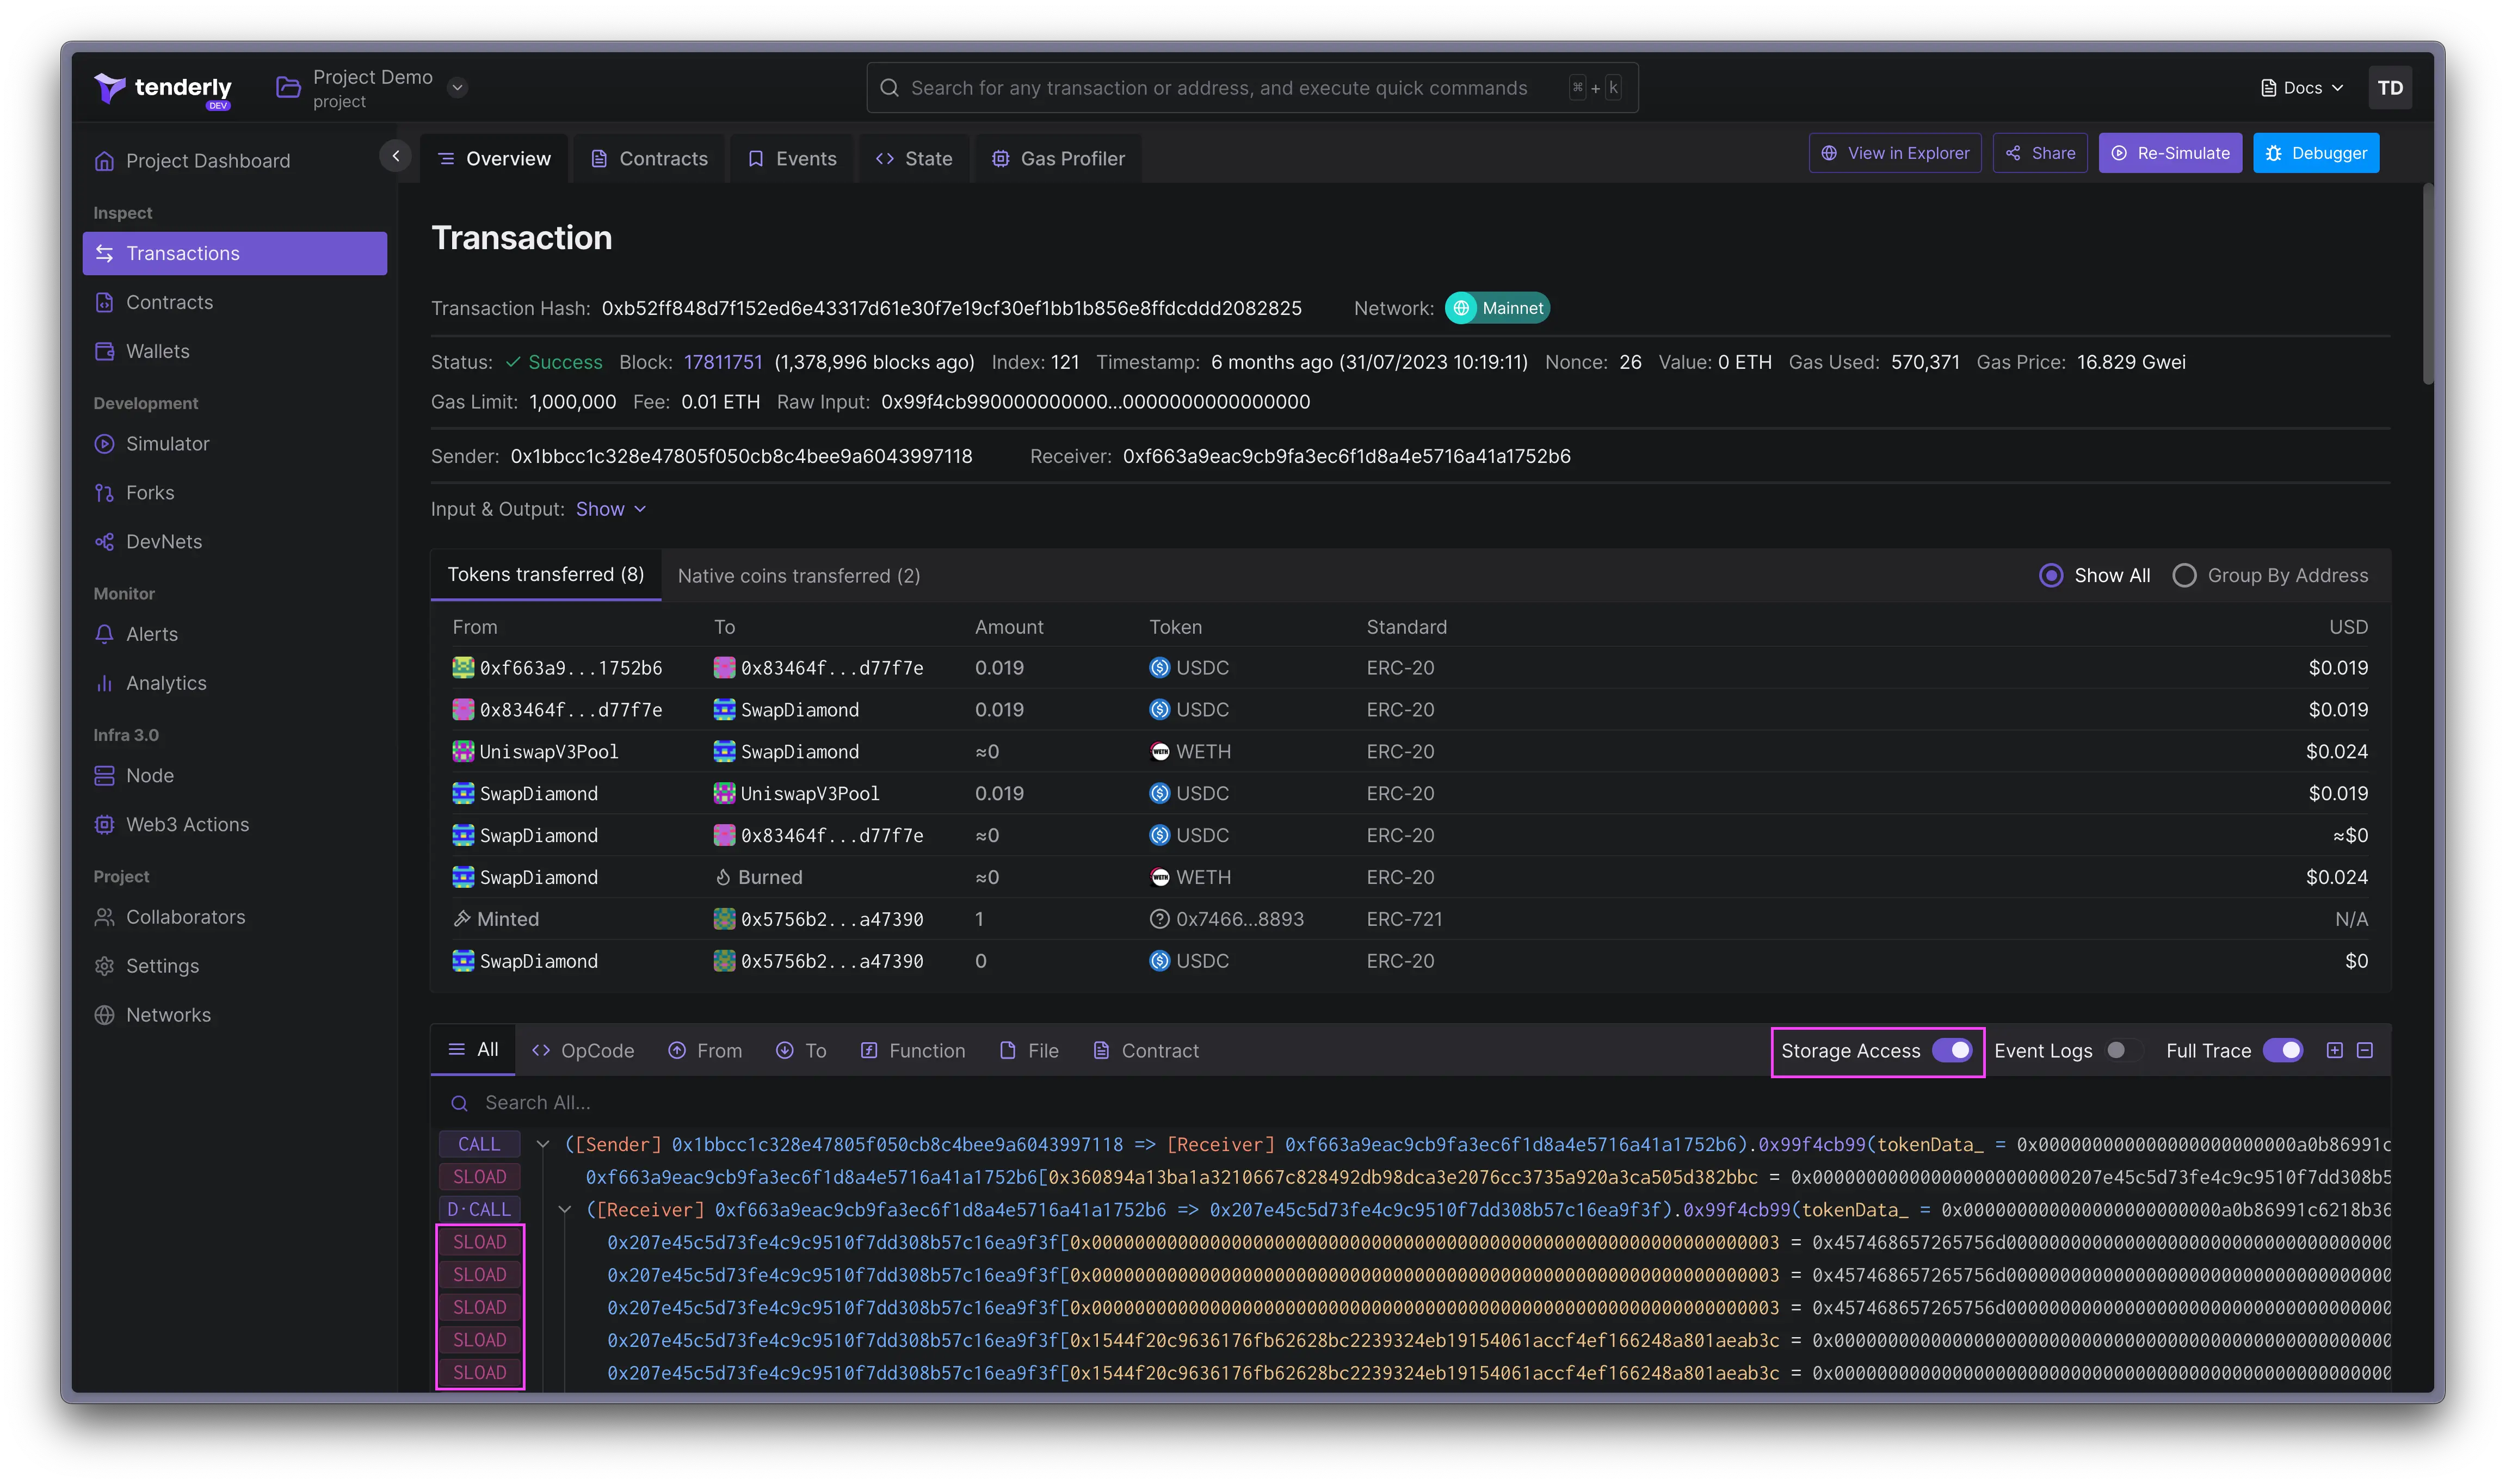
Storage access
Click the Storage Access to include the SSLOAD and SSTORE opcodes, the storage slot accessed, and any changes in value in the call trace. The storage opcodes are not displayed by default; you need to enable them.
Event logs
Toggle the Events Log option to include the log opcodes log0 to log4 in the call trace. Enabling this option will display the events that have happened in the transaction.
Commenting and prioritization
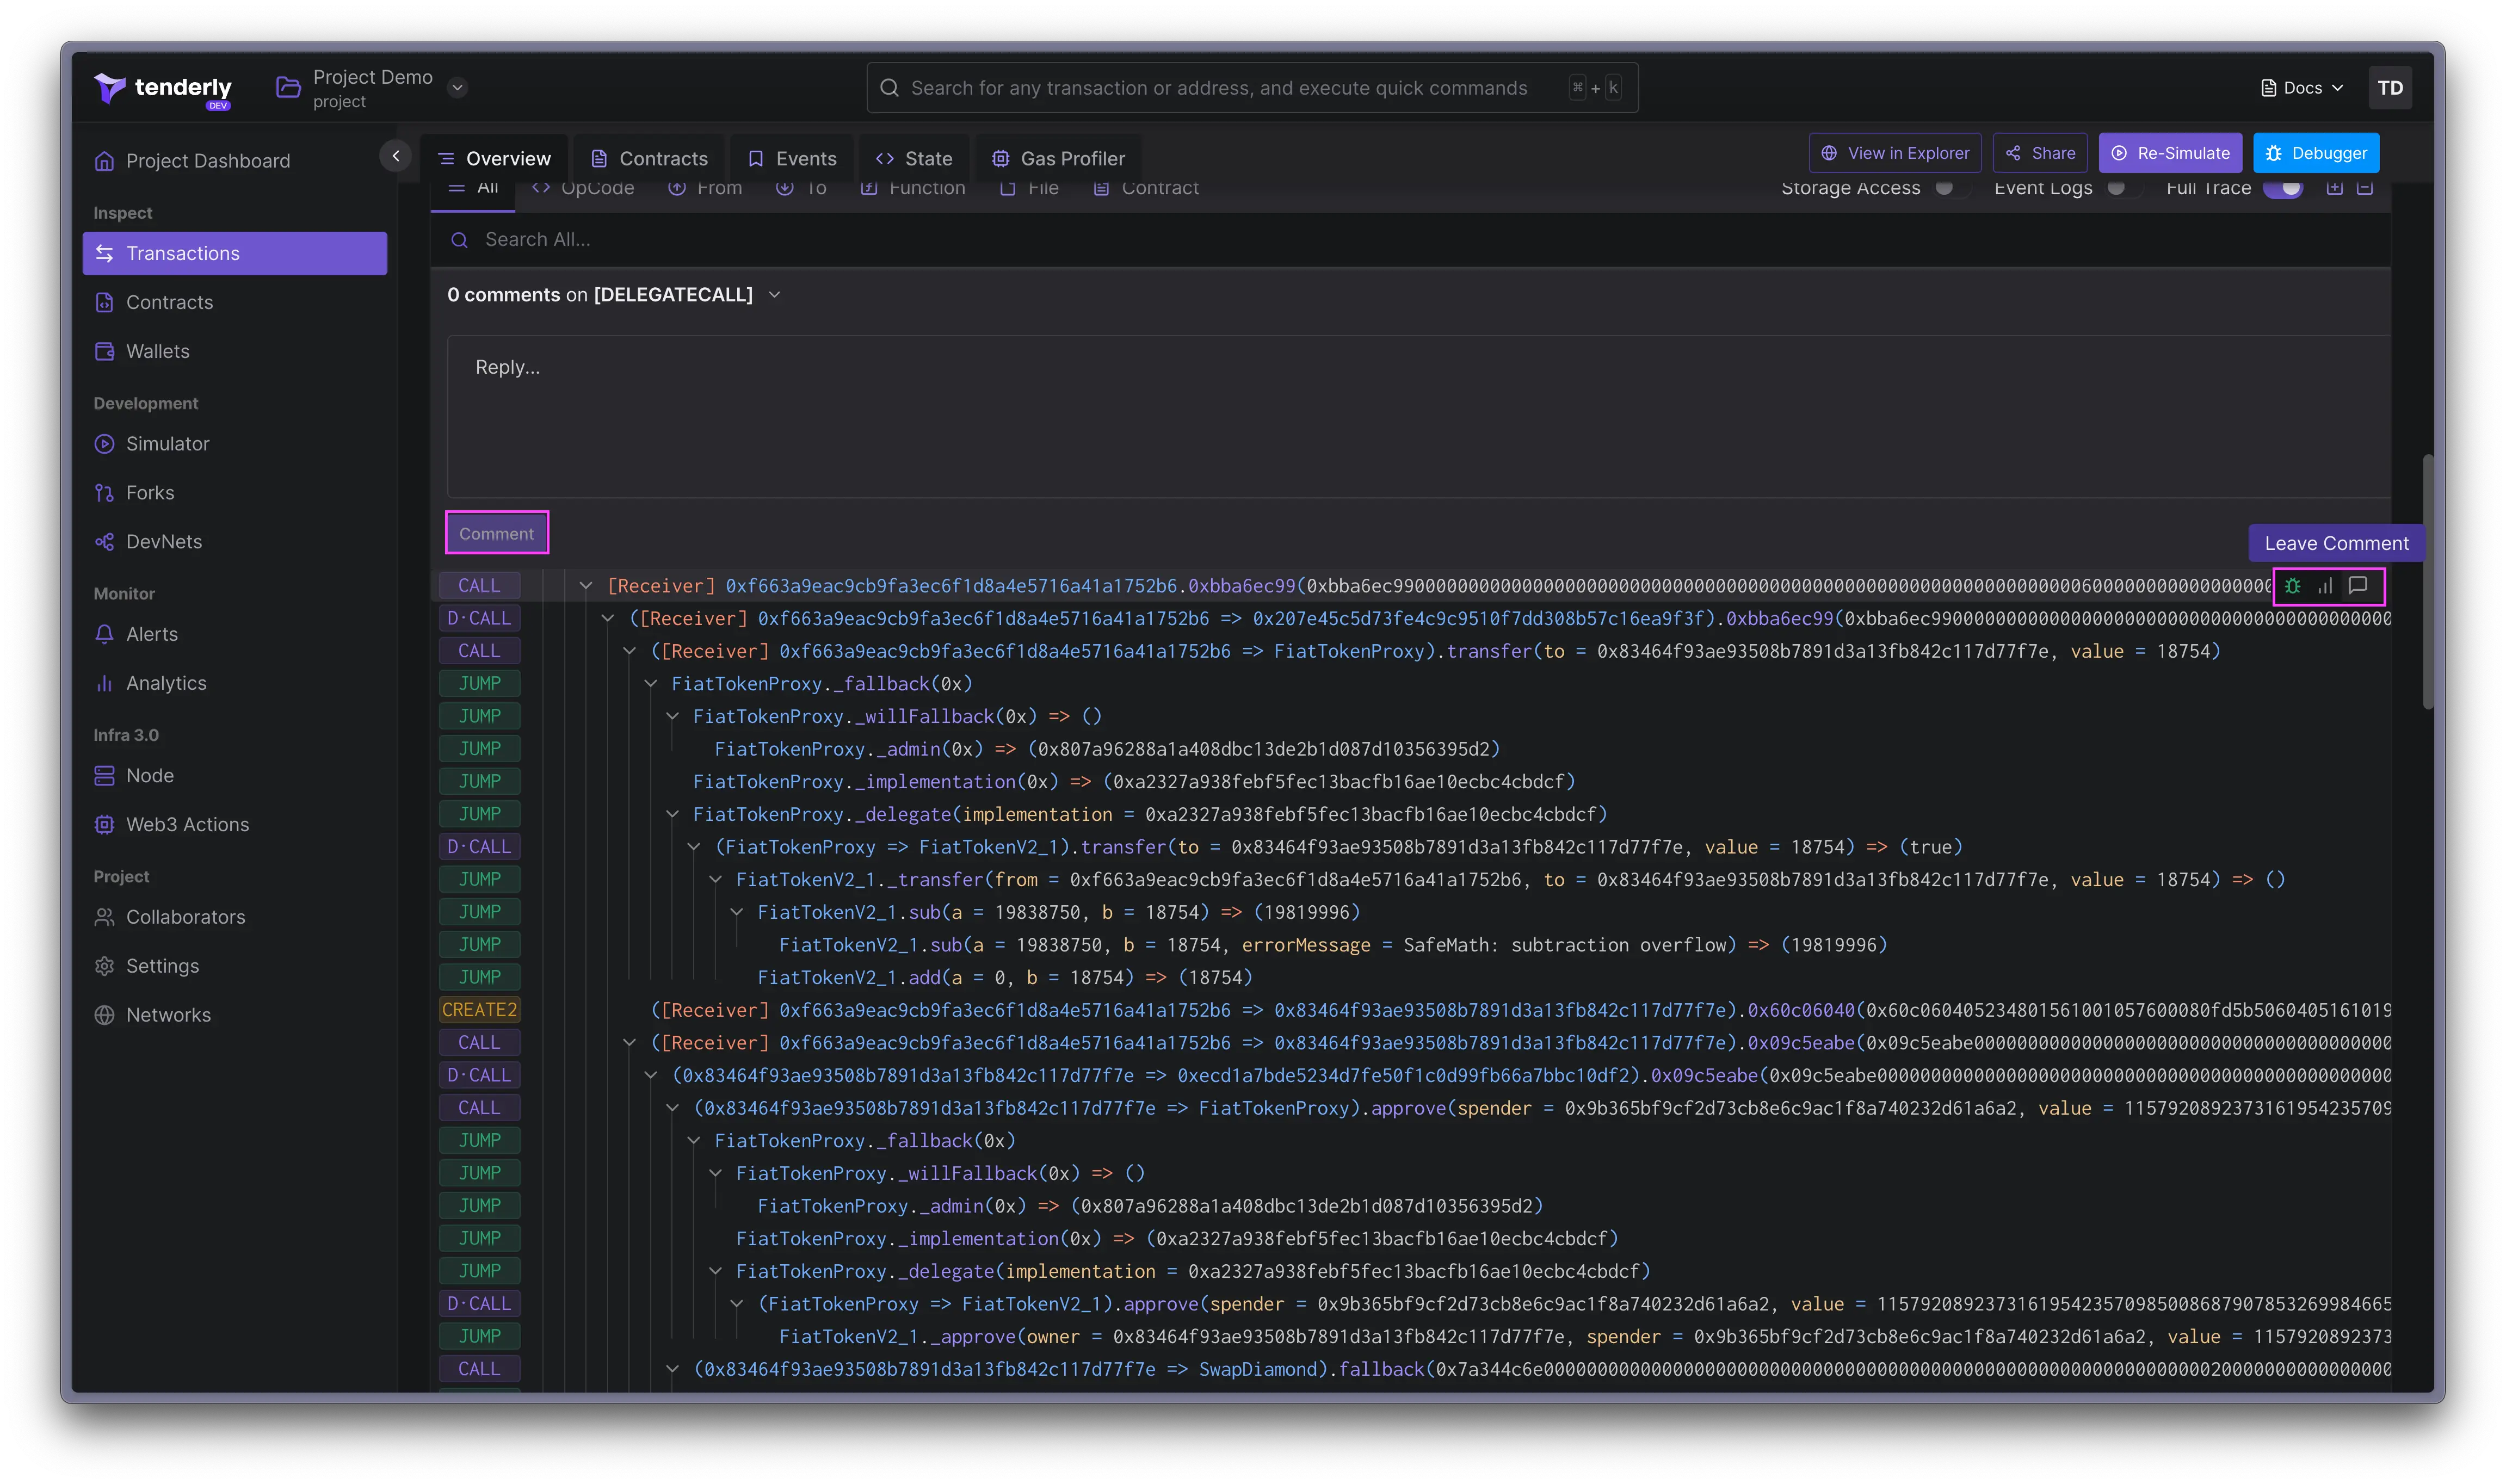
You can leave comments on any of the parts of the call trace. Hover over any element in the call trace and click on the speech bubble icon to leave a comment.
Comments are useful if you’re part of a team and want to leave notes on specific parts of the call trace for other members to see. Comments are visible to all members of the project.
When inspecting the call trace, you might want to set the priority for individual elements to High, Medium, or Low. Hover over any element in the call trace and click on the line graph icon to set or remove the priority.
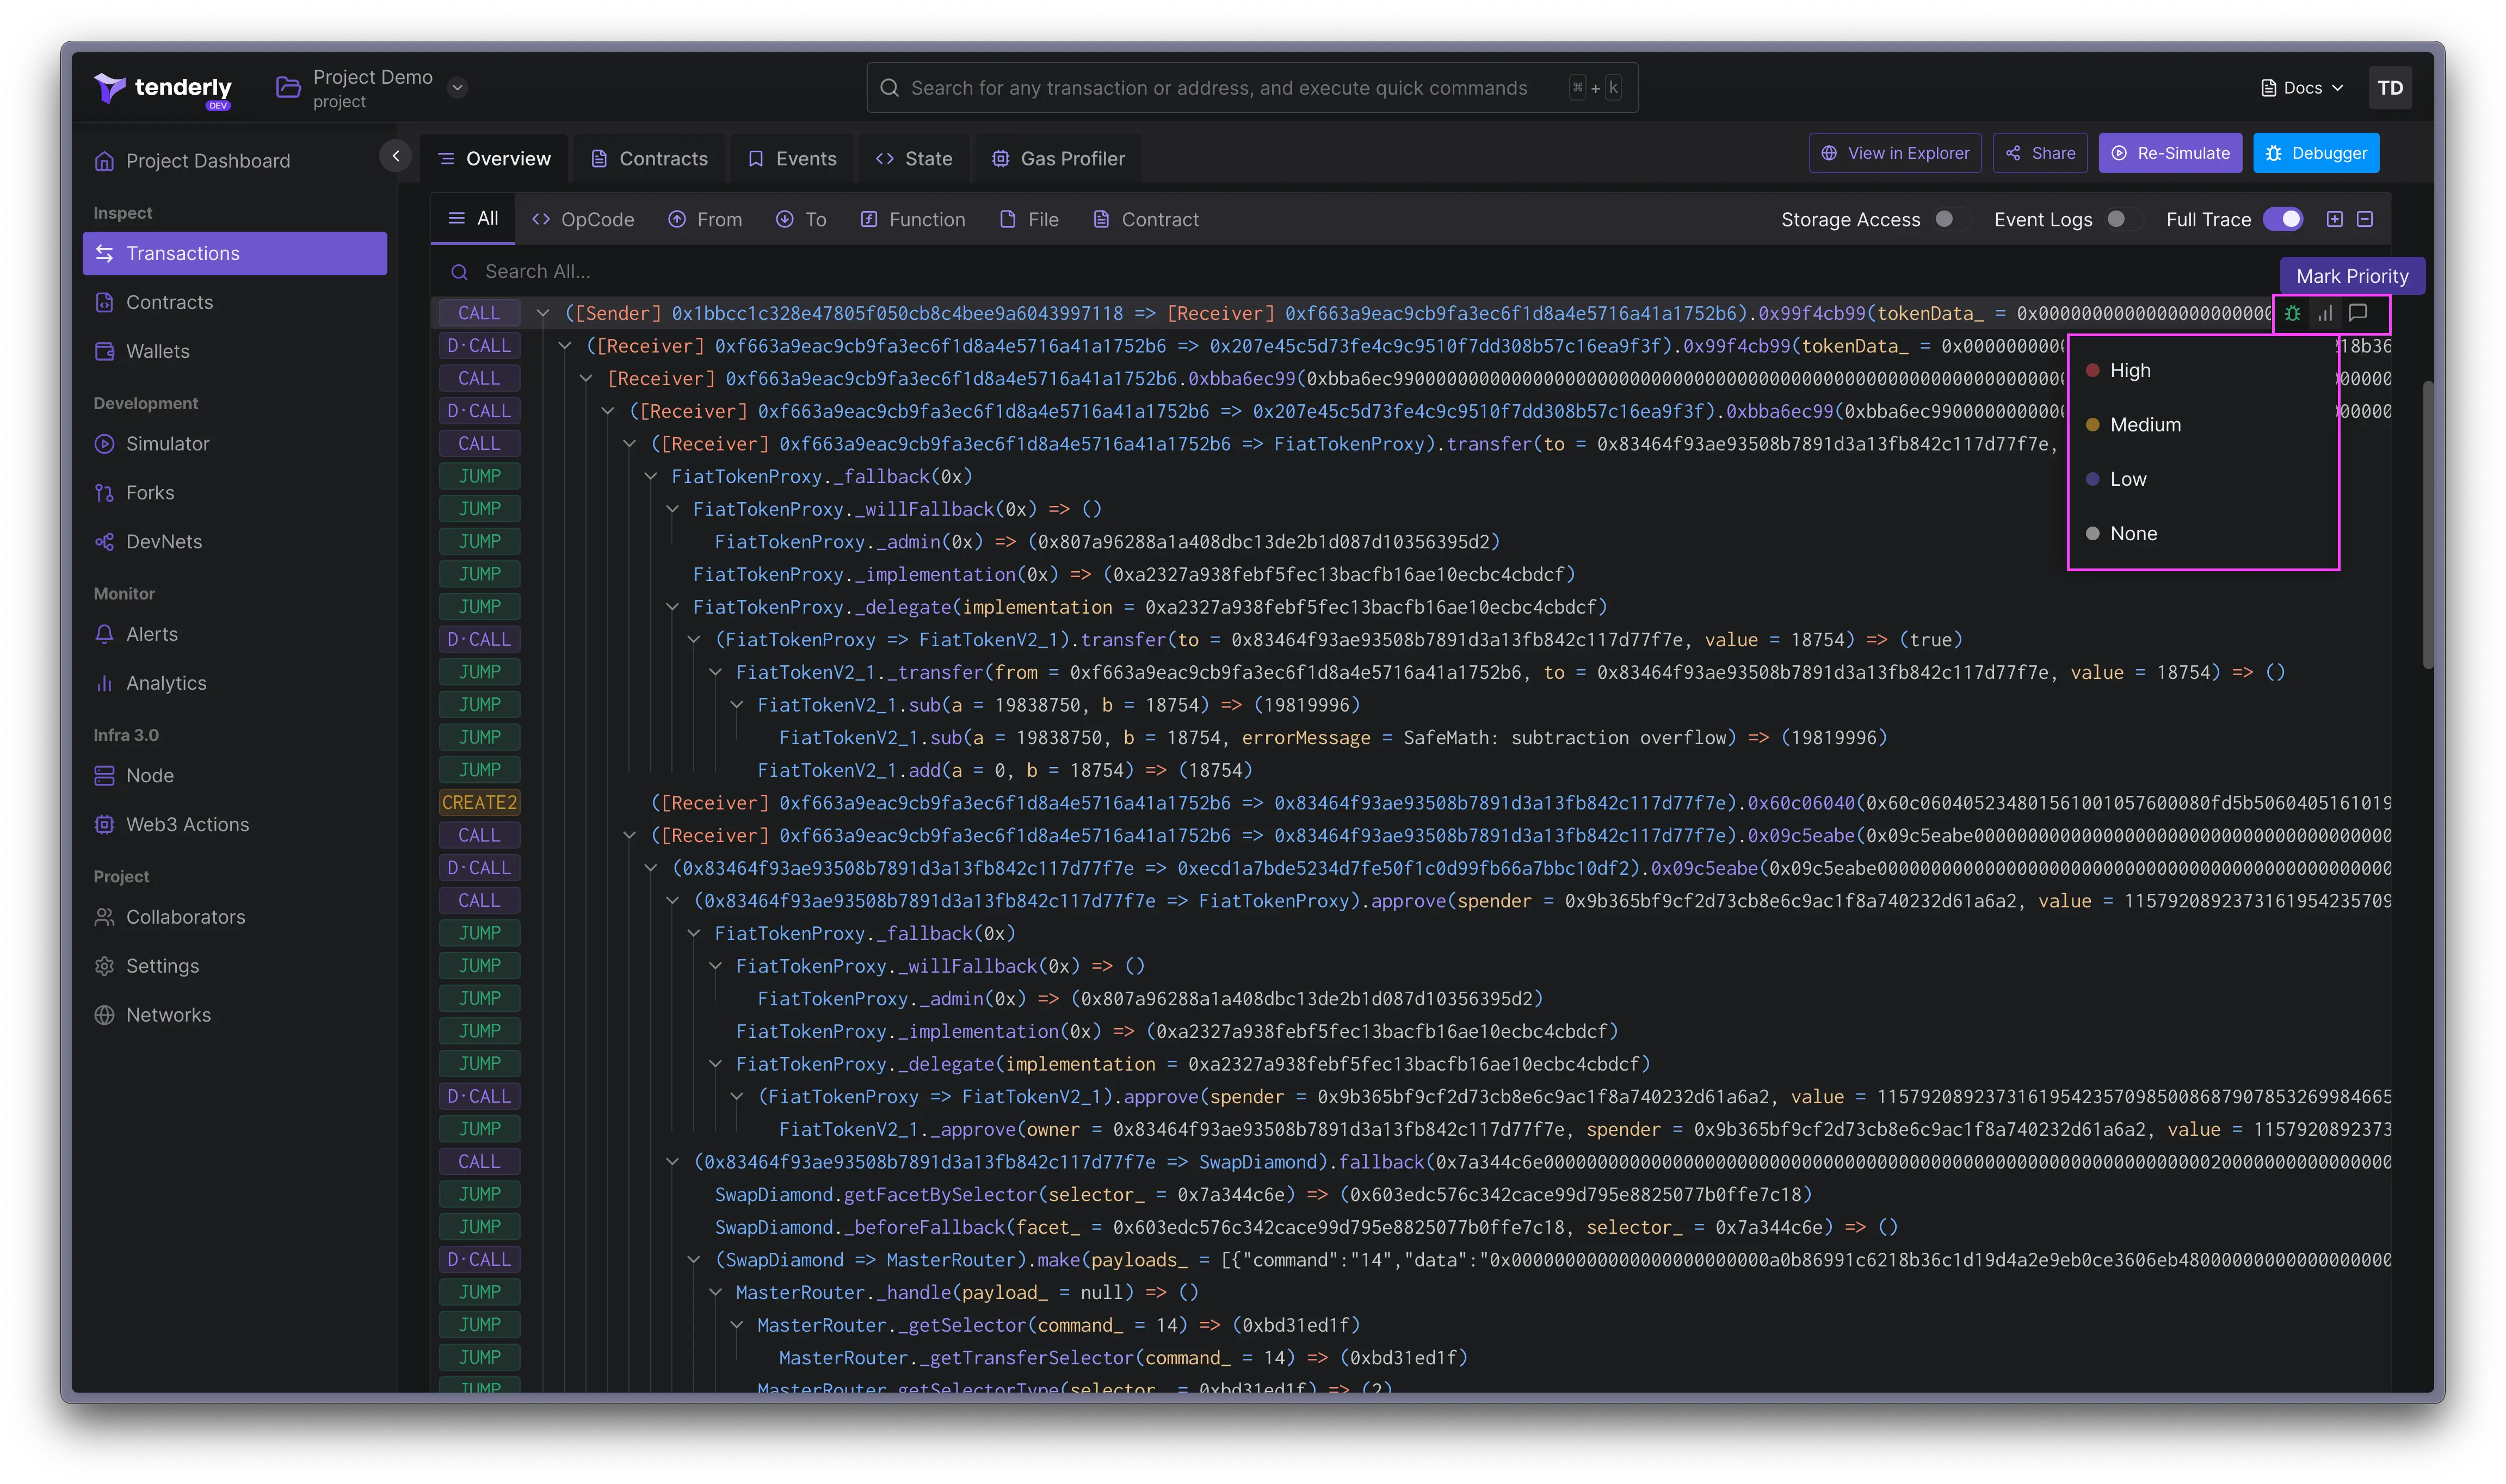
The prioritization feature is helpful when you notice a problematic call in the trace and want to alert your team to investigate.
Tokens transferred
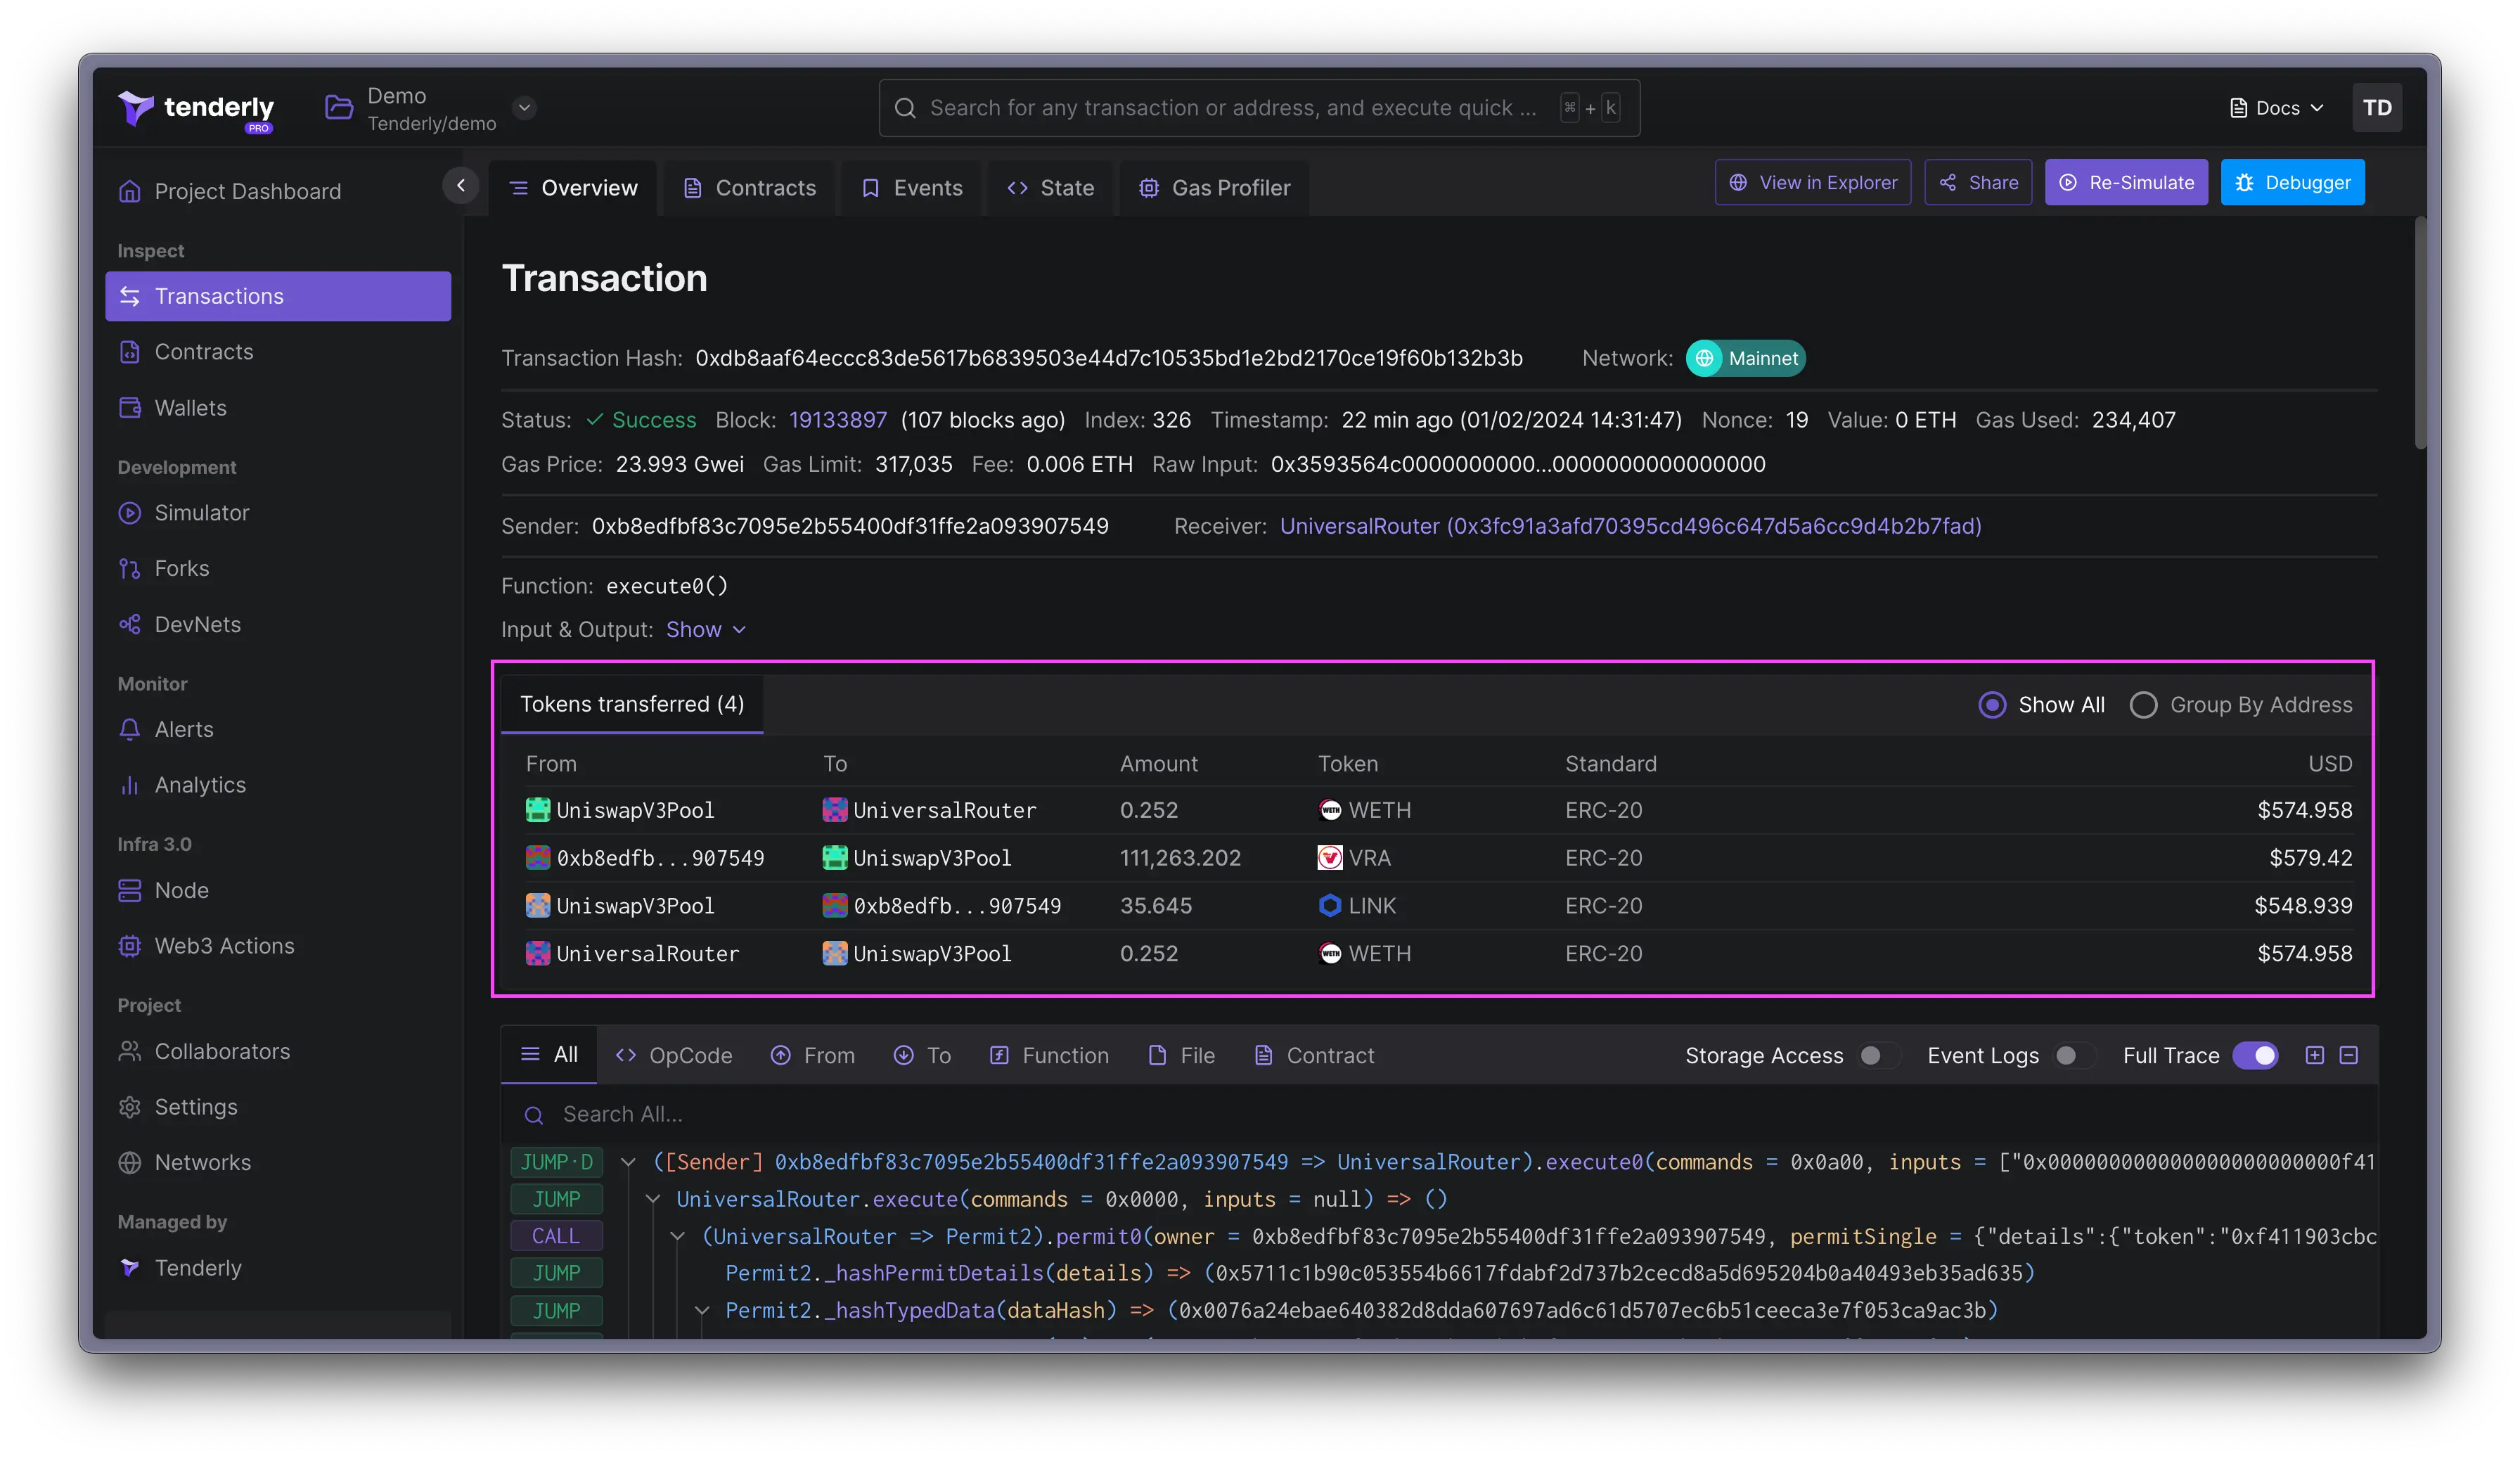
The Tokens Transfers panel shows all the asset transfers that happened with the transaction, including balance and asset changes converted into dollars using CoinGecko data.
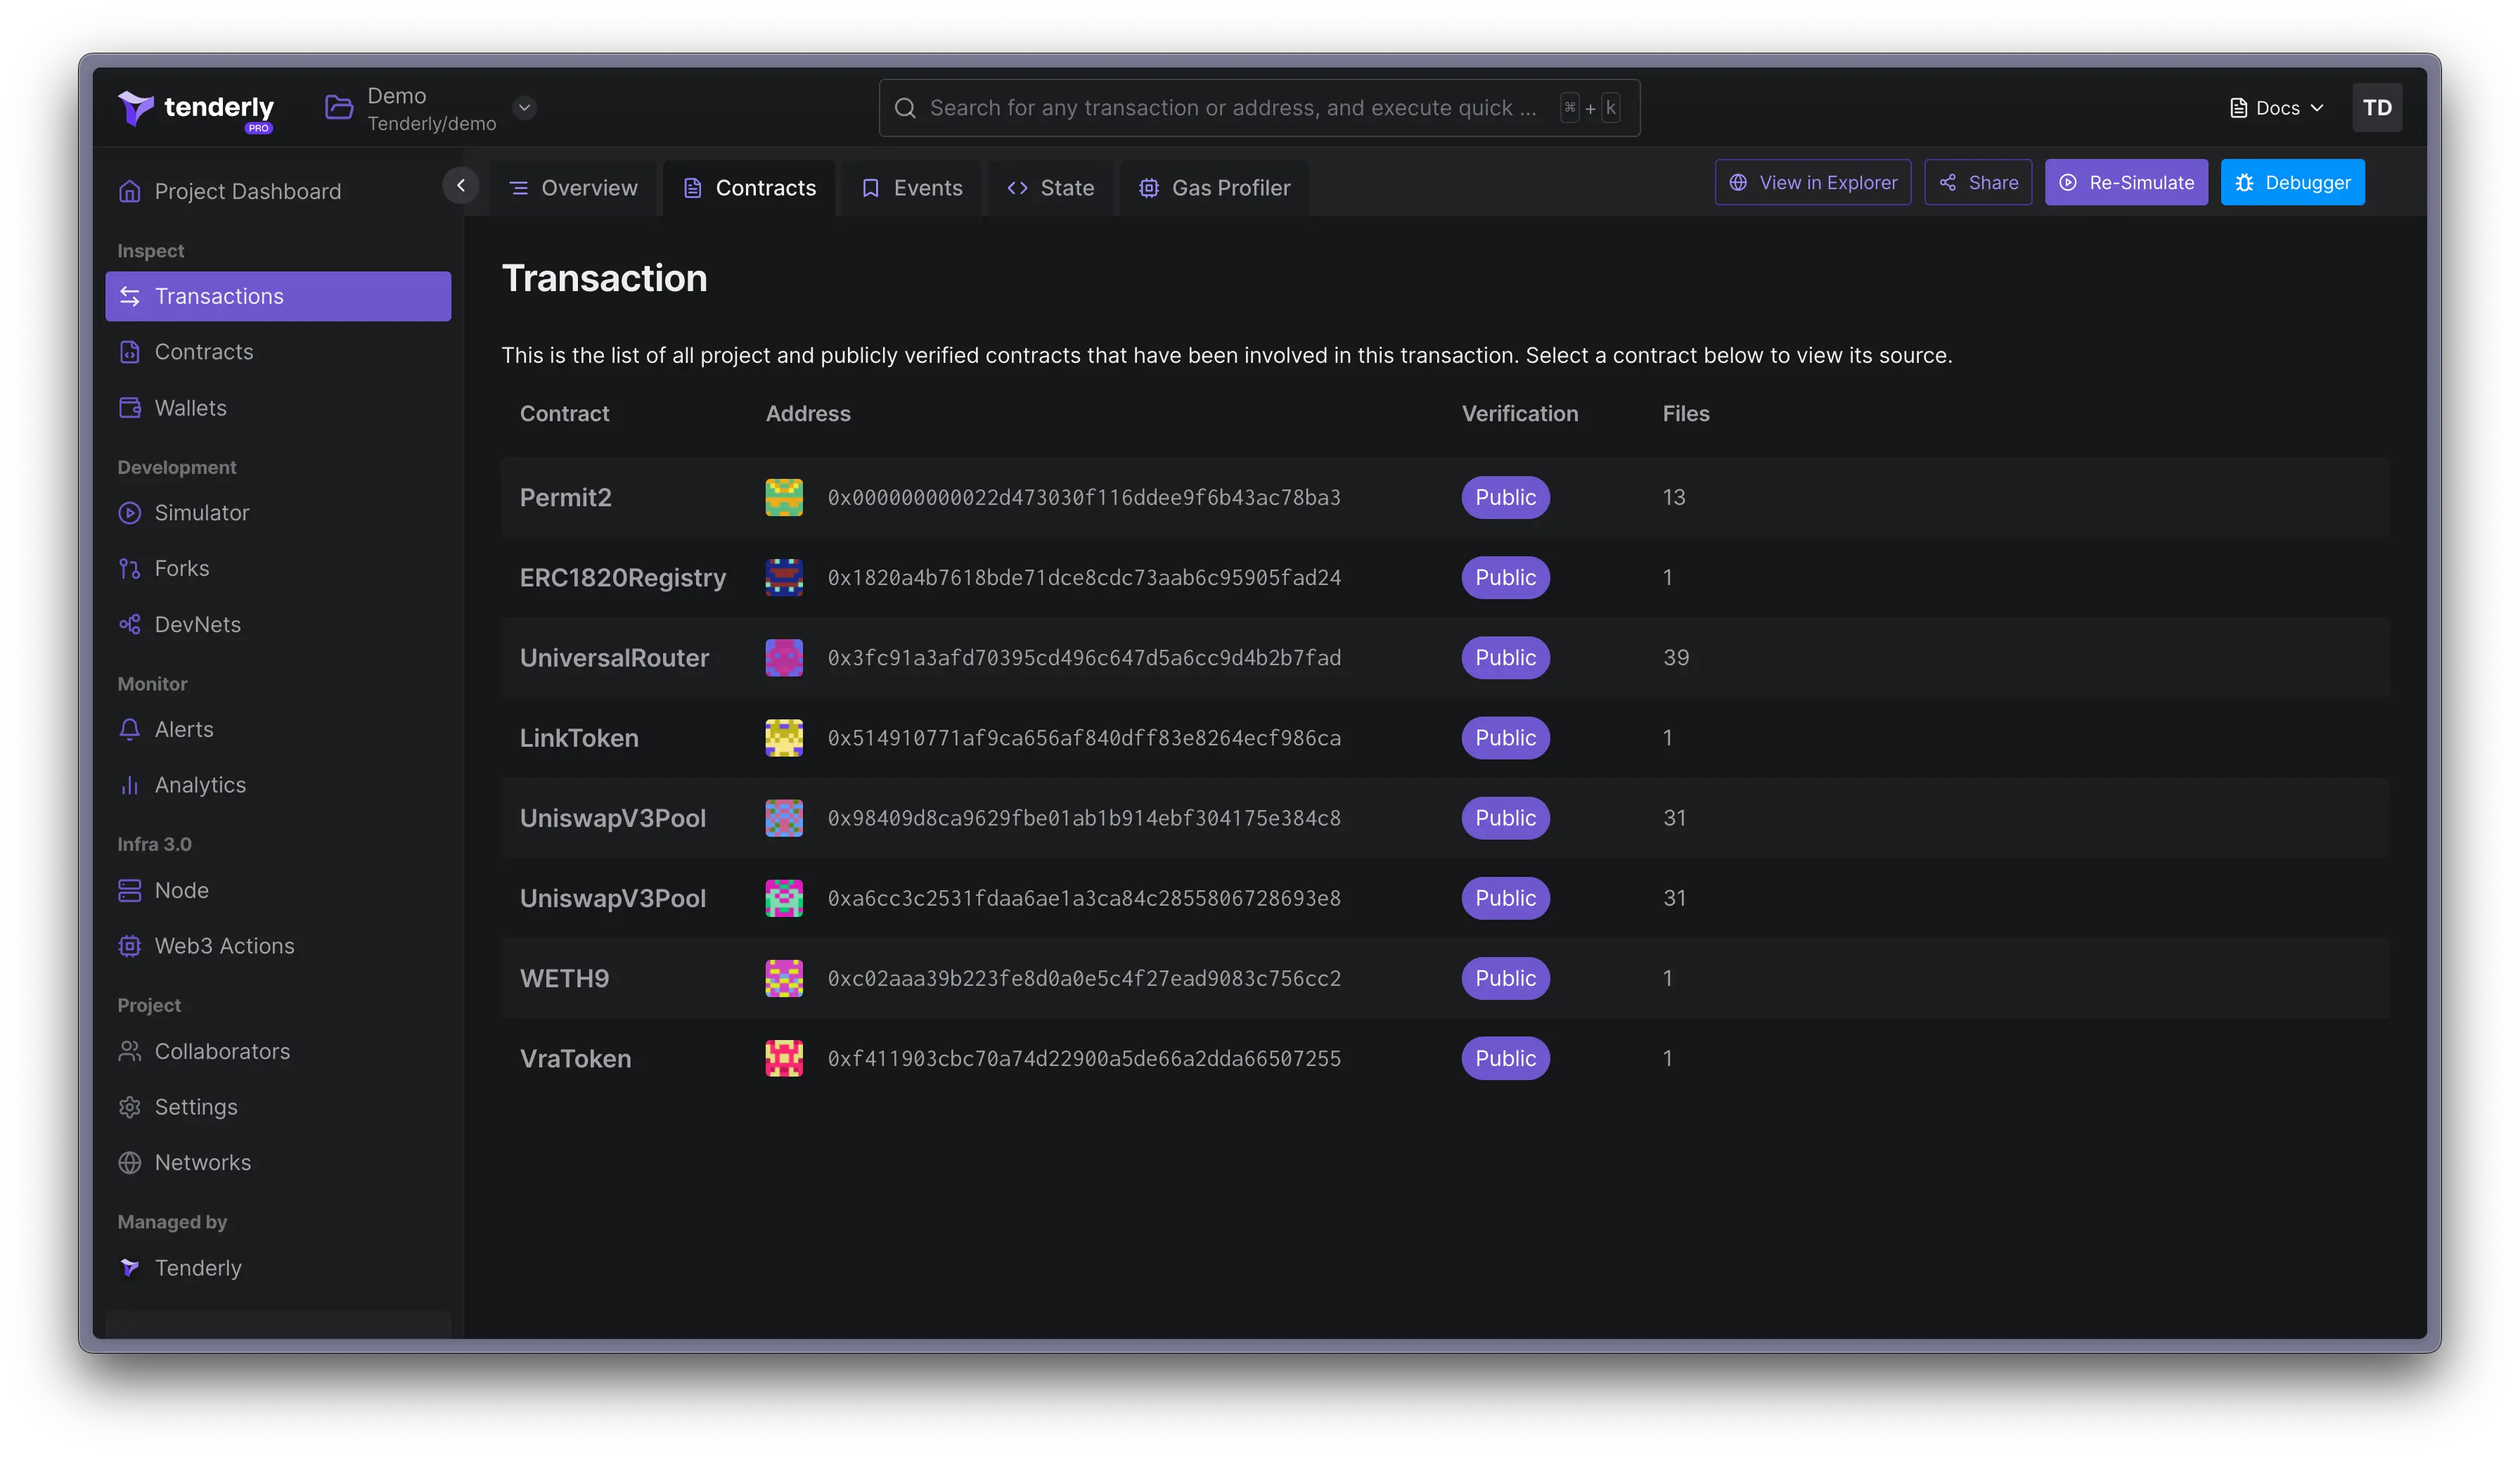
Involved contracts
The Contracts tab contains a list of all the contracts that were involved in the transaction execution. Click on a specific contract to inspect its source code.
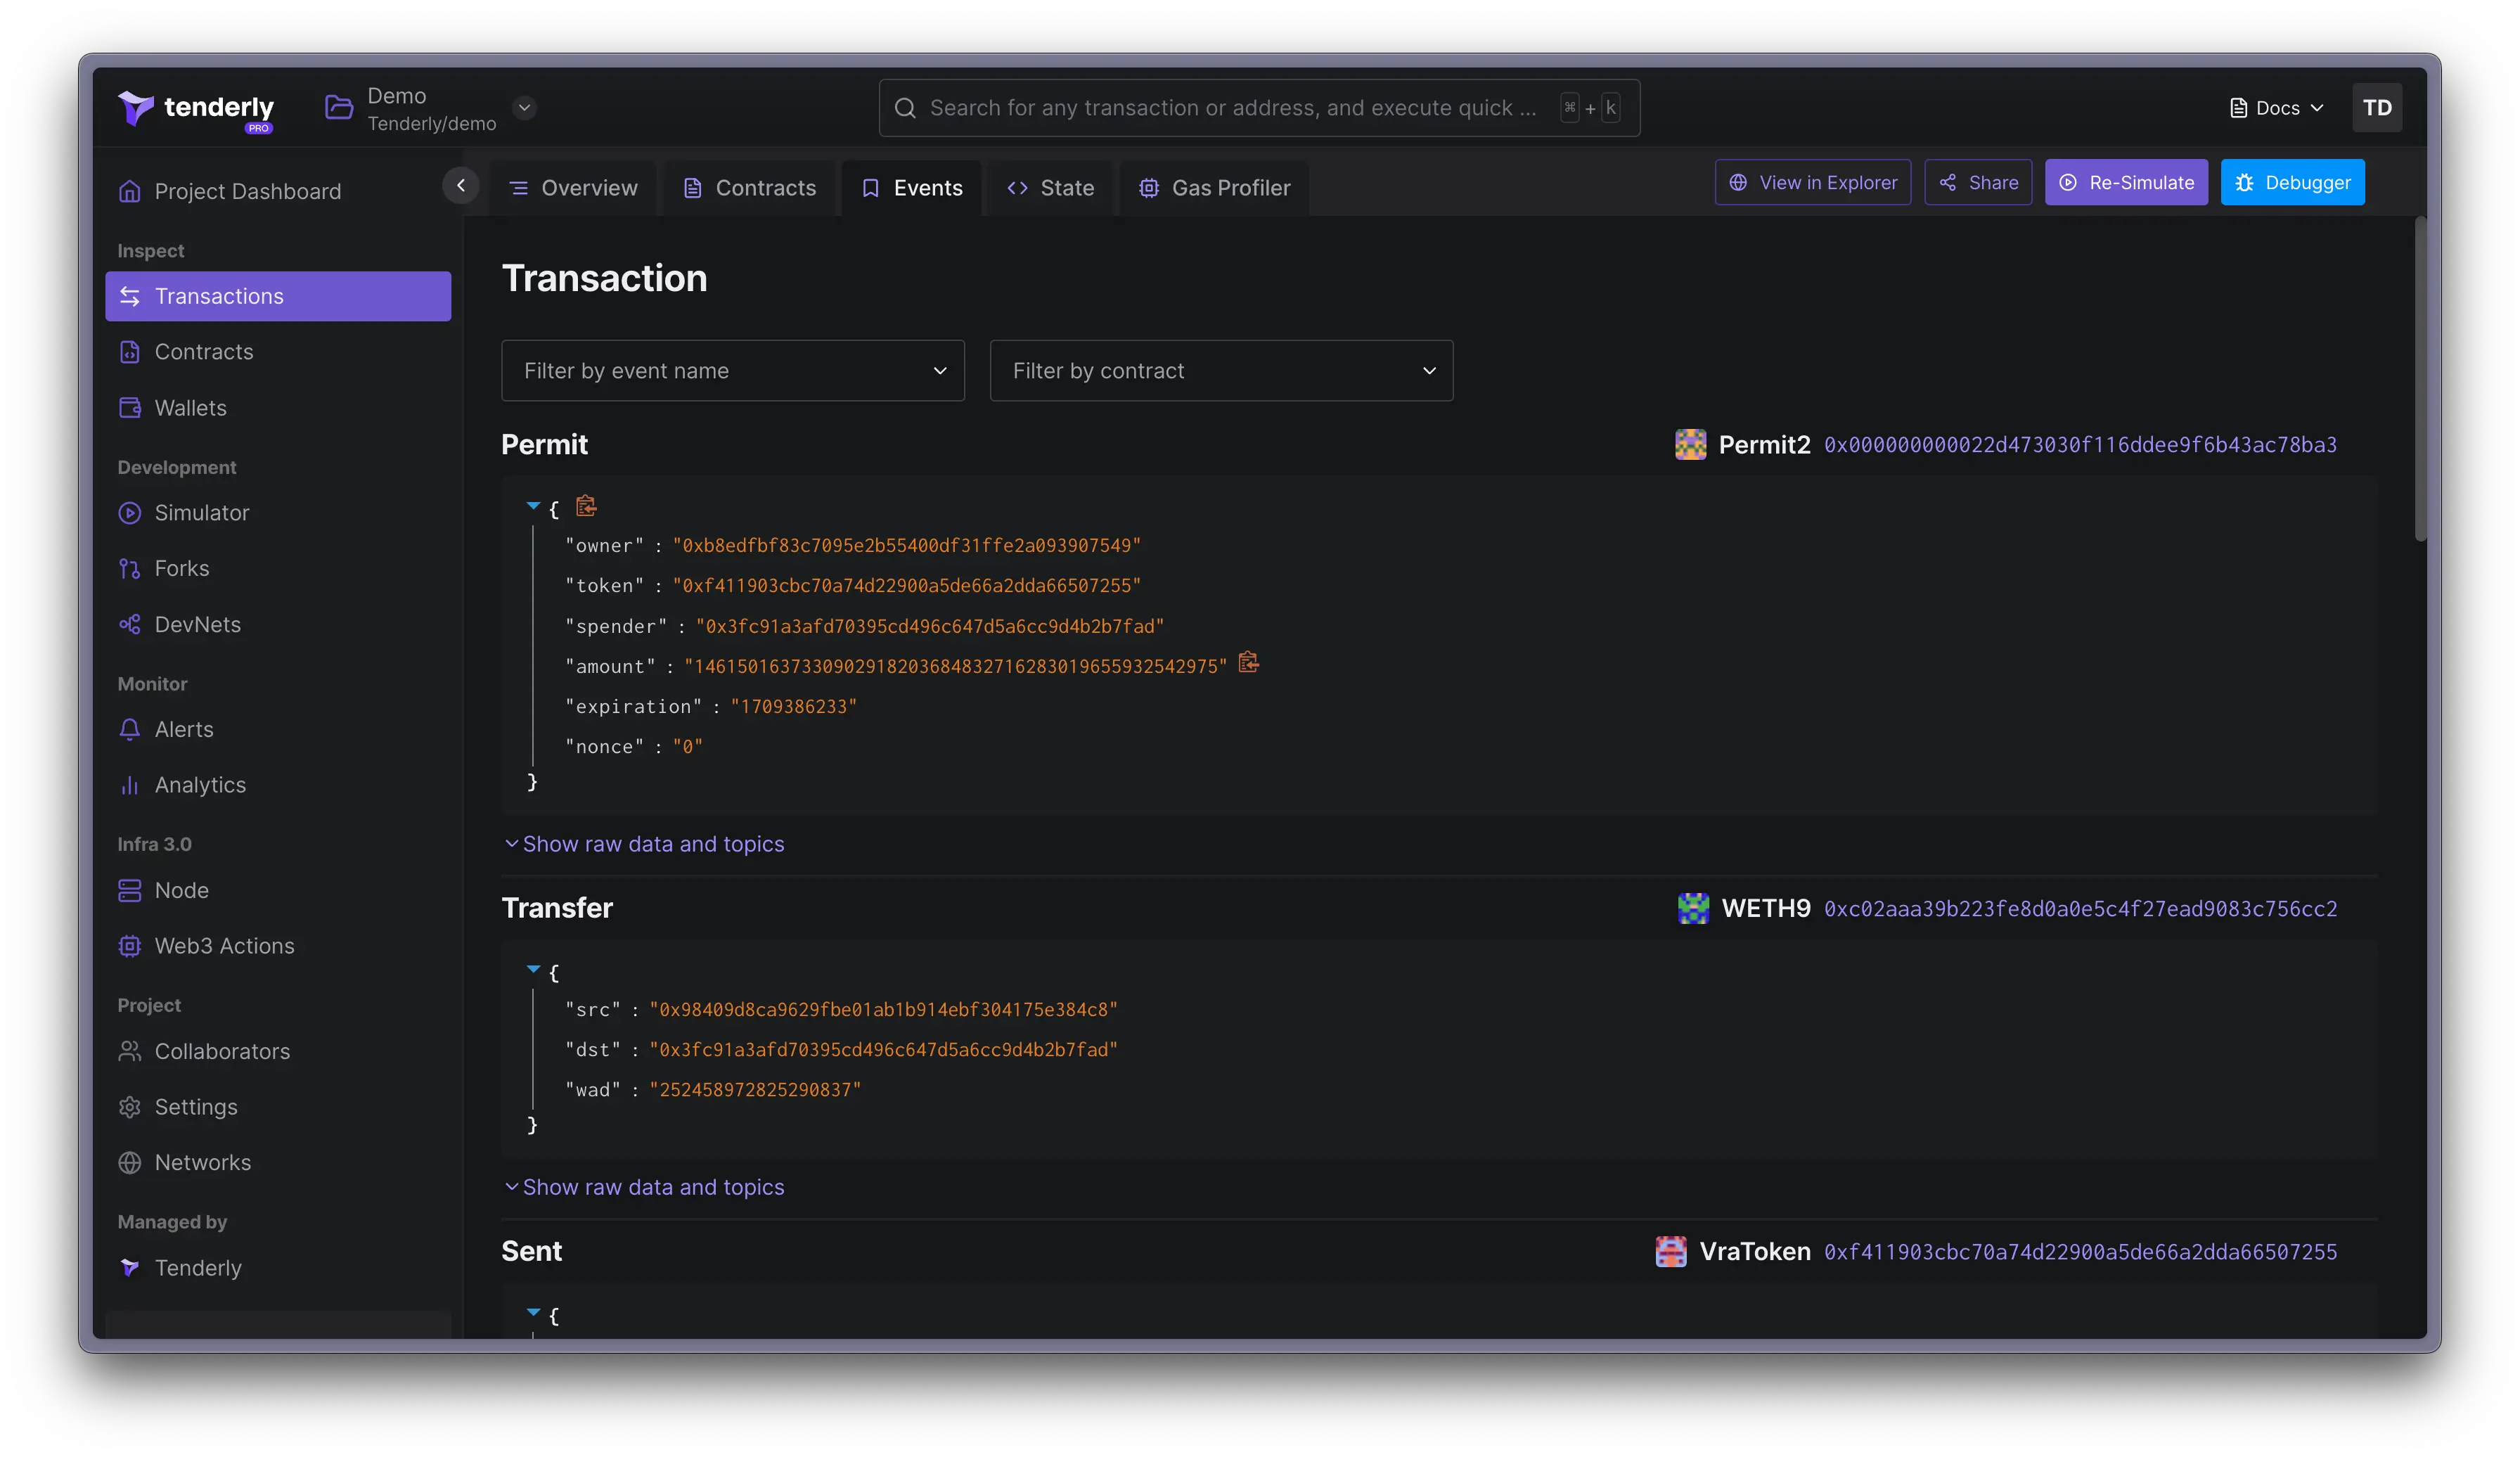
Emitted events
The Events tab lists all events that happened as a result of the transaction. This is the same data as what you see when the Events Logs toggle is turned on in the call trace. The format of the data displayed is different. If the contract is verified, you’ll see decoded data, but raw data is also available.
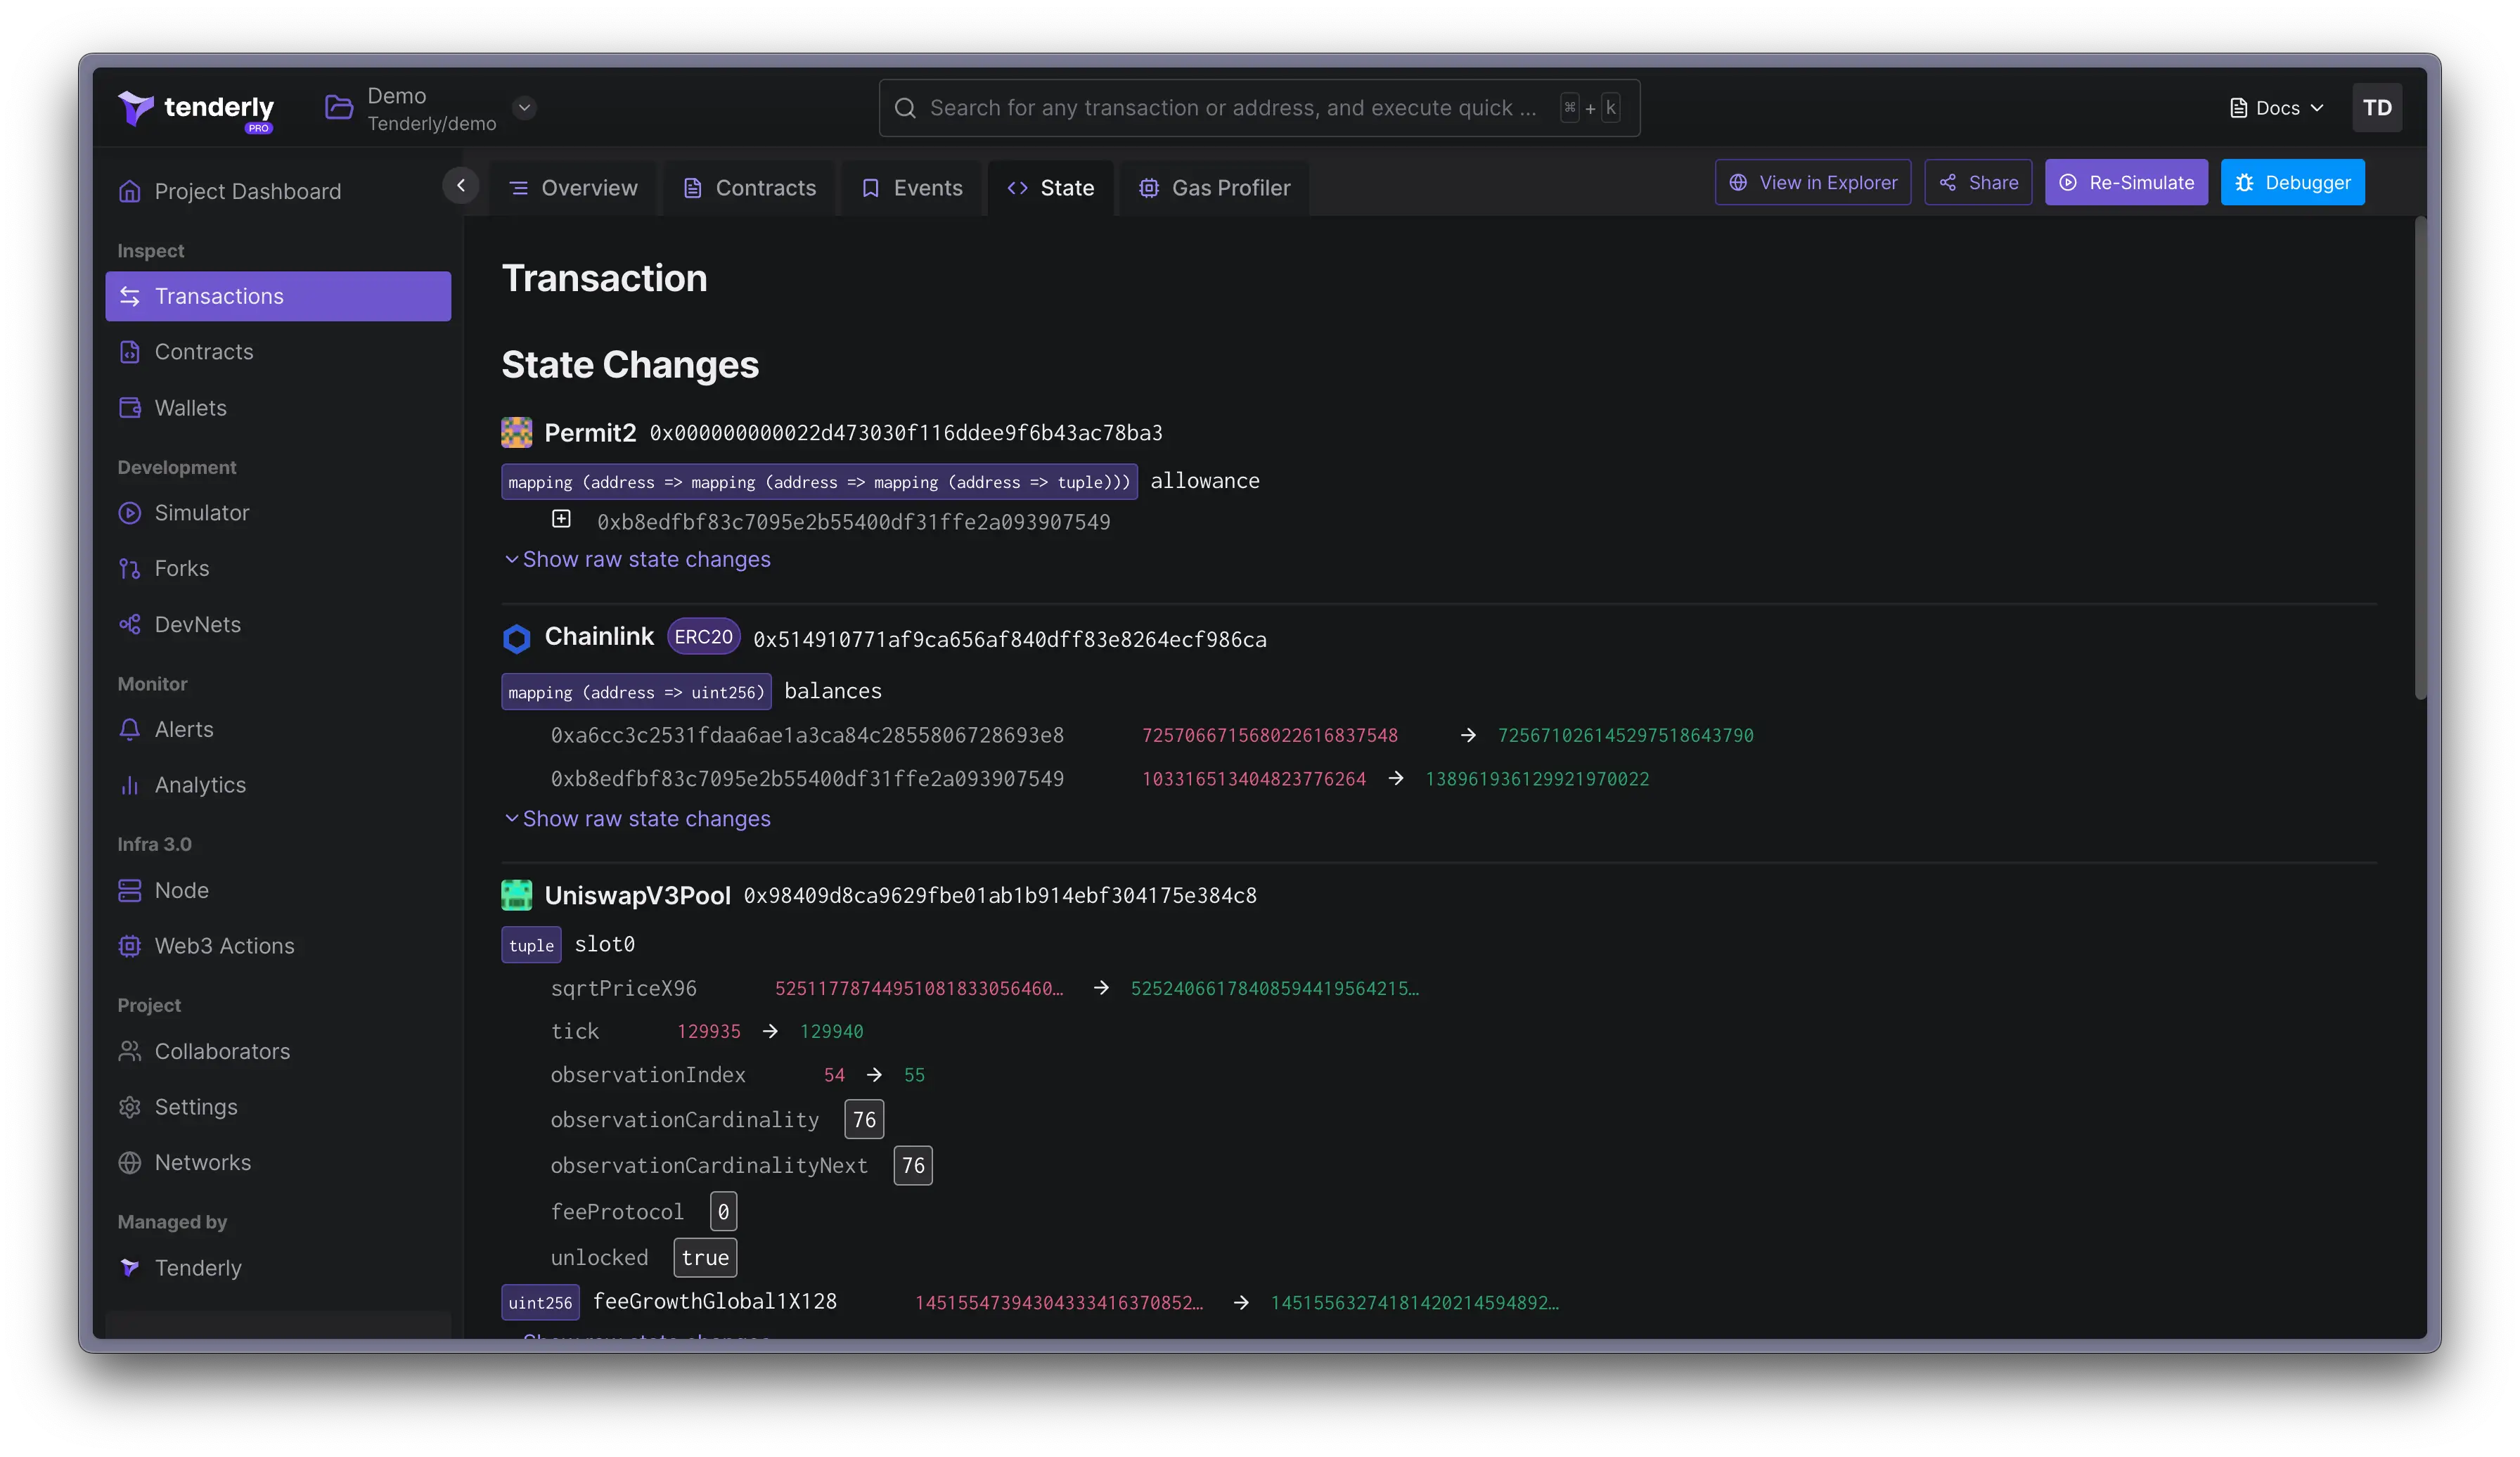
State changes
The State tab shows all events or variables that have in some way altered the state of the blockchain. This includes old and new values. All the data is decoded but you can also view the raw state changes.
You can get the data about state changes via RPC. Learn more about the
tenderly_trace,
tenderly_simulate and
tenderly_simulateBundle RPC methods.
Gas Profiler
The Gas Profiler tab provides a visual way to see how, where, and how much gas was used to execute a transaction. This data is displayed in the form of a flame chart with details about gas usage broken down by function and opcode.
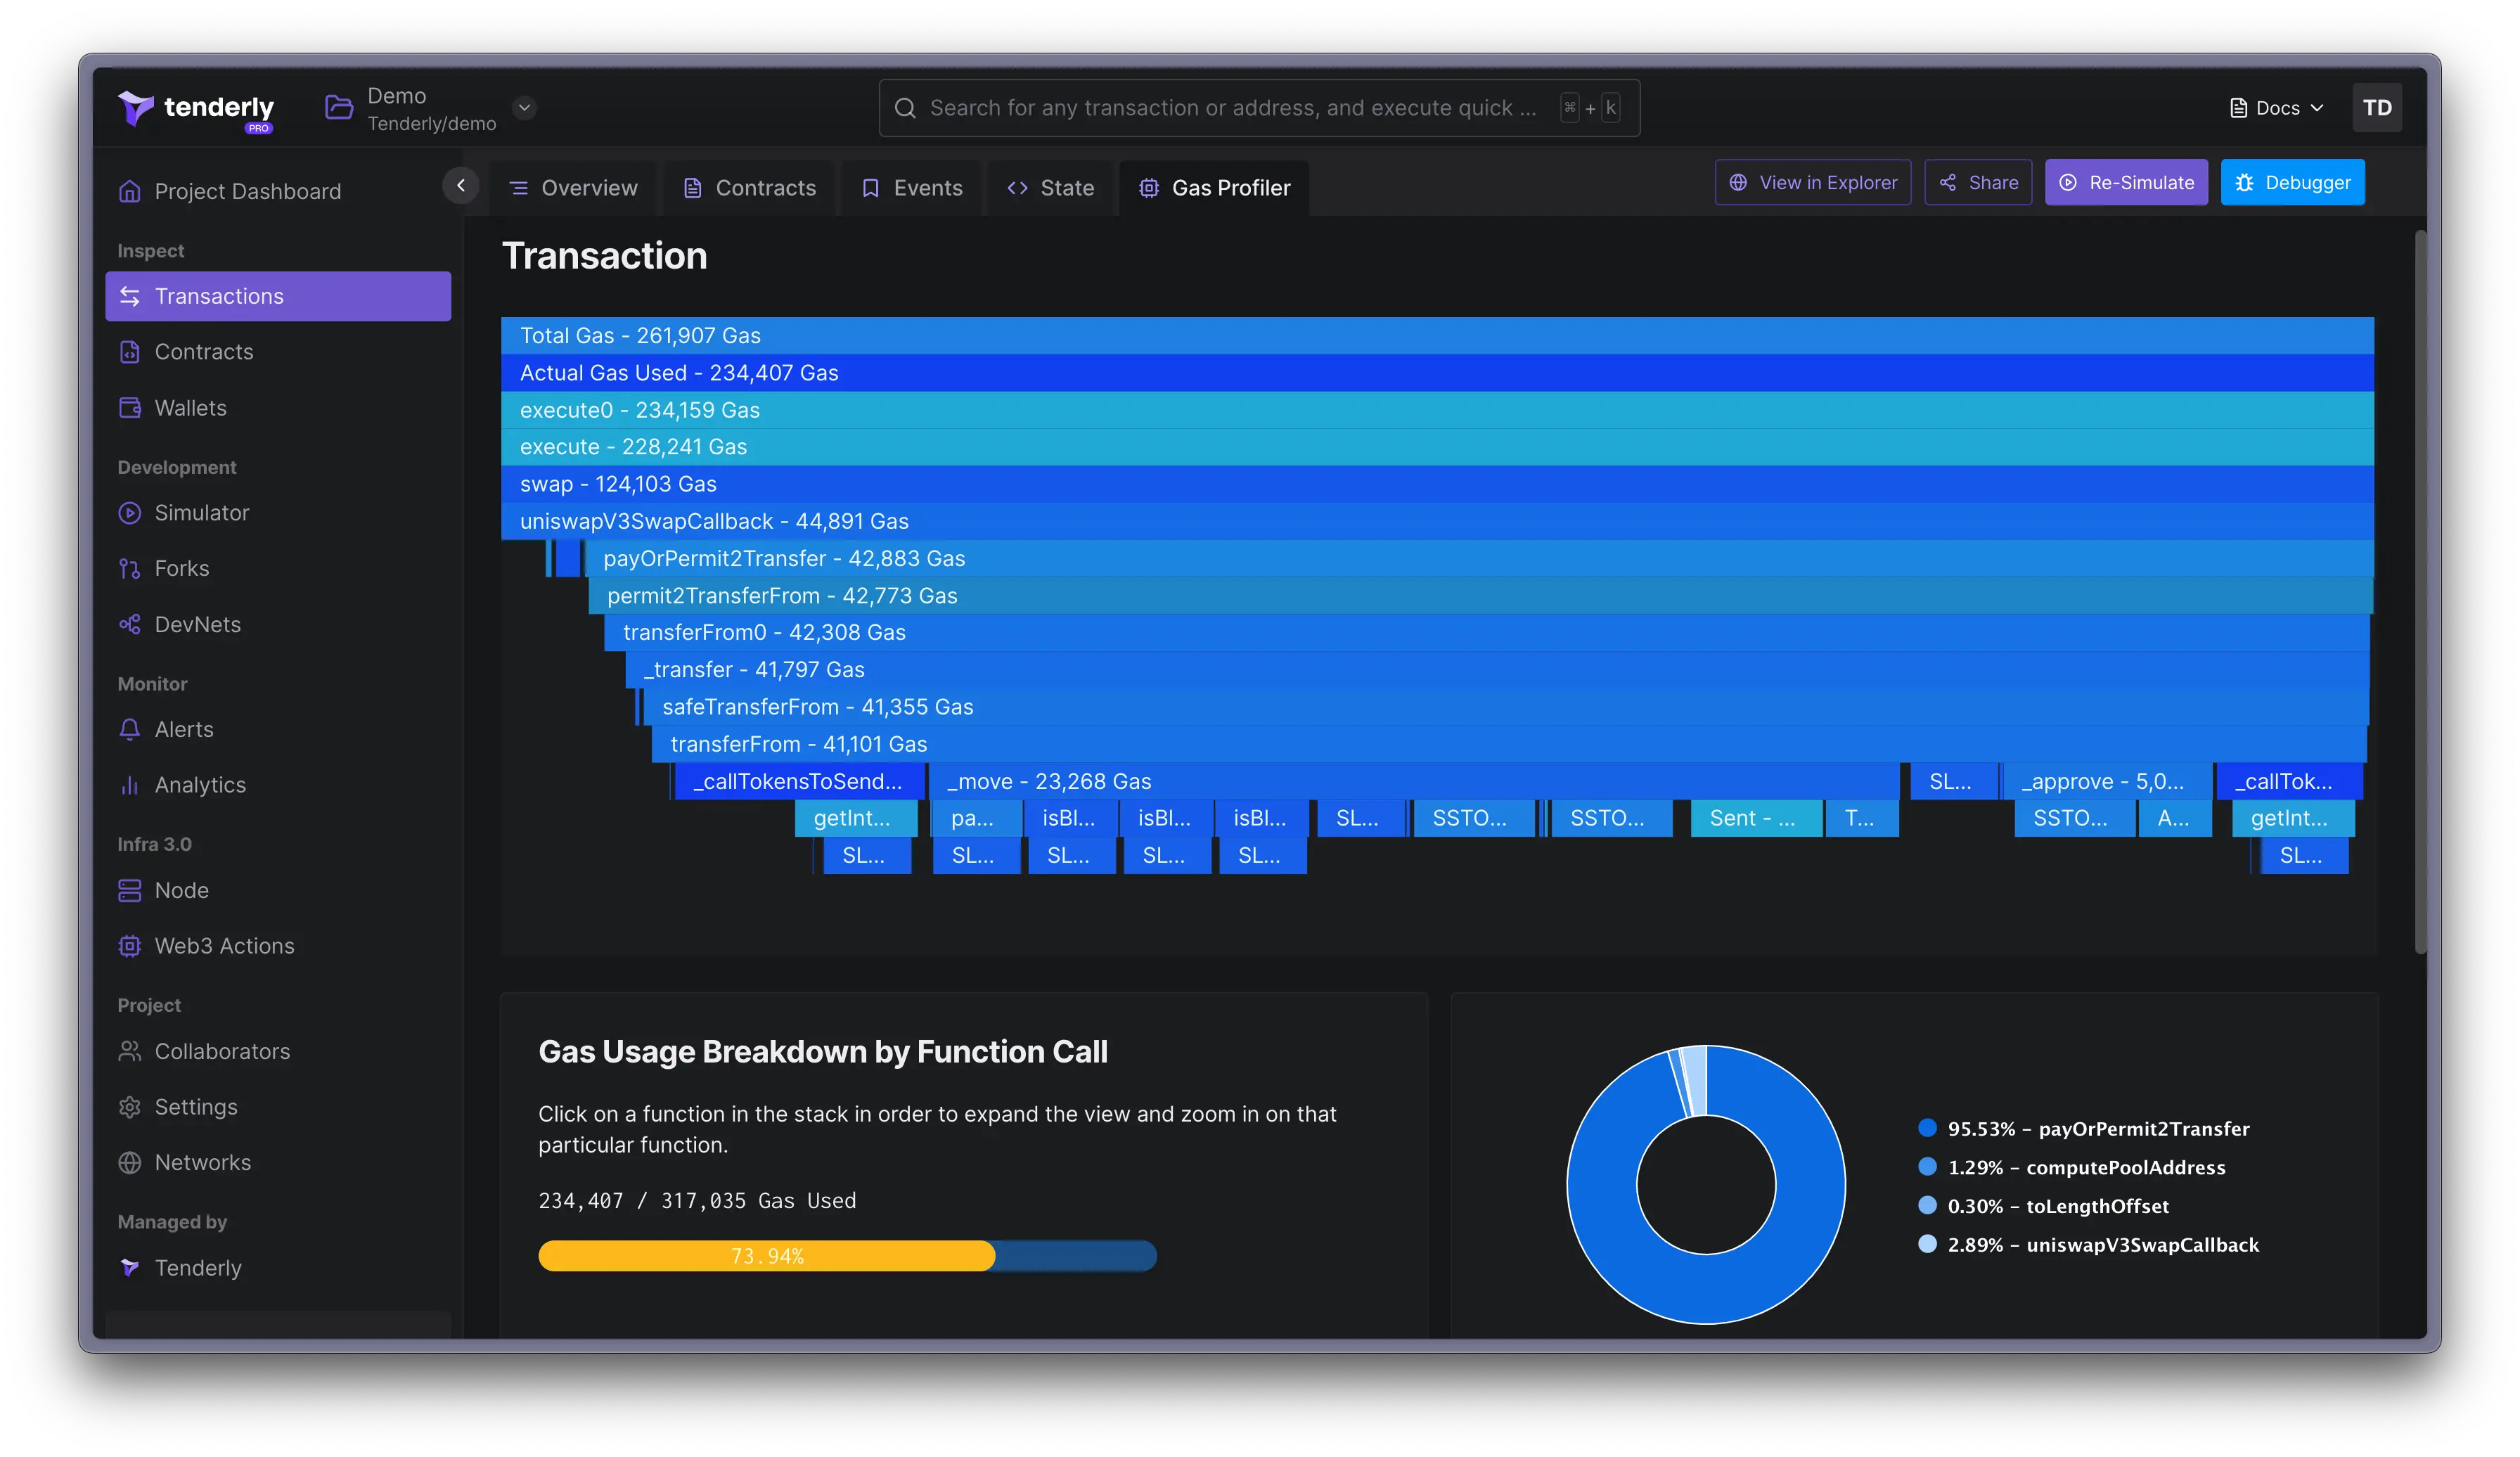
You can click on any of the functions or opcodes to dig deeper into how gas was used.
Click on View in Debugger when you’re ready to start debugging problematic functions and optimizing how your smart contract consumes gas. The Gas Profiler gives you insights into gas used and total gas used.
Check out this detailed guide to learn how to use Gas Profiler and how gas consumption is calculated: